

Abstract
Background: To screen for risk predictors of hypertension in patients with Obstructive Sleep Apnea Hypopnea Syndrome (OSAHS) and develop and validate a clinical model for individualized prediction of hypertension in consecutive patients with OSAHS. Methods: 114 consecutive patients with OSAHS confirmed by PSG monitoring participated in this study. Those individuals were divided into two sets at a ratio of 7:3, using computer-generated random numbers: 82 individuals were assigned to the training set and 32 to the validation set. Important risk predictors of hypertension in individuals with OSAHS were confirmed using the LASSO method and a clinical nomogram constructed. The predictive accuracy was assessed by unadjusted concordance index (C-index) and calibration plot. Results: Univariate and multivariate regression analysis identified BMI, REM-AHI, REM-MSpO2 and T90% as predictive risk factors of OSAHS. Those risk factors were used to construct a clinical predictive nomogram. The calibration curves for hypertension in patients with OSAHS risk revealed excellent accuracy of the predictive nomogram model, internally and externally. The unadjusted concordance index (C-index) for the training and validation set was 0.897 [95% CI 0.795-0.912] and 0.894 [95% CI 0.788-0.820] respectively. The AUC of the training and validation set was 0.8175882 and 0.8031522, respectively. Decision curve analysis showed that the predictive model could be applied clinically when the threshold probability was 20 to 80%. Conclusion: We constructed and validated a clinical nomogram to individually predict the occurrence of hypertension in patients with OSAHS. We determined that BMI, REM-AHI, REM-MSpO2 and T90% were independent risk predictors for hypertension in patients with OSAHS. This practical prognostic nomogram may help improve clinical decision making.
Keywords: Obstructive sleep apnea hypopnea syndrome, hypertension, clinical model, risk predictors
Introduction
Obstructive sleep apnea hypopnea syndrome (OSAHS) is characterized by recurrent complete or partial occlusion of the upper airway during sleep, resulting in intermittent hypoxia, hypercapnia, decreased intrathoracic pressure and micro arousal, leading to daytime sleepiness and decreased quality of life [1]. The prevalence of OSAHS has been reported to be 7.8 to 77.2% in the middle-aged population around the world [2]. OSAHS is associated with a variety of cardiovascular diseases including hypertension, coronary heart disease, myocardial infarction and arrhythmia as well as other metabolic diseases such as diabetes, hyperlipidemia, and nonalcoholic fatty liver disease [3-7]. It is estimated that 30 to 40% of hypertensive patients have OSAHS and 35 to 80% of OSAHS patients have hypertension [8]. Accumulated evidence shows that OSAHS is an independent risk factor for the hypertensive population [9].
Recent studies [10-12] of the cause and effect relationship between hypertension and OSAHS have revealed that the two disorders show common mechanisms that include increased sympathetic neural activity, activated systemic inflammation, and oxidative stress [13,14]. A retrospective cohort study showed that age, BMI, and daytime and nocturnal hypoxia played a role in the development of OSA-related hypertension [8]. Nonetheless their clinical predictive value and accuracy are not high. There is an urgent need for a reliable clinical method to predict hypertension in patients with OSAHS.
Clinical risk prediction models have been applied in many diseases such as type 2 diabetes, cancer and heart failure [15-17]. Although there is a risk prediction model for OSAHS [18] there is a lack of diagnostic methods and a risk prediction model for hypertension in patients with OSAHS. Thus the diagnosis of OSA-related hypertension is often missed.
We conducted this study to screen for risk predictors of hypertension in patients with OSAHS, and to develop and validate a clinical nomogram for individualized prediction of hypertension in consecutive patients with OSAHS.
Methods
Study design
This study was a single-center case-control study to identify predictors of hypertension in consecutive patients with obstructive sleep apnea hypopnea syndrome. Between May 2017 and November 2020, 114 consecutive participants who had undergone polysomnography (PSG) and 24-hour ambulatory blood pressure monitoring (ABPM) were admitted to the sleep respiratory center at the First Affiliated Hospital of Guangzhou Medical University. The procedures of this clinical trial are presented as Figure 1.
Figure 1.
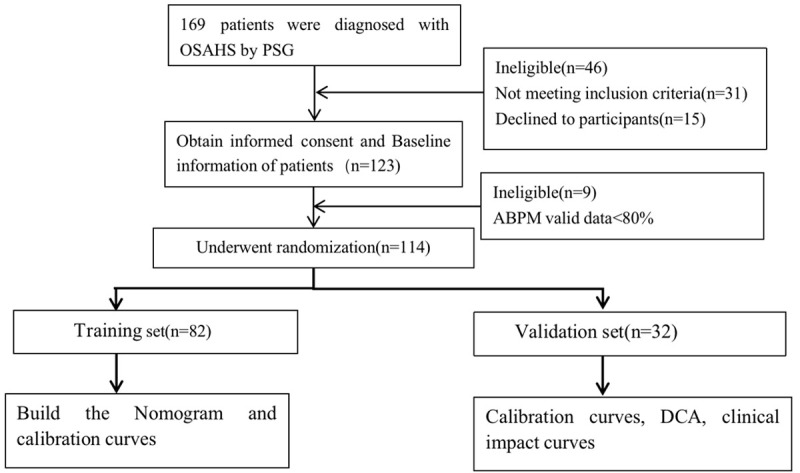
Flow chart showing recruitment.
Inclusion criteria
(1) Aged ≥18 years old; (2) Patients had not taken antihypertensive medication before this study; (3) Patients had a diagnosis of OSAS confirmed on PSG and showing an apnea-hypopnea index (AHI) ≥15/h according to the American Academy of Sleep Medicine 2012 scoring rules [19]; and (4) Patients not treated for OSAHS.
Exclusion criteria
(1) central and mixed sleep apnea hypopnea; (2) renal parenchyma or renal vascular disease; (3) a history of secondary hypertension; (4) cardiovascular disease such as aortic insufficiency, coarctation or Takayasu arteritis; (5) severe lung disease, neuromuscular disease, or mental or psychological diseases; (6) acute or chronic heart, liver, kidney, or digestive system diseases; (7) chronic insomnia, restless legs syndrome, narcolepsy or other sleep disorders; or if they were (8) pregnant or breast-feeding.
Ethics approval statement
This study was approved by the Ethics Committee of the First Affiliated Hospital of Guangzhou Medical University (NO. 2018032) and written informed consent was obtained from all participants. The study complied with the Declaration of Helsinki and was registered with the Chinese Clinical Trial Registry (ChiCTR1800016503).
Data collection and measurement
We collected characteristic data of the subjects, such as age, sex, BMI, neck circumference, waist circumference, ESS, and PSG parameters of sleep. Furthermore, blood samples were collected, including total cholesterol (TC), triglycerides (TGs), LDL, high-density lipoprotein (HDL), creatinine, uric acid, and HbA1c.
Definitions
Diagnosis of hypertension [20] was made in the absence of any antihypertensive drugs and if blood pressure value on three days was systolic ≥140 mmHg and/or diastolic ≥90 mmHg. The diagnosis of OSAS was confirmed on PSG that was showing an apnea-hypopnea index (AHI) ≥15/h according to the American Academy of Sleep Medicine 2012 scoring rules [19].
Statistical analysis
SPSS 22.0 software (SPSS Inc. Chicago, IL, USA) was used for statistical analysis. K-S (Kolmogorov Smirnov test) was used to test the normality of data. Data with a normal distribution were expressed as mean ± standard deviation (±s). One way ANOVA test was used to compare multiple groups, and LSD (least significant difference) test used to compare the two groups of data. Data with a non-normal distribution were represented by median (P25, P75). Comparison between groups was made using nonparametric test, and comparison between the two groups by Kruskal-Wallis test. Data of categorical variables were expressed as cases (%), and chi square test was used for comparison between groups. By univariate and multivariate logistic regression, the independent variable screening methods were input method and backward stepwise method. In multiple linear regression, the independent variable selection method is the step-by-step method. A nomogram was constructed on the basis of independent determinants identified in the multivariate Cox regression and the area under the curve (AUC) by R software 3.3.0 (R Foundation for Statistical Computing, Vienna, Austria, www.r-project.org). Receiver operating characteristic (ROC) curve was used to evaluate the calibration of the predictive model [21]. We conducted decision curve analysis by the package of R software to evaluate the clinical usefulness of the model [22]. P value <0.05 was considered significant.
Results
Characteristics of the subjects
We initially recruited 169 consecutive patients with confirmed OSAHS diagnosed by PSG. After excluding 15 who refused to participate, 31 who did not fulfill the inclusion criteria, and 9 in whom valid data for ABPM were <80%, 114 were studied. Patients were categorized according to the results of 24-hour ambulatory blood pressure monitoring as hypertensive (n=71) or normotensive (n=43) (Figure 1). The demographic characteristics of the 114 subjects are shown in Table 1. The prevalence rate of hypertension in the OSAHS population was up to 62.3%. There were differences in BMI, neck circumference and waist circumference between the two groups (P<0.05).
Table 1.
Comparison of clinical data between the three groups
| Index | hypertensive group (n=71) | normotensive group (n=43) | P value |
|---|---|---|---|
| Age (years) | 42.00 (36.00-47.00) | 49.00 (41.50-53.00) | 0.644 |
| Sex | 0.226 | ||
| Male (n%) | 66 (92.6%) | 37 (86%) | |
| Female (n%) | 5 (7.0%) | 6 (14%) | |
| BMI (Kg/m2) | 28.28±3.13 | 26.39±3.84 | 0.005 |
| Neck circumference (cm) | 41.00 (39.00-44.00) | 40.00 (37.50-43.00) | 0.011 |
| Waist circumference (cm) | 104.00 (99.00-109.00) | 96.00 (92.00-101.00) | 0.001 |
| Smoking (%) | 39 (54.93) | 19 (44.19) | 0.176 |
| Drinking (%) | 34 (47.89) | 21 (48.84) | 0.905 |
| Diabetes (%) | 4 (5.63) | 3 (6.98) | 0.772 |
| ESS (score) | 12.09±5.76 | 10.43±5.74 | 0.151 |
| FBG (mmol/L) | 5.24 (4.60-5.87) | 4.80 (4.27-5.59) | 0.895 |
| PBG (mmol/L) | 7.27 (5.36-9.45) | 6.01 (5.34-9.09) | 0.438 |
| HbA1c (mmol/mol) | 5.80 (5.70-6.40) | 5.60 (5.35-5.85) | 0.051 |
| Scr (umol/L) | 77.00 (71.50-86.50) | 72.00 (63.00-80.00) | 0.052 |
| UA (umol/L) | 485.12±94.79 | 435.56±92.98 | 0.092 |
| TC (mmol/L) | 4.82±1.15 | 4.84±1.17 | 0.948 |
| TG (mmol/L) | 1.86 (1.48-2.71) | 1.59 (1.18-2.66) | 0.212 |
| HDL (mmol/L) | 1.11±0.20 | 1.17±0.26 | 0.318 |
| LDL (mmol/L) | 3.15±0.73 | 3.24±0.88 | 0.685 |
Note: P<0.05. BMI: body mass index; ESS: Epworth Sleepiness Scale; FBG: fasting blood glucose; PBG: 2 hours postprandial blood glucose; HbA1c: glycosylated hemoglobin; SCR: serum creatinine; UA: serum uric acid; TC: total cholesterol; TG: triglyceride; HDL: high density lipoprotein cholesterol; LDL: low density lipoprotein cholesterol.
Comparison of polysomnographic data
As shown in the results, hypertensive patients had higher indexes of AHI, REM-AHI and NREM-AHI (P<0.001). In terms of oxygen saturation parameters, MSpO2, REM-MSpO2, NREM-MSpO2 and LSaO2 in the hypertension group were lower than those in the normotensive group. In addition, T90%, REM-T90% and NREM-T90% were significantly higher (P<0.001). Nevertheless there was no significant difference in TST, sleep efficiency, sleep latency, REM sleep latency or REM% between the two groups (P>0.05) (Table 2).
Table 2.
Comparison of polysomnographic data between the three groups
| Index | hypertensive group (n=71) | normotensive group (n=43) | P value |
|---|---|---|---|
| TST (min) | 420.05±78.49 | 395.95±64.99 | 0.094 |
| Sleep efficiency (%) | 85.40 (77.30-93.50) | 84.00 (78.00-91.90) | 0.490 |
| Sleep latency (min) | 19.00 (4.50-38.00) | 20.00 (1.50-35.20) | 0.806 |
| REM sleep latency (min) | 137.00 (89.60-232.70) | 137.00 (84.50-203.50) | 0.524 |
| MAI (times/h) | 33.20 (20.40-47.90) | 20.30 (14.00-35.10) | 0.102 |
| AHI (times/h) | 60.80 (40.80-70.60) | 25.30 (12.20-54.70) | <0.001 |
| REM-AHI (times/h) | 54.30 (48.00-72.00) | 36.70 (12.60-48.00) | <0.001 |
| NREM-AHI (times/h) | 61.00 (39.60-70.40) | 24.70 (9.80-55.00) | <0.001 |
| REM% | 12.66±6.04 | 14.37±5.98 | 0.146 |
| MSpO2 (%) | 93.00 (89.00-94.00) | 95.00 (93.00-96.00) | <0.001 |
| REM-MSpO2 (%) | 90.00 (83.00-93.00) | 94.00 (91.00-96.00) | <0.001 |
| NREM-MSpO2 (%) | 93.00 (89.00-94.00) | 94.00 (93.00-95.00) | <0.001 |
| LSaO2 (%) | 67.00 (57.00-75.00) | 80.00 (69.00-85.00) | <0.001 |
| T90% (%) | 22.44 (10.53-45.90) | 3.28 (0.47-15.01) | <0.001 |
| REM-T90% (%) | 37.52 (14.05-66.90) | 5.03 (0.10-30.39) | <0.001 |
| NREM-T90% (%) | 21.80 (9.17-45.23) | 2.63 (0.30-14.73) | <0.001 |
Note: Compared to the normal blood pressure group, significant difference as P<0.05. TST: total sleep time; MAI: Micro arousal index; AHI: apnea hypopnea index; REM-AHI: apnea hypopnea index during REM sleep; NREM-AHI: apnea hypopnea index during non REM sleep; REM%: percentage of total sleep time in REM sleep period; MSpO2: mean pulse oxygen saturation; REM-MSpO2: mean pulse oxygen saturation in REM sleep period; NREM-MSpO2: mean pulse oxygen saturation in non REM sleep period; LSaO2: lowest arterial oxygen saturation; T90%: percentage of total sleep time in non REM sleep period; REM-T90%: the percentage of total sleep time when the arterial oxygen saturation is less than 90% in REM sleep; NREM-T90%: the percentage of total sleep time when the arterial oxygen saturation is less than 90% in non REM sleep.
Study population
The 114 eligible individuals were divided into two sets at a ratio of 7:3, using computer-generated random numbers: 82 individuals were assigned to the training set and 32 to the validation set. The characteristics with clinical variables in both sets are shown in Table 3. The results showed that AHI, REM-AHI, NREM-AHI, LSaO2, neck circumference, waist circumference, MSpO2, REM-MSpO2, NREM-MSpO2, T90%, REM-T90%, NREM-T90% and LSaO2 in the training set were different from the validation set (P<0.05).
Table 3.
Characteristics of the training and validation sets
| Training set (n=82) | Validation set (n=32) | |||||
|---|---|---|---|---|---|---|
|
|
|
|||||
| Hypertension (n=49) | Normal Blood Pressure (n=33) | P | Hypertension (n=22) | Normal Blood Pressure (n=10) | P | |
| Age | 43.10±10.05 | 42.87±13.06 | 0.93 | 42.09±8.90 | 45.2±9.91 | 0.40 |
| Sex | 0.81 | 0.75 | ||||
| Female | 3 (6.1%) | 5 (15.2%) | 2 (9.1%) | 1 (10%) | ||
| Male | 46 (93.9%) | 27 (81.8%) | 20 (90.9%) | 9 (90%) | ||
| BMI | 28.14±3.31 | 26.38±3.98 | 0.03 | 28.61±2.56 | 26.02±3.11 | 0.23 |
| AHI | 56.61±21.17 | 31.89±23.74 | <0.001 | 59.71±18.42 | 29.41±21.85 | <0.001 |
| REM-AHI | 55.87±24.16 | 32.37±20.81 | <0.001 | 60.14±17.37 | 27.82±20.13 | <0.001 |
| NREM-AHI | 56.63±21.56 | 31.95±25.39 | <0.001 | 59.59±19.62 | 29.31±23.16 | <0.001 |
| LSaO2 | 66.67±14.17 | 76.68±12.47 | 0.001 | 62.41±13.76 | 78.5±10.46 | <0.001 |
| Neck circumference | 40.38±3.21 | 39.10±2.86 | 0.07 | 41.90±2.73 | 38.75±4.94 | <0.001 |
| Waist circumference | 100.66±7.78 | 94±9.79 | <0.001 | 102.71±7.65 | 95±9.15 | 0.03 |
| MSpO2 | 91.49±4.34 | 93.74±2.82 | 0.009 | 89.68±5.91 | 94.3±2.93 | 0.02 |
| REM-MSpO2 | 88.61±6.33 | 92.26±5.04 | 0.01 | 84.55±9.60 | 93.4±4.48 | 0.03 |
| NREM-MSpO2 | 91.22±4.47 | 93.48±2.69 | 0.008 | 89.77±5.69 | 94.4±2.65 | 0.01 |
| T90% | 27.64±22.7 | 11.98±16.52 | 0.001 | 34.09±27.06 | 10.64±21.57 | 0.02 |
| REM-T90% | 39.17±29.25 | 17.36±22.83 | <0.001 | 50.86±30.73 | 13.73±21.19 | <0.001 |
| NREM-T90% | 27.34±25.26 | 10.62±15.30 | 0.001 | 32.38±26.52 | 8.96±17.62 | 0.02 |
Note: Significant difference is P<0.05.
Univariate and multivariate analysis
Univariate and multivariate analysis confirmed predictive factors associated with OSAHS complicated by hypertension (Table 4). Independent predictive factors included: BMI (95% CI 1.75-2.05; P=0.005), REM-AHI (95% CI 1.29-4.30; P=0.005), REM-MSpO2 (95% CI 1.014-1.09; P=0.04) and T90% (95% CI 1.12-2.26; P=0.02).
Table 4.
Univariate and multivariate risk analysis
| Index | Univariate | Multivariate | ||
|---|---|---|---|---|
|
|
|
|||
| OR [95% CI] | P value | OR [95% CI] | P value | |
| Age | ||||
| 0-39 | Reference | |||
| 40-59 | 0.58 [0.5989-0.973] | 0.3306 | ||
| ≥60 | 1.11 [0.963-1.1532] | 0.3355 | ||
| Sex | ||||
| Female | Reference | |||
| Male | 0.46 [0.133-1.636] | 0.234 | ||
| BMI | ||||
| 18.5-23.9 | Reference | Reference | ||
| 24-27.9 | 1.82 [0.9206-1.982] | 0.047 | 1.24 [0.85-1.85] | 0.28 |
| ≥28 | 1.42 [0.9378-1.515] | 0.1297 | 2.97 [1.75-2.05] | 0.005 |
| AHI | ||||
| 5-14.9 | Reference | |||
| 15-29.9 | 1.23 [0.9378-1.515] | 0.079 | ||
| ≥30 | 1.42 [0.639-1.928] | 0.094 | ||
| REM-AHI | ||||
| 0-14.9 | Reference | Reference | ||
| 15-29.9 | 1.25 [1.1615-1.189] | 0.028 | 1.754 [1.241-2.479] | 0.001 |
| ≥30 | 1.36 [0.414-0.892] | 0.0086 | 2.36 [1.29-4.30] | 0.005 |
| NREM-AHI | ||||
| 0-14.9 | Reference | |||
| 15-29.9 | 1.57 [0.6388-0.6522] | 0.003 | ||
| ≥30 | 1.85 [0.6390-0.6522] | 0.002 | ||
| LSaO2 | ||||
| 20-49 | Reference | |||
| 50-69 | 1.84 [0.69-1.014] | 0.98 | ||
| ≥70 | 1.40 [0.678-1.012] | 0.89 | ||
| Neck circumference | ||||
| 30-39.9 | Reference | |||
| ≥40 | 1.08 [0.77-1.38] | 0.16 | ||
| Waist circumference | ||||
| 75-89 | Reference | Reference | ||
| 90-109.9 | 1.69 [1.04-1.81] | 0.11 | 1.24 [0.64-1.74] | 0.77 |
| ≥110 | 1.19 [1.47-1.88] | 0.42 | 1.19 [0.61-1.94] | 0.87 |
| MSpO2 | ||||
| 70-84 | Reference | |||
| 85-100 | 1.79 [0.639-0.652] | 0.132 | ||
| REM-MSpO2 | ||||
| 60-79 | Reference | Reference | ||
| 80-100 | 1.72 [0.907-1.013] | 0.98 | 1.15 [1.014-1.09] | 0.04 |
| NREM-MSpO2 | ||||
| 70-84 | Reference | |||
| 85-100 | 1.32 [0.638-0.652] | 0.99 | ||
| T90% | ||||
| 0-29.9 | Reference | Reference | ||
| 30-59.9 | 1.25 [1.822-1.96] | 0.49 | 1.38 [0.92-1.79] | 0.18 |
| ≥60 | 3.45 [0.237-0.656] | 0.96 | 1.59 [1.12-2.26] | 0.02 |
| REM-T90% | ||||
| 0-29.9 | Reference | |||
| 30-59.9 | 1.44 [0.486-0.914] | 0.626 | ||
| ≥60 | 1.318 [0.906-1.014] | 0.986 | ||
| NREM-T90% | ||||
| 0-29.9 | Reference | |||
| 30-59.9 | 1.43 [0.256-1.691] | 0.79 | ||
| ≥60 | 1.45 [0.638-0.652] | 0.99 | ||
Note: AHI: apnea hypopnea index; REM-AHI: apnea hypopnea index during REM sleep; NREM-AHI : apnea hypopnea index during non REM sleep; BMI: body mass index; ESS: Epworth Sleepiness Scale; MAI: Micro arousal index; TST: total sleep time; MSpO2: mean pulse oxygen saturation; REM-MSpO2: mean pulse oxygen saturation in REM sleep; NREM-MSpO2: mean pulse oxygen saturation in non REM sleep; LSaO2: lowest arterial oxygen saturation; T90%: percentage of total sleep time when arterial oxygen saturation is lower than 90%; REM-T90%: percentage of total sleep time when arterial oxygen saturation is lower than 90%; NREM-T90%: percentage of total sleep time when arterial oxygen saturation was less than 90% during non REM sleep.
Predictive factors selection
Based on characteristics of the participants, the LASSO method was used to identify the predictive factors (Figure 2A and 2B). Of the potential 15 factors, four were identified: BMI, REM-AHI, REM-MSpO2 and T90%.
Figure 2.

The LASSO binary logistic regression model. A: Optimal parameter (lambda) selection in the LASSO model used fivefold cross-validation by minimum criteria. The partial likelihood deviance (binomial deviance) curve was plotted versus log (lambda). Dotted vertical lines were drawn at the optimal values by using the minimum criteria and the 1 SE of the minimum criteria (the 1-SE criteria). B: LASSO coefficient profiles of the 15 factors. A coefficient profile plot was produced against the log (lambda) sequence. A vertical line was drawn at the value selected using fivefold cross-validation, where optimal lambda resulted in four features with nonzero coefficients. Abbreviations: LASSO, least absolute shrinkage and selection operator; SE, standard error.
Construction of the nomogram
Four independent risk factors (BMI, REM-AHI, REM-MSpO2 and T90%) in the training set were finally recruited into the nomogram model to predict the risk of OSAHS complicated by hypertension (Figure 3). The nomogram showed that REM-AHI and REM-MSpO2 contributed most to risk of hypertension in OSAHS. The contribution of T90% was small compared to REM-MSpO2 or REM-AHI. Each variable was assigned a score and a total score obtained from the sum of each variable. Moreover, total points of the nomogram model ranged from 50 to 260, and the predictive risk rate ranged from 0.1 to 0.8. The higher total points, the greater the risk.
Figure 3.
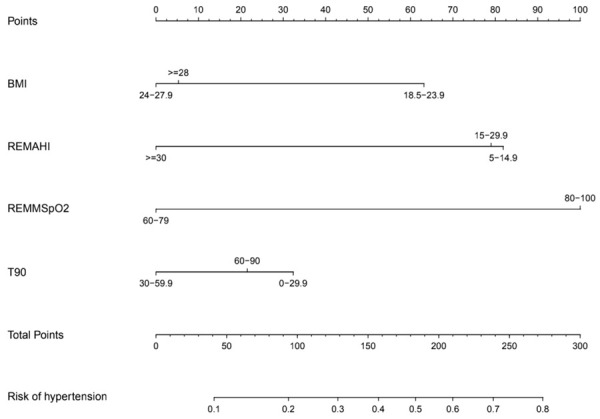
Nomogram for predicting OSAHS patients who will have the complication of hypertension. The nomogram included four risk factors: BMI (kg/m2), REMAHI (times/h), REM-MSpO2 (%) and T90 (%). OSAHS, obstructive sleep apnea hypopnea syndrome; BMI, body mass index; REMAHI, apnea hypopnea index during REM sleep; REM-MSpO2: mean pulse oxygen saturation in REM sleep period; T90: percentage of total sleep time in non-REM sleep period.
Validation of the nomogram
The calibration plot of the training and validation set are shown in Figure 4. The unadjusted concordance index (C-index) for the training and validation set were 0.897 [95% confidence interval (CI), 0.795-0.912] and 0.894 [95% confidence interval (CI), 0.788-0.820], respectively. The AUCs for the training and validation set was 0.8175882 and 0.8031522, respectively (Figure 5). This indicated that the nomogram could accurately predict the risk of hypertension in consecutive patients with OSAHS.
Figure 4.
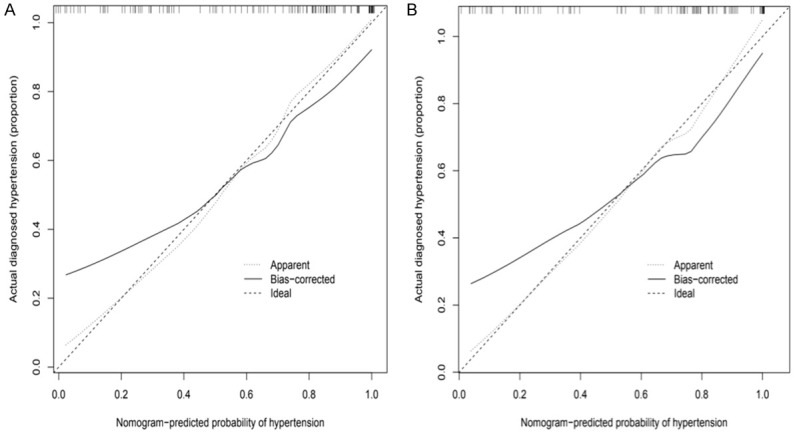
The calibration curves for predictions of hypertension in OSAHS consecutive patients in the training set (A) and validation set (B). The dashed line indicated ideal predictions, the solid line represents actual predictions of nomogram. The closer the distance of two lines, the better the performance of the predictive model. OSAHS: obstructive sleep apnea hypopnea syndrome.
Figure 5.
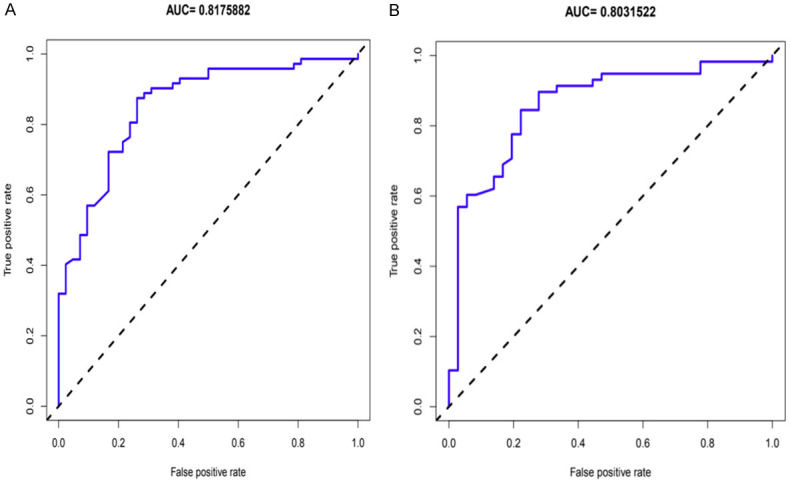
ROC curves of hypertension in OSAHS consecutive patients’ nomogram in the training set (A) and validation set (B). The AUCs for the hypertension in OSAHS consecutive patients in the training and validation sets exceed 0.8, which demonstrated that the nomogram could accurately predict the risk of hypertension in consecutive patients with OSAHS. OSAHS: obstructive sleep apnea hypopnea syndrome; ROC: receiver operating characteristic curves; AUC: area under the ROC curve.
Clinical use
Decision curve analysis (DCA) of the model demonstrated that if the threshold probability of hypertension in OSAHS consecutive patients was 20 to 80% (Figure 6), the validity of the model to predict hypertension in consecutive OSAHS was increased. This predictive model was suitable for clinical use.
Figure 6.
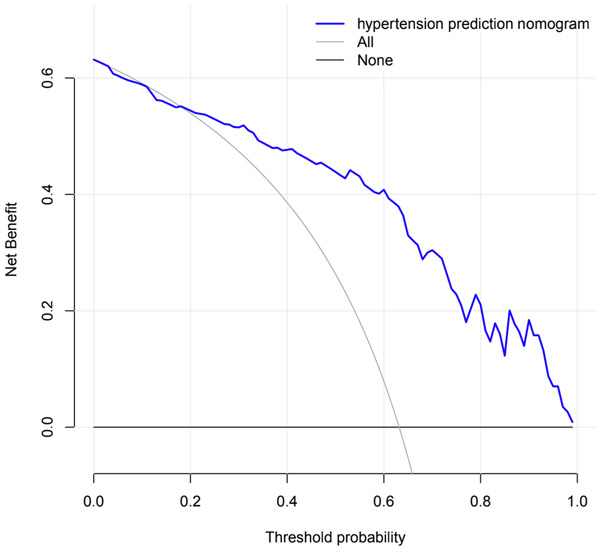
Decision curve analysis for the nomogram. The black line represents the net benefit at the time when no OSAHS patients have hypertension, while the gray line represents the net benefit at the time when all OSAHS patients have hypertension; the purple line represents a model curve. The area under the three lines demonstrates the clinical usefulness of the nomogram. OSAHS: obstructive sleep apnea hypopnea syndrome.
ROC analysis of risk factors to predict hypertension in consecutive OSAHS patients
The AUC for REM-AHI, BMI, REM-MSpO2, and T90% are shown in Figure 7. The cut-off values for the same variables are shown in Table 5. The results showed that the cut-off of REM-AHI, BMI, REM-MSpO2, and T90% were 47.45 times/h, 25.59 kg/m2, 92.50 and 13.08, respectively.
Figure 7.
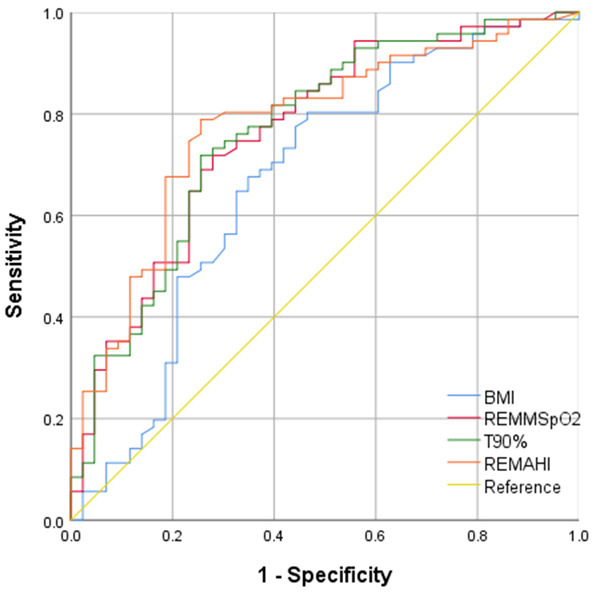
The ROC curves of risk factors for predicting hypertension in OSAHS consecutive patients. The AUC for REM-AHI, BMI, REM-MSpO2, and T90%, were 0.778 (95% CI, 0.690-0.866), 0.671 (95% CI, 0.563-0.779), 0.750 (95% CI, 0.657-0.843), and 0.765 (95% CI, 0.673-0.857), respectively.
Table 5.
Optimal cutoff values of risk factors for predicting hypertension in OSAHS consecutive patients
| Variable | Youden Index | Cutoff value | Sensitivity (%) | Specificity (%) |
|---|---|---|---|---|
| REM-AHI | 0.533 | 47.45 | 78.9 | 74.4 |
| BMI | 0.338 | 25.59 | 80.3 | 53.5 |
| REM-MSpO2 | 0.388 | 92.50 | 69.8 | 69.0 |
| T90% | 0.462 | 13.08 | 71.8 | 74.4 |
Discussion
We constructed a predictive nomogram model to predict the risk of hypertension in a population of consecutive patients with OSAHS. We applied the clinical characteristics of the population to generalize and screen predictive factors. BMI, REM-AHI, REM-MSpO2 and T90% were identified as independent risk factors for hypertension using the LASSO method. Calibration plot of the training and validation set revealed that this nomogram model had good accuracy and clinical applicability, with a high C-index and AUC for the training and validation set. The DCA demonstrated clinical usefulness of this nomogram for predicting hypertension in an OSAHS population. In addition, this model would enable early recognition of a high risk population. To the best of our knowledge, this is the first study to develop a predictive model for hypertension in an OSAHS population using common demographic and clinical PSG values.
Current studies indicate that OSA and hypertension are comorbid [8,23-25]. A prospective study of the Wisconsin Sleep cohort [26] that used a population without respiratory events as the control group revealed that after adjusting for baseline hypertension status, BMI, neck circumference, waist circumference, age, gender, smoking history, drinking history and other confounding factors, the OR for hypertension in patients with AHI 0-5 times/h, 5-15 times/h and >15 times/h was: 1.42 (95% CI, 1.13-1.78), 2.03 (95% CI, 1.29-3.17) and 2.89 (95% CI, 1.46-5.64) respectively. Another study of 2677 patients with suspected OSAHS [27] found that the risk of hypertension increased by about 1% with an increase of one respiratory event per hour during sleep; and by about 13% with a 10% decrease in nocturnal mean oxygen saturation. The results of our study were consistent with the results of these two studies although both used blood pressure recorded in the clinic to diagnose hypertension. In this study, ABPM was used to diagnose hypertension, avoiding a missed diagnosis of occult hypertension, reducing the chance of a misdiagnosis of white coat hypertension, and increasing the chance of correctly diagnosing hypertension. In addition, patients in this study were not prescribed antihypertensive drugs, avoiding the influence of such therapy and of circadian rhythm.
Our study showed that BMI, REM-AHI, REM-MSpO2 and T90% were risk factors for hypertension in an OSAHS population. The risk of hypertension increased by 17.54% at 15 breathing events per hour during REM sleep. Previous studies [28,29] showed that compared to waking periods and NREM sleep, REM sleep significantly inhibited the cholinergic effect of the hypoglossal nerve, resulting in significantly decreased genioglossus muscle tension, weakened upper airway expansion ability, increased susceptibility to upper airway collapse, more frequent respiratory events, longer duration, and lower blood oxygen saturation. The Wisconsin Sleep Cohort [30] found that REM-AHI was independently associated with the prevalence of hypertension in a cross-sectional study. The group with REM-AHI <1 time/h served as the control group, and the OR of hypertension in the group with REM-AHI ≥15 times/h was 1.26 (95% CI, 1.01-1.57). These two studies are consistent with the results of our study and emphasize the correlation between REM-AHI and hypertension in OSAHS patients. Nonetheless the pathogenesis of REM-AHI and REM-MSpO2 that underlies OSA-related hypertension is poorly understood. We deduced that when OSAHS occurs in the REM phase, the REM-related baroreflex system is damaged and enhances sympathetic activity of the cardiovascular system. Muscle tone is decreased during the REM phase when individuals are at a stage of intermittent hypoxia and this further increases activity of the sympathetic nervous system. As a result, cardiac output is increased, vascular smooth muscle contracts, and peripheral vascular resistance and blood pressure increase. In addition, the main manifestation of OSAHS is intermittent hypoxia. The intermittent hypoxia can lead to oxidative stress, vascular endothelial injury, sympathetic excitation and the activation of renin angiotensin aldosterone system, which can promote the development of hypertension.
To the best of our knowledge, this is the first clinical nomogram model to include risk factors (BMI, REM-AHI, REM-MSpO2 and T90%). Compared to traditional subjective questionnaires and blood pressure measurement, this model has a better and more precise application. We estimated the optimal cut-off values for risk factors that could predict the incidence of hypertension in an OSAHS population and may provide the best thresholds of BMI, REM-AHI, REM-MSpO2, and T90%. More importantly, the DCA revealed that if the threshold probability of hypertension in OSAHS consecutive patients was 20 to 80%, the model could more accurately predict hypertension. In addition, it could facilitate early clinical identification of OSAHS patients at high risk of hypertension.
Inevitably, there are some weaknesses in our study. First, our study was a cross-sectional study. We determined only the prevalence of hypertension in an OSAHS population, not the incidence rate. Second, we could not avoid the influence of selection bias since the study included only patients who agreed to complete ABPM. Third, this research was a single center and small study. A larger, multi-center study is required to verify its applicability.
Conclusion
This research created a predictive nomogram model with good accuracy and clinical applicability. This may help to determine the risk of hypertension in patients with OSAHS. In addition, we determined that BMI, REM-AHI, REM-MSpO2, and T90% were independent risk predictors.
Acknowledgements
The study was supported by grants from Guangdong Medical Science and Techology Research Fund Project (nos. B2019103). National Key Research and Development Program of China (Grant No. 2018YFC1313600 & 2016YFC0901102), Program Natural science foundation of Guangdong province, China (Grant No. 2019A1515010981).
Disclosure of conflict of interest
None.
Abbreviations
- OSAHS
Obstructive Sleep Apnea Hypopnea Syndrome
- C-index
concordance index
- PSG
polysomnography
- AHI
apnea-hypopnea index
- EEG
electroencephalogram
- EOG
electrooculogram
- EMG
electromyography
- INH
Isolated nocturnal hypertension
- NINH
Non-isolated nocturnal hypertension
- AUC
area under the curve
- DCA
Decision curve analysis
References
- 1.Pedrosa RP, Maki-Nunes C, Midlej-Brito T, Lopes HF, Freitas LS, Trombetta IC, Toschi-Dias E, Alves MJNN, Fraga RF, Rondon MU, Negrão CE, Bortolotto LA, Lorenzi-Filho G, Drager LF. Predictors of obstructive sleep apnea in consecutive patients with metabolic syndrome. Metab Syndr Relat Disord. 2018;16:2–5. doi: 10.1089/met.2017.0112. [DOI] [PubMed] [Google Scholar]
- 2.Benjafield AV, Ayas NT, Eastwood PR, Heinzer R, Ip MSM, Morrell MJ, Nunez CM, Patel SR, Penzel T, Pépin JL, Peppard PE, Sinha S, Tufik S, Valentine K, Malhotra A. Estimation of the global prevalence and burden of obstructive sleep apnoea: a literature-based analysis. Lancet Respir Med. 2019;7:687–698. doi: 10.1016/S2213-2600(19)30198-5. [DOI] [PMC free article] [PubMed] [Google Scholar]
- 3.Hou H, Zhao Y, Yu W, Dong H, Xue X, Ding J, Xing W, Wang W. Association of obstructive sleep apnea with hypertension: a systematic review and meta-analysis. J Glob Health. 2018;8:10405. doi: 10.7189/jogh.08.010405. [DOI] [PMC free article] [PubMed] [Google Scholar]
- 4.Dong JY, Zhang YH, Qin LQ. Obstructive sleep apnea and cardiovascular risk: meta-analysis of prospective cohort studies. Atherosclerosis. 2013;229:489–495. doi: 10.1016/j.atherosclerosis.2013.04.026. [DOI] [PubMed] [Google Scholar]
- 5.Zhao E, Chen S, Du Y, Zhang Y. Association between sleep apnea hypopnea syndrome and the risk of atrial fibrillation: a meta-analysis of cohort study. Biomed Res Int. 2018;2018:5215868. doi: 10.1155/2018/5215868. [DOI] [PMC free article] [PubMed] [Google Scholar]
- 6.Javaheri S, Barbe F, Campos-Rodriguez F, Dempsey JA, Khayat R, Javaheri S, Malhotra A, Martinez-Garcia MA, Mehra R, Pack AI, Polotsky VY, Redline S, Somers VK. Sleep apnea: types, mechanisms, and clinical cardiovascular consequences. J Am Coll Cardiol. 2017;69:841–858. doi: 10.1016/j.jacc.2016.11.069. [DOI] [PMC free article] [PubMed] [Google Scholar]
- 7.Muraki I, Wada H, Tanigawa T. Sleep apnea and type 2 diabetes. J Diabetes Investig. 2018;9:991–997. doi: 10.1111/jdi.12823. [DOI] [PMC free article] [PubMed] [Google Scholar]
- 8.Natsios G, Pastaka C, Vavougios G, Zarogiannis SG, Tsolaki V, Dimoulis A, Seitanidis G, Gourgoulianis KI. Age, body mass index, and daytime and nocturnal hypoxia as predictors of hypertension in patients with obstructive sleep apnea. J Clin Hypertens (Greenwich) 2016;18:146–52. doi: 10.1111/jch.12645. [DOI] [PMC free article] [PubMed] [Google Scholar]
- 9.Pan M, Ou Q, Chen B, Hong Z, Liu H. Risk factors for obstructive sleep apnea-related hypertension in police officers in Southern China. J Thorac Dis. 2019;11:4169–4178. doi: 10.21037/jtd.2019.09.83. [DOI] [PMC free article] [PubMed] [Google Scholar]
- 10.Torres G, Sánchez-de-la-Torre M, Barbé F. Relationship between OSA and hypertension. Chest. 2015;148:824–832. doi: 10.1378/chest.15-0136. [DOI] [PubMed] [Google Scholar]
- 11.Ren R, Covassin N, Yang L, Li Y, Zhang Y, Zhou J, Tan L, Li T, Li X, Wang Y, Zhang J, Wing YK, Li W, Somers VK, Tang X. Objective but not subjective short sleep duration is associated with hypertension in obstructive sleep apnea. Hypertension. 2018;72:610–617. doi: 10.1161/HYPERTENSIONAHA.118.11027. [DOI] [PMC free article] [PubMed] [Google Scholar]
- 12.Budhiraja R, Javaheri S, Parthasarathy S, Berry RB, Quan SF. The association between obstructive sleep apnea characterized by a minimum 3 percent oxygen desaturation or arousal hypopnea definition and hypertension. J Clin Sleep Med. 2019;15:1261–1270. doi: 10.5664/jcsm.7916. [DOI] [PMC free article] [PubMed] [Google Scholar]
- 13.Schwarz EI. Cardiovascular consequences of obstructive sleep apnea in different study models and novel perspectives. Curr Opin Pulm Med. 2019;25:614–622. doi: 10.1097/MCP.0000000000000618. [DOI] [PubMed] [Google Scholar]
- 14.Garvey JF, Taylor CT, McNicholas WT. Cardiovascular disease in obstructive sleep apnoea syndrome: the role of intermittent hypoxia and inflammation. Eur Respir J. 2009;33:1195–205. doi: 10.1183/09031936.00111208. [DOI] [PubMed] [Google Scholar]
- 15.Xue M, Liu L, Wang S, Su Y, Lv K, Zhang M, Yao H. A simple nomogram score for screening patients with type 2 diabetes to detect those with hypertension: a cross-sectional study based on a large community survey in China. PLoS One. 2020;15:e0236957. doi: 10.1371/journal.pone.0236957. [DOI] [PMC free article] [PubMed] [Google Scholar]
- 16.Zhang J, Yang Y, Fu X, Guo W. Development and validation of nomograms for prediction of overall survival and cancer-specific survival of patients of colorectal cancer. Jpn J Clin Oncol. 2020;50:261–269. doi: 10.1093/jjco/hyz182. [DOI] [PubMed] [Google Scholar]
- 17.Wang W, Cai D. Complement components sC5b-9 and CH50 predict prognosis in heart failure patients combined with hypertension. Am J Hypertens. 2020;33:53–60. doi: 10.1093/ajh/hpz140. [DOI] [PubMed] [Google Scholar]
- 18.Xu H, Zhao X, Shi Y, Li X, Qian Y, Zou J, Yi H, Huang H, Guan J, Yin S. Development and validation of a simple-to-use clinical nomogram for predicting obstructive sleep apnea. BMC Pulm Med. 2019;19:18. doi: 10.1186/s12890-019-0782-1. [DOI] [PMC free article] [PubMed] [Google Scholar]
- 19.Berry RB, Budhiraja R, Gottlieb DJ, Gozal D, Iber C, Kapur VK, Marcus CL, Mehra R, Parthasarathy S, Quan SF, Redline S, Strohl KP, Davidson Ward SL, Tangredi MM American Academy of Sleep Medicine. Rules for scoring respiratory events in sleep: update of the 2007 AASM manual for the scoring of sleep and associated events. J Clin Sleep Med. 2012;8:597–619. doi: 10.5664/jcsm.2172. [DOI] [PMC free article] [PubMed] [Google Scholar]
- 20.Gabb GM, Mangoni AA, Anderson CS, Cowley D, Dowden JS, Golledge J, Hankey GJ, Howes FS, Leckie L, Perkovic V, Schlaich M, Zwar NA, Medley TL, Arnolda L. Guideline for the diagnosis and management of hypertension in adults-2016. Med J Aust. 2016;205:85–9. doi: 10.5694/mja16.00526. [DOI] [PubMed] [Google Scholar]
- 21.Balachandran VP, Gonen M, Smith JJ, DeMatteo RP. Nomograms in oncology: more than meets the eye. Lancet Oncol. 2015;16:e173–80. doi: 10.1016/S1470-2045(14)71116-7. [DOI] [PMC free article] [PubMed] [Google Scholar]
- 22.Pencina MJ, D’Agostino RB. Overall C as a measure of discrimination in survival analysis: model specific population value and confidence interval estimation. Stat Med. 2004;23:2109–23. doi: 10.1002/sim.1802. [DOI] [PubMed] [Google Scholar]
- 23.Appleton SL, Vakulin A, Martin SA, Lang CJ, Wittert GA, Taylor AW, McEvoy RD, Antic NA, Catcheside PG, Adams RJ. Hypertension is associated with undiagnosed OSA during rapid eye movement sleep. Chest. 2016;150:495–505. doi: 10.1016/j.chest.2016.03.010. [DOI] [PubMed] [Google Scholar]
- 24.Torres G, Sánchez-de-la-Torre M, Barbé F. Relationship between OSA and hypertension. Chest. 2015;148:824–832. doi: 10.1378/chest.15-0136. [DOI] [PubMed] [Google Scholar]
- 25.Pedrosa RP, Barros IML, Drager LF, Bittencourt MS, Medeiros AKL, Carvalho LL, Lustosa TC, Carvalho MMB, Ferreira MNL, Lorenzi-Filho G, Costa LOBF. OSA is common and independently associated with hypertension and increased arterial stiffness in consecutive perimenopausal women. Chest. 2014;146:66–72. doi: 10.1378/chest.14-0097. [DOI] [PubMed] [Google Scholar]
- 26.Thomas SJ, Booth JN 3rd, Jaeger BC, Hubbard D, Sakhuja S, Abdalla M, Lloyd-Jones DM, Buysse DJ, Lewis CE, Shikany JM, Schwartz JE, Shimbo D, Calhoun D, Muntner P, Carnethon MR. Association of sleep characteristics with nocturnal hypertension and nondipping blood pressure in the CARDIA study. J Am Heart Assoc. 2020;9:e015062. doi: 10.1161/JAHA.119.015062. [DOI] [PMC free article] [PubMed] [Google Scholar]
- 27.Bouloukaki I, Grote L, McNicholas WT, Hedner J, Verbraecken J, Parati G, Lombardi C, Basoglu OK, Pataka A, Marrone O, Steiropoulos P, Bonsignore MR, Schiza SE European Sleep Apnoea Database Network. Mild obstructive sleep apnea increases hypertension risk, challenging traditional severity classification. J Clin Sleep Med. 2020;16:889–898. doi: 10.5664/jcsm.8354. [DOI] [PMC free article] [PubMed] [Google Scholar]
- 28.Carrera-Cañas C, Garzón M, de Andrés I. The transition between slow-wave sleep and REM sleep constitutes an independent sleep stage organized by cholinergic mechanisms in the rostrodorsal pontine tegmentum. Front Neurosci. 2019;13:748. doi: 10.3389/fnins.2019.00748. [DOI] [PMC free article] [PubMed] [Google Scholar]
- 29.Yamada RG, Ueda HR. Molecular Mechanisms of REM Sleep. Front Neurosci. 2019;13:1402. doi: 10.3389/fnins.2019.01402. [DOI] [PMC free article] [PubMed] [Google Scholar]
- 30.Abboud F, Kumar R. Obstructive sleep apnea and insight into mechanisms of sympathetic overactivity. J Clin Invest. 2014;124:1454–7. doi: 10.1172/JCI70420. [DOI] [PMC free article] [PubMed] [Google Scholar]