Abstract
Objective: Multiple sclerosis (MS) is an autoimmune neuroinflammatory disease of the nervous system. However, the precise molecular mechanisms underlying MS have yet to be fully elucidated. In this study, our aim was to provide novel insight into the pathogenesis of MS and provide a resource for identifying new biomarkers and therapeutics for MS. Methods: In this study, we analyzed the gene expression profiles (GSE21942) and miRNA expression profiles (GSE61741) of MS patient samples that were downloaded from the GEO database and identified differentially expressed mRNAs and miRNAs (DEmRNAs, DEmiRNAs). Next, we constructed a protein-protein interaction (PPI) network and a MS-specific ceRNA network (MCEN) by integrating expression profiles, interaction pairs of mRNA-miRNAs and lncRNA-miRNAs. Then, according to the modular structure of the PPI network, we identified hub DEmRNAs and generated a ceRNA subnetwork so that we could analyze the key lncRNAs that were associated with MS. Results: We first identified 4 modules by constructing a PPI network using DEmRNAs. Functional enrichment analysis showed these modules were enriched in immune-related pathways. Then, we constructed the MCEN and the hub gene-associated ceRNA subnetwork using a comprehensive computational approach. We identified three key lncRNAs (LINC00649, TP73-AS1 and MALAT1) and further identified key lncRNA-mediated ceRNAs within the subnetwork. Finally, by analyzing LINC00649-miR-1275-CD20, we identified 6 drugs that may represent novel drugs for MS. Conclusion: Collectively, our results provide novel insight for the discovery of biomarkers and therapeutics for MS and provide a suitable foundation from which to design future investigations of the pathogenic mechanisms associated with MS.
Keywords: Multiple sclerosis, ceRNA, lncRNA, ceRNA network, biomarker
Introduction
Multiple sclerosis (MS) is a neuroinflammatory autoimmune disease that is characterized by white matter demyelination of the central nervous system (CNS), predominantly driven by myelin-specific immune T cells [1]. The main clinical features of this disease include the distribution of multiple lesions within the white matter and characteristic episodes of relapse and remission throughout the course of disease [2]. The mean global prevalence of MS is 33 per 100,000 individuals, with a higher prevalence in North America and Europe (140 and 108 per 100,000 individuals) than in Asian and sub-Saharan African countries (2.2 and 2.1 per 100,000 individuals, respectively) [3]. Statistics show that the global incidence of MS is increasing on an annual basis [4].
The underlying cause of MS has yet to be elucidated, although it is generally accepted that an interplay of both genetic and environmental factors may affect an individual’s disease predisposition for MS. Within the genetically susceptible population, the occurrence of disease is primarily determined by major histocompatibility complex, while modifiable environmental factors, for example, smoking, Epstein-Barr virus infection, increased body mass index (BMI) during adolescence, and low level of vitamin D, may affect whether an individual will develop MS [5]. The first genetic risk factor was discovered decades ago at the human leukocyte antigen (HLA) locus which is known to encode molecules that are involved in vital immune functions [6]. Notably, it has been suggested that certain environmental factors, such as smoking, can amplify pathogenic gene expression patterns in the CNS or immune cells via epigenetic mechanisms, thus synergizing with risk loci for MS [7].
Over recent years, a number of studies have supported the important role of non-coding RNAs, such as miRNAs and lncRNAs, in terms of the differentiation, dysfunction, and disproportionality of immune cells, as well as in their autoimmune and inflammatory response [8,9], thus suggesting that these molecules may play key roles in MS. Moreover, lncRNAs are known to function as miRNA ‘sponges’ to compete with mRNAs and thereby regulate their activity [10]. A growing body of evidence now supports the fact that lncRNAs function as ceRNAs to regulate the expression levels of mRNAs, thereby participating in the progression of numerous diseases [11]. For example, lncRNA Gm15575 and PVT1 were shown to be aberrantly expressed in MS patients; furthermore, lncRNA Gm15575 and PVT1 have been shown to affect the functionality of Th17 in MS via ceRNA patterns [12,13]. This indicates that lncRNA-ceRNA networks exert influence on the immune response in MS. A subsequent study also supported this notion by demonstrating that TUG1/miR-9-5p/NFKB1 (p50) ceRNET helped to regulate the immune response in MS [14]. The lncRNA taurine upregulation gene 1 (TUG1) was also shown to be up-regulated in serum samples taken from patients with MS [9]. Another study showed that NFKB1 was regulated by miR-9-5p by a sponging mechanism [14]. Studies have also shown that the down-regulation of TUG1 reduced the level of pro-inflammatory cytokines in vivo and increased the level of the anti-inflammatory cytokine IL-10 in EAE mice. Disturbances in the regulatory mechanisms associated with ceRNAs are known to cause immunological disorders and other diseases. It is evident that ceRNA networks are multifactorial and may represent a useful resource for identifying new biomarkers and therapeutic agents for different diseases.
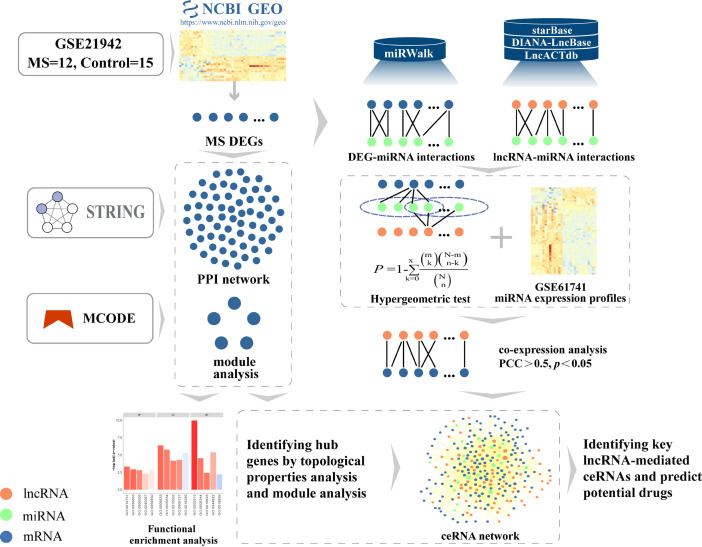
In this study, we analyzed gene expression profiles and miRNA expression profiles acquired from two GEO datasets featuring patients with MS. This allowed us to determine differentially expressed mRNAs and miRNAs (DEmRNAs and DEmiRNAs, respectively). Next, we used bioinformatics to analyze gene functionality, pathway enrichment, PPI network, and network modular structure, to identify hub genes related to the immunological and inflammatory status of patients with MS. Next, we used a multi-step computational approach that was based on mRNA-miRNA and miRNA-lncRNA interactions and the ‘ceRNA hypothesis’ to construct an MS-specific lncRNA-mediated ceRNA network (MCEN). Next, according to the modularization and topological properties of the PPI network, we constructed a ceRNA subnetwork. Then, we analyzed hub lncRNAs-mediated ceRNAs and identified potential therapeutic drugs that could be used to treat MS. Finally, we dissected the action of these hub lncRNA-mediated ceRNAs in the pathogenesis of MS (refer to the flowchart shown in Figure 1). Our aim was to provide new insight into the pathogenesis of MS and provide a resource for identifying new biomarkers and therapeutics for MS.
Figure 1.
The workflow of this study showing steps containing the construction of PPI and ceRNA networks and identification of hub lncRNAs and potential drugs.
Materials and methods
Data acquisition
Gene expression (GSE21942) and miRNA expression (GSE61741) datasets were downloaded from the Gene Expression Omnibus (GEO, https://www.ncbi.nlm.nih.gov/geo/) database. GSE21942 featured data acquired from the peripheral blood mononuclear cells (PBMCs) of 12 MS patients and 15 controls (platform: GPL570 Affymetrix Human Genome U133 Plus 2.0 Array) while the GSE61741 dataset featured data acquired from the PBMCs of 23 MS patients and 94 controls (platform: GPL9040 Homo sapiens miRBase 13.0). Then, we identified mRNA-miRNA interaction pairs using the miRwalk database (version 2.0; zmf.umm. uni-heidelberg.de/apps/zmf/mirwalk2) [15]; this software predicts miRNAs that are likely to interact with differentially expressed genes. mRNA-miRNA interactions were then filtered by DEmiRNAs for MS. Finally, lncRNA-miRNA interactions were extracted from starBase [16], DIANA-LncBase [17], and LncACTdb [18]; these databases all feature miRNA-lncRNA interactions that have been validated experimentally.
Data processing and the analysis of differential expression
GEO2R (http://www.ncbi.nlm.nih.gov/geo/geo2r/) online software was used to analyze the raw submitter-supplied data from microarrays and subsequently identify DEmRNAs and DEmiRNAs in MS. GEO2R is an interactive web tool that allows users to compare different groups of samples across experimental environments in a GEO series to identify genes that are differentially expressed. We used P-value <0.05 and |lgFC| >1.2 as the cut-off criteria to identify DEmRNAs and DEmiRNAs.
Functional enrichment analyses
The DAVID Database (https://david.ncifcrf.gov/) was used to perform functional and pathway enrichment analysis. The DAVID resource provides systematic and integrated functional annotation tools for researchers to determine the biological significance of different genes [19]. We used DAVID to analyze the DEmRNAs we identified in MS patients and performed specific analyses for gene ontology (GO), including biological process (BP), cellular component (CC), and molecular function (MF) [20]. We also performed Kyoto Encyclopedia of Genes and Genomes (KEGG) pathway enrichment analysis [21]. P-value <0.05 was considered to be statistically significant.
Protein-protein interaction (PPI) network construction and module analysis
Functional PPI analysis is essential if we are to interpret the molecular mechanisms of key cellular activities. In this study, we used the Search Tool for the Retrieval of Interacting Genes (STRING; http://string.embl.de/) database [22] and Cytoscape v3.8.1 (http://www.cytoscape.org/) software to construct a PPI network featuring the DEmRNAs we identified in patients with MS. An interaction score of 0.4 was regarded as the cut-off criterion and a PPI was generated. Cytoscape software was used to analyze a range of topological features for the nodes in the PPI network; this allowed us to identify hub genes, including degree and betweenness centrality. Then, we used the Molecular Complex Detection (MCODE; version 1.4.2; http://apps.cytoscape.org/apps/mcode) tool in Cytoscape software to select highly interconnected modules from the PPI network using specific selection criteria (MCODE degree cutoff =2; node score cutoff =0.2; k-core =2; max. depth =100).
Hypergeometric test
Next, we identified competing mRNA-lncRNA interaction pairs that shared the same miRNA. To do this, we used hypergeometric tests to identify competing pairs based on the common miRNAs of any pair of mRNAs and lncRNAs [23]; P values were computed using the formula given in Equation (1).
 |
For each interaction pair, N denotes the total number of miRNAs in the interaction data, n and m denote the number of miRNAs that were associated with one mRNA and one lncRNA, and x represents the number of miRNAs shared with the mRNA and lncRNA. mRNA-lncRNA competitive interaction pairs with P-value <0.05 were considered to represent potential ceRNA pairs.
Co-expression correlation analysis for ceRNA interactions
Next, to identify lncRNA-mRNA interaction pairs, we applied co-expression correlation analysis to the lncRNA-mRNAs by using Pearson correlation coefficients (PCC) and by considering the expression of potential ceRNA interactions. PCC were calculated using the formula given in Equation (2).
 |
In Equation (2), cov (X, Y) referred to the covariance of variables X and Y. σ X and σ Y represented standard deviations for X and Y. As a result, the final co-expressed lncRNA-mRNA pairs that met the hypergeometric test threshold (P-value <0.05) and crossed the PCC threshold (PCC >0.5 and P-value <0.05) were considered to be statistically significant pairs.
Construction of a ceRNA network
Next, we constructed a lncRNA-mediated ceRNA network based on the ceRNA interactions that were identified by the two-step method described above and identified 773 lncRNA-mediated ceRNA pairs. These were subsequently used to establish a MS-specific ceRNA network (MCEN) that was visualized Cytoscape software. Using the Cytoscape Network Analyzer tool, we analyzed a range of topological features with regards to the nodes of the MCEN, including degree and betweenness distribution analysis.
Identifying ceRNA subnetworks and potential drugs in MS
The hub immune-related DEmRNAs in MS patients that were identified by PPI network and module analysis were subsequently overlapped within an overall ceRNA network. The ceRNA subnetwork that included hub immune-related DEmRNAs was then systematically extracted to define a potential MS immune-relevant ceRNA subnetwork. Then, drugs and target genes were downloaded from DrugBank [24] (https://www.drugbank.ca/).
Results
Identification of DEmRNAs and DEmiRNAs in MS
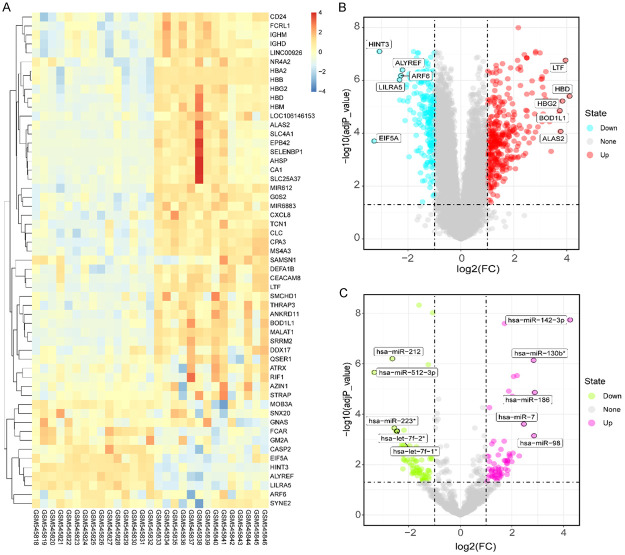
Each set of array data was analyzed separately by the GEO2R system to identify DEmRNAs or DEmiRNAs (Supplementary Tables 1, 2). We successfully identified 290 DEmRNAs from the GSE21942 dataset; of these, 190 DEmRNAs were up-regulated and 100 DEmRNAs were down-regulated. We also identified 119 DEmiRNAs from the GSE61741 dataset; of these, 57 DEmiRNAs were up-regulated and 62 DEmiRNAs were down-regulated. DEmRNAs and DEmiRNAs were identified by applying specific criteria: a |lgFC| >1.2 and P<0.05. A heatmap was then generated to depict the expression tendencies of these DEmRNAs between MS and healthy controls (Figure 2A). In addition, volcano plots were generated to demonstrate the distribution of DEmRNAs and DEmiRNAs (Figure 2B).
Figure 2.
Analysis of DEmRNAs and DEmiRNAs. (A) Hierarchical heatmap for the top 55 differentially expressed mRNAs in multiple sclerosis. Volcano plots of mRNAs (B), miRNAs (C) with |lgFC| >2 (adjust P value <0.05).
Functional enrichment analysis of DEmRNAs
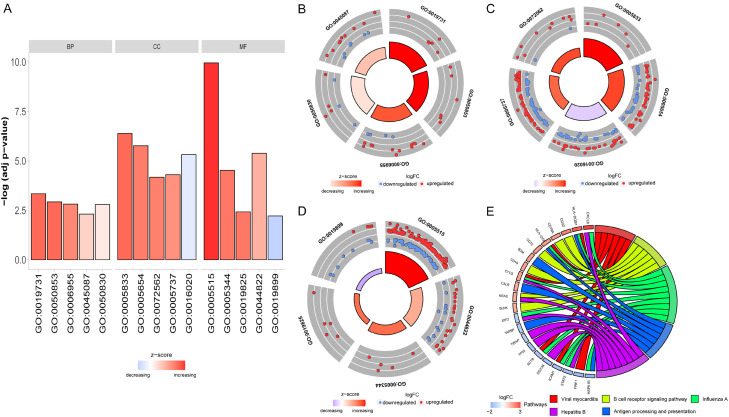
To identify the potential biological functions of the DEmRNAs, we performed GO functional enrichment analysis for BP, CC, and MF. We also used the DAVID database to perform KEGG analysis on the DEmRNAs [25]. The top five significant terms for GO functional enrichment (BP, CC and MF) and KEGG pathways (P<0.05) that might play pivotal roles in the immunological mechanisms associated with MS were shown in (Figure 3; Supplementary Table 3). GO analysis showed that the DEmRNAs were mainly enriched in biological processes associated with antibacterial humoral responses, the B cell receptor signaling pathway, and immune responses. KEGG analysis showed that the DEmRNAs were mainly enriched in viral myocarditis, the B cell receptor signaling pathway and influenza A. We demonstrated that the majority of GO terms were involved in immune response and many pathways, including the B cell receptor signaling pathway and influenza A, have been reported to be relevant with MS.
Figure 3.
GO functional and KEGG pathway analysis of DEmRNAs. (A) Bar graph of BP, CC, MF and KEGG payhway. Distribution of DEmRNAs in each GO term of BP (B), CC (C) and MF (D). Red denotes upregulated expression genes; Blue denotes downregulated expression genes. (E) KEGG pathway analysis of DEmRNAs. Different colors represent different pathways.
Generation of a PPI network, module analysis and hub gene selection
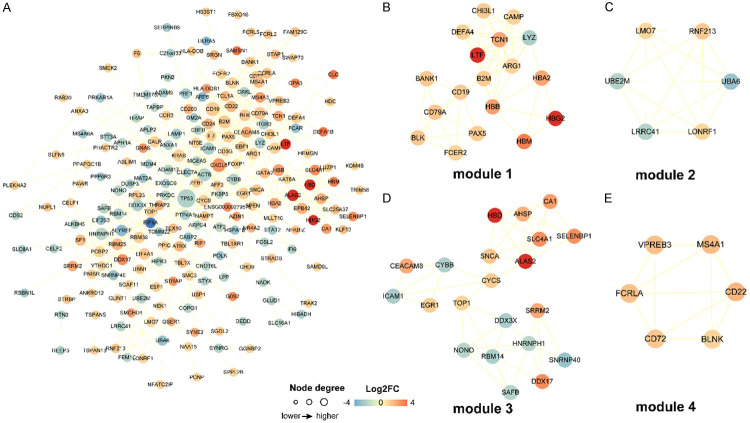
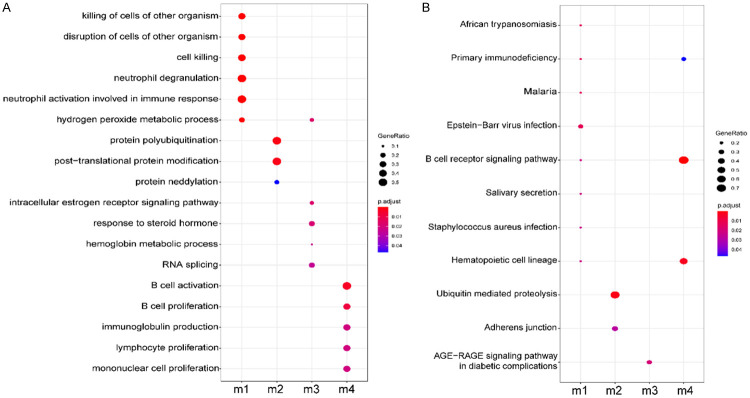
The STRING database was used to identify potential interactions of the DEmRNAs. A total of 680 PPI interactions and 217 DEmRNAs were used to construct a PPI network (Figure 4A). Twenty genes were identified as hub genes based on two vital topological features: degree and betweenness centrality (BC) (Table 1). Next, we used the MCODE plug-in to analyze the network and identified the top four modules (Figure 4B-E). The majority of the hub genes (CD19, B2M, CD79A, HNRNPH1, ICAM1, HBB, CD20, DDX3X, ALAS2, BLK, UBE2M and DDX17) were enriched in these four significant modules. Next, functional analysis of the genes associated with key modules revealed that they were primarily associated in the activation of neutrophils, the immune response, B cell activation, B cell proliferation, and the B cell receptor signaling pathway (Figure 5; Supplementary Tables 4, 5); it was evident that all of these functions are associated with immunological status. Collectively, these findings suggest that these hub genes may play a role in the immunological and inflammatory pathogenesis of MS.
Figure 4.
PPI network and modules of DEmRNAs in multiple sclerosis. (A) The nodes denote mRNAs in PPI network (confidence score >0.4). The bigger and darker the node is, the higher degree the node has. The expression level of mRNAs is shown using different colors; red circle represents upregulated mRNAs and blue circle represents downregulated mRNAs. The top four modules, module1 (B), module 2 (C), module 3 (D), module 4 (E) from PPI network are modularized by MCODE.
Table 1.
The top 20 hub genes identified in the protein-protein interaction network from differentially expressed genes in MS
| Gene | Degree | Gene | Betweenness Centrality |
|---|---|---|---|
| TP53 | 51 | TP53 | 0.448331 |
| CD19 | 28 | B2M | 0.083457 |
| CXCL8 | 26 | CXCL8 | 0.071215 |
| B2M | 22 | ACTB | 0.068447 |
| ACTB | 22 | CD19 | 0.063355 |
| CD79A | 19 | HBB | 0.054128 |
| HNRNPH1 | 19 | KRAS | 0.053122 |
| ICAM1 | 19 | HNRNPH1 | 0.050197 |
| KRAS | 19 | CALR | 0.050077 |
| HBB | 16 | NAMPT | 0.048897 |
| MS4A1 | 15 | DDX3X | 0.044766 |
| RBM25 | 15 | UBE2M | 0.044695 |
| DDX3X | 15 | SMC3 | 0.042802 |
| ALAS2 | 15 | CD79A | 0.038105 |
| BLK | 15 | DDX17 | 0.038031 |
Figure 5.
Functional enrichment analysis of top 4 modules. A. GO biological process analysis of modules. The bigger circles suggest that a more proportion of MS DEmRNAs in a module among GO function genes. B. KEGG pathway analysis of modules. The bigger circles suggest that a more proportion of MS DEmRNAs in a module among KEGG pathway genes.
Construction of a MS-related lncRNA-associated ceRNA network and topological analysis
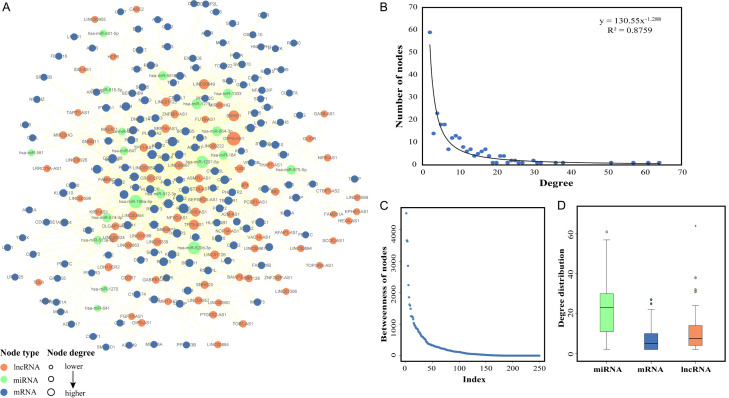
It is well known that lncRNAs can act as ‘sponges’ for miRNAs to regulate mRNAs in various diseases. To identify the regulatory roles of lncRNAs in MS, we assembled 773 lncRNA-mediated ceRNA interactions to construct a MCEN that consisted of 250 nodes and 1158 edges (including 78 lncRNAs, 153 mRNAs, 19 miRNAs, 700 lncRNA-mRNA interactions, 99 lncRNA-miRNA interactions, and 359 mRNA-miRNA interactions) (Figure 6A; Supplementary Table 6). Subsequently, we analyzed the topological properties of the MCEN. We found that the degree distribution of the nodes in the MCEN closely followed a power law distribution that was defined by f(x) =130.55x-1.288 (R2=0.8759), thus suggesting that the MCEN was a scale-free network (Figure 6B). We also calculated the betweenness of nodes in the MCEN (Figure 6C) and found that the higher the betweenness of a node, the more significant the node was in terms of maintaining tight connectivity within the network.
Figure 6.
Construction of MCEN by DEmRNAs and analysis of topological properties. A. The MS specific ceRNA network (MCEN). Bule nodes represent mRNAs, green nodes represent miRNAs, orange nodes represent lncRNAs and lines between them represent their interactions, the bigger the node is, the higher degree the node has. B. The nodes degree distribution of the MCEN. C. The nodes betweenness distribution of the MCEN. D. The degree distribution of miRNAs, mRNAs and lncRNAs in MCEN.
Furthermore, comparative analysis revealed significant differences in terms of degree distribution when compared between the mRNAs, miRNAs and lncRNAs (P<0.05, Kruskal-Wallis test) (Figure 6D). Collectively, these findings revealed that lncRNAs and miRNAs both exhibited significant high degrees, thereby indicating that they play vital roles in the MCEN.
Identification and analysis of a hub lncRNA-mediated ceRNA subnetwork in MS
Next, we used hub immune-related mRNAs from our PPI and modules to reconstruct a ceRNA subnetwork that contained 23 lncRNAs, seven miRNAs and four mRNAs (Figure 7A). The 23 lncRNAs involved in this subnetwork were identified as key lncRNAs. For further analysis, all lncRNA nodes in the ceRNA subnetwork were ranked in descending order in terms of their degree and BC, respectively. The higher degree and BC of a node in the subnetwork, the more likely the node was related to MS. Next, we identified the top three lncRNAs that exhibited the highest degree and the highest BC; these were determined to be key lncRNA ceRNAs: LINC00649, TP73-AS1, MALAT1 (Table 2). We found that these three hub lncRNAs were related to 90% of the DEmRNAs and 60% of the DEmiRNAs within the subnetwork. These findings suggested that these hub lncRNA ceRNAs are important regulators that can influence ceRNA mechanisms during the immunological and inflammatory pathogenesis of MS.
Figure 7.
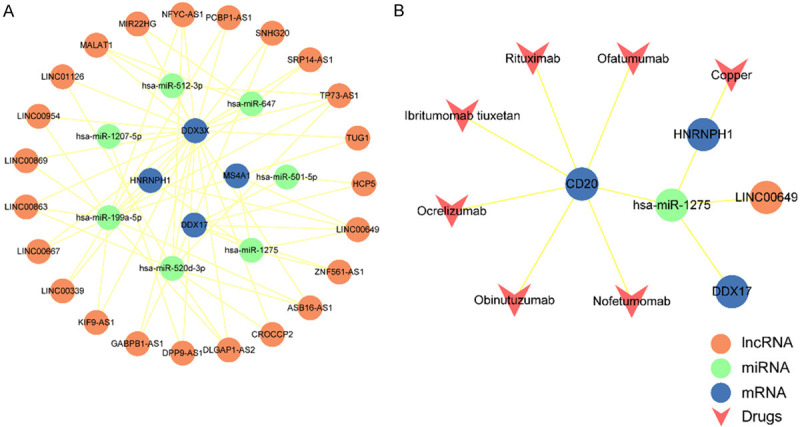
Construction of ceRNA subnetwork and associated drugs. A. The ceRNA subnetwork based on modularization of PPI network. B. Screened drugs targeted LINC00649-mediated ceRNAs. Blue circle represents mRNA, green circle represents miRNA, orange circle represents lncRNA and pink “V” represents drug.
Table 2.
The top 3 lncRNAs ceRNAs ranked by degree and BC
| LncRNA | Degree | LncRNA | Betweenness Centrality |
|---|---|---|---|
| LINC00649 | 4 | LINC00649 | 0.1667 |
| TP73-AS1 | 4 | TP73-AS1 | 0.0039 |
| MALAT1 | 3 | MALAT1 | 0.0017 |
Previous studies reported that these three lncRNAs play crucial roles in a variety of different diseases by acting on ceRNA, including cancer and autoimmune diseases. For instance, Guo et al. showed that LINC00649 acts as a ceRNA for miR-424-5p during the progression of acute myeloid leukemia [26]. In another study, MALAT1 was shown to act as a ceRNA by sponging the miRNA miR-338-3p, indirectly inducing MSL2 expression in MG [27]. A more recent study showed that TP73-AS1 could inhibit the growth of colorectal cancer cells by functioning as a ceRNA to regulate the expression levels of PTEN [28]. Collectively, these studies clearly demonstrated that the hub lncRNAs identified in our present study are clearly important regulators in a range of diseases.
The prediction of potential drugs for the treatment of MS
Emerging evidence has demonstrated that ncRNAs could be used as drug targets for the treatment of various diseases [29]. Next, we performed drug analysis using our hub lncRNA-mediated ceRNA subnetwork and the three key lncRNA ceRNAs identified previously. To do this, we analyzed the co-expression of the three lncRNAs (LINC00649, DPP9-AS1, TP73-AS1) with mRNAs from the subnetwork were to identify potential drugs in the DrugBank database. We discarded illegal drugs that are not available on the market, had not been approved by the FDA, need to be mixed with other products or drugs, lack APRD, or are vaginally administered. Following the application of these criteria, we screened 7 potential drugs. Finally, we identified these 7 drugs that involved in LINC00649 mediated ceRNAs (Figure 7B). Of these 7 drugs, rituximab, ibritumomab tiuxetan, ofatumumab, obinutuzumab, nofetumomab and ocrelizumab, were shown to be targeted by LINC00649-miR-1275-CD20 regulator pairs. A growing body of evidence now supports the fact that that rituximab can be used as a treatment option for MS [30] and that ofatumumab, as an anti-CD20 monoclonal antibody, could selectively deplete B cells [31] as a novel therapy for the treatment of MS treatment. Collectively, our analysis identified a number of novel therapeutic targets and drugs for the treatment of MS.
Discussion
MS is a complex neuroinflammatory autoimmune disease of the CNS. However, the pathogenic mechanisms underlying this condition have yet to be fully elucidated [32]. A recent study reported that interleukin (IL)-9 and transforming growth factor (TGF)-β were both expressed by immune cells and play key roles in regulating the pathogenesis of MS [33]. In addition, an extensive body of evidence now supports the fact that lncRNA-mediated ceRNA regulation represents a new post-transcriptional layer of gene regulation that plays important roles in the immune system and can exert influence on the pathological processes of numerous autoimmune diseases [34,35]. However, we have very limited understanding of the molecular mechanisms underlying the effects of lncRNA ceRNAs on MS. Elucidating the precise mechanisms responsible for the occurrence and development of MS will be highly beneficial to the diagnosis and treatment of MS patients as well as predicting their prognosis.
In this study, we integrated high-throughput expression profiles from MS patients and used the STRING tool to establish a PPI network to screen modules and extract hub DEmRNAs that might be associated with immune response and inflammatory status. Next, we constructed a MCEN that allowed us to investigate the regulatory role of lncRNAs and ceRNAs in the development of MS, as determined by miRNA-target interactions from multiple databases. According to the ‘ceRNA hypothesis’, the expression of mRNAs could be regulated by lncRNAs, thus indicating that the biological function of lncRNAs may be similar to their co-expressed mRNAs. Then, we applied PPI network and module analysis to identify hub DEmRNAs and construct a subnetwork from an entire ceRNA network. Based on further analysis of the subnetwork, we identified three hub lncRNAs ceRNAs (LINC00649, TP73-AS1, MALAT1) that might act as key lncRNAs in the immunological pathogenesis of MS. Moreover, recent studies have also demonstrated that MALAT1 can regulate both the expression of splicing factors and MS-related alternative splicing events, thus suggesting that MALAT1 participates in the pathogenesis of MS and could be applied as a new therapeutic agent for patients with MS [36,37].
GO and KEGG functional analysis further showed that the significant modules were closely related to B cells, immune response, and the proliferation of lymphocytes; these processes play a key role in the pathology of MS. Moreover, B cells are becoming increasingly investigated as mediators of inflammation in MS [38]. Modularization can dissect complex network into specific modules for further research; the genes within these modules may play vital functional roles. In this study, we found that lncRNAs were associated with the hub genes in modules via the ceRNA network and may play key regulatory roles in terms of biological function. Therefore, we could select the lncRNAs involved in the ceRNA subnetwork as important lncRNAs for further analysis. By analyzing the subnetwork, we identified three hub lncRNAs-mediated ceRNA interaction pairs featuring four hub genes (CD20, HNRNPH1, DDX17 and DDX3X). Several previous studies have shown that these hub genes, particularly HNRNPH1 and CD20, participate in the immune pathogenesis of MS [39,40]. In addition, an anti-CD20 monoclonal antibody has been used as a novel therapeutic for the treatment of MS as it can selectively deplete B cells [41]. Identification of the functional roles of these genes and co-expressed lncRNAs may provide us with new insights into the pathogenesis of MS.
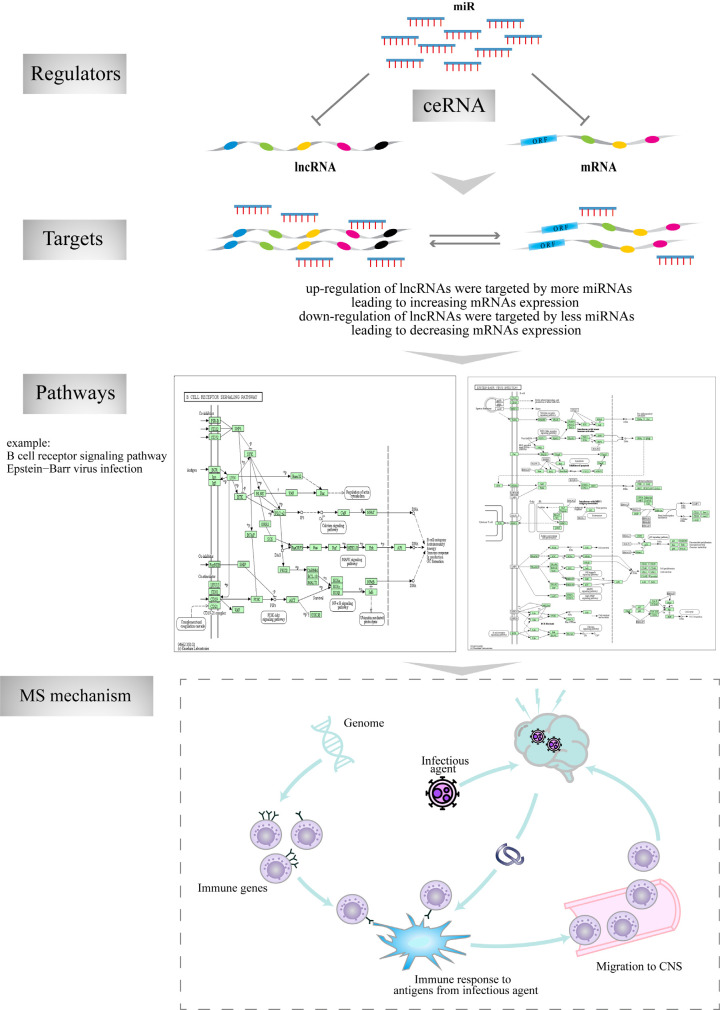
Next, we dissected the topological characteristics of the network and the interrelationships of the regulatory ceRNAs in MS, particularly with regards to the potential ceRNA mechanism for LINC00649. We identified that the dysregulation of LINC00649-mediated ceRNA interactions, containing three mRNAs and one miRNA, might participate in the immunological pathogenesis of MS either individually or synergistically. It is possible that the up-regulated LINC00649 was targeted by a greater number of miRNAs; therefore, there were fewer free miRNAs available to combine with mRNAs, thus leading to the up-regulation of mRNAs. The mRNAs that were affected by LINC00649 might be associated with an increased risk of MS. Therefore, the LINC00649-miR-1275-CD20 ceRNA network is highly likely to play specific roles in MS. To further highlight the importance of this ceRNA mechanism, we provided an example of how the inhibitory effect of miRNAs on lncRNAs and mRNAs expression (Figure 8) might be involved in the pathogenesis of MS by acting on mRNAs and other key pathways. As shown, the up-regulation of lncRNA would lead to a greater extent of miRNA binding, thus resulting in the down-regulation of miRNA; this would reduce the free miRNA repressed expression of mRNA, thus enhancing the expression of mRNA. For instance, as a gene target, CD20 received regulation through this ceRNA, which can be enriched in different pathways, such as B cell receptor signaling pathway and Epstein-Barr virus infection. This indicates an ongoing relationship between the mechanisms responsible for cell activation and proliferation that influence the immune response in the autoimmune conditions of MS. Furthermore, we used the ceRNA subnetwork to screen potential drug-targeting genes within the network. We identified six drugs that might be used to treat MS: rituximab, ibritumomab tiuxetan, ofatumumab, obinutuzumab, nofetumomab and ocrelizumab. It is well known that rituximab is an anti-CD20 monoclonal antibody that is used to treat many autoimmune diseases, including MS [30]. Moreover, based on the fact that the LINC00649-miR-1275-CD20 RNAs are known to be related to the immunological pathogenesis of MS, this LINC00649-mediated ceRNA pair could represent a novel and highly promising diagnostic biomarker and therapeutic target for MS.
Figure 8.
A model illustrating the ceRNA regulatory process. LncRNAs, miRNAs and genes cooperatively mediate pathways dysregulation that maybe influence the immune response and activation of immune cells in MS.
Previous research has shown that LINC00649 is dysregulated in many diseases. For example, one study showed that LINC00649 was down-regulated in patients with acute myeloid leukemia (AML) and might represent an unfavorable prognostic biomarker for patients with AML [42]. In another study, Chen et al. found that LINC00649 was a target for miR-15a-5p and increased the expression of HMGA1, thus leading to the progression of malignancy in patients with bladder cancer [43]. Wang et al. suggested that LINC00649 could promote the progression of gastric cancer by binding to the miR-16-5p/YAP1/Hippo signaling pathway [44]. Collectively, these previous studies, and the data generated in the present study, demonstrated that the dysregulation of LINC00649-mediated ceRNA might play a crucial to role in the pathogenesis of MS.
In conclusion, in this study, we systematically identified several key immune-related DEmRNAs in MS, integrated various RNAs to explore lncRNA/ceRNA regulatory mechanisms, and identified six potential drugs, thus providing new insight into the pathogenesis and treatment of MS. Our study focused on ceRNAs as a regulator because there is a dynamic balance of biological molecules within the human body that regulate physiological functions in a cooperative manner. Therefore, we focused on ceRNAs instead of single biomolecules to provide important evidence for lncRNAs as gene regulators in the pathogenesis of MS. New drugs screened through network will give us a novel insight in MS treatment. Thus, illustrating the ceRNAs mechanism will make a big difference in research for MS.
Acknowledgements
This study was supported by the National Natural Science Foundation of China (NSFC grant numbers 82071407, 81701190 and 81820108014).
Disclosure of conflict of interest
None.
Supplementary Table 1
Supplementary Tables 2-5
Supplementary Table 6
References
- 1.Dendrou CA, Fugger L, Friese MA. Immunopathology of multiple sclerosis. Nat Rev Immunol. 2015;15:545–558. doi: 10.1038/nri3871. [DOI] [PubMed] [Google Scholar]
- 2.Compston A, Coles A. Multiple sclerosis. Lancet. 2008;372:1502–1517. doi: 10.1016/S0140-6736(08)61620-7. [DOI] [PubMed] [Google Scholar]
- 3.Belbasis L, Bellou V, Evangelou E, Ioannidis JP, Tzoulaki I. Environmental risk factors and multiple sclerosis: an umbrella review of systematic reviews and meta-analyses. Lancet Neurol. 2015;14:263–273. doi: 10.1016/S1474-4422(14)70267-4. [DOI] [PubMed] [Google Scholar]
- 4.Koch-Henriksen N, Sørensen PS. The changing demographic pattern of multiple sclerosis epidemiology. Lancet Neurol. 2010;9:520–532. doi: 10.1016/S1474-4422(10)70064-8. [DOI] [PubMed] [Google Scholar]
- 5.Amato MP, Derfuss T, Hemmer B, Liblau R, Montalban X, Soelberg Sorensen P, Miller DH 2016 ECTRIMS Focused Workshop Group. Environmental modifiable risk factors for multiple sclerosis: report from the 2016 ECTRIMS focused workshop. Mult Scler. 2018;24:590–603. doi: 10.1177/1352458516686847. [DOI] [PubMed] [Google Scholar]
- 6.Jersild C, Svejgaard A, Fog T. HL-A antigens and multiple sclerosis. Lancet. 1972;1:1240–1241. doi: 10.1016/s0140-6736(72)90962-2. [DOI] [PubMed] [Google Scholar]
- 7.Olsson T, Barcellos LF, Alfredsson L. Interactions between genetic, lifestyle and environmental risk factors for multiple sclerosis. Nat Rev Neurol. 2017;13:25–36. doi: 10.1038/nrneurol.2016.187. [DOI] [PubMed] [Google Scholar]
- 8.Sigdel KR, Cheng A, Wang Y, Duan L, Zhang Y. The emerging functions of long noncoding rna in immune cells: autoimmune diseases. J Immunol Res. 2015;2015:848790. doi: 10.1155/2015/848790. [DOI] [PMC free article] [PubMed] [Google Scholar]
- 9.Santoro M, Nociti V, Lucchini M, De Fino C, Losavio FA, Mirabella M. Expression profile of long non-coding RNAs in serum of patients with multiple sclerosis. J Mol Neurosci. 2016;59:18–23. doi: 10.1007/s12031-016-0741-8. [DOI] [PubMed] [Google Scholar]
- 10.Salmena L, Poliseno L, Tay Y, Kats L, Pandolfi PP. A ceRNA hypothesis: the Rosetta Stone of a hidden RNA language? Cell. 2011;146:353–358. doi: 10.1016/j.cell.2011.07.014. [DOI] [PMC free article] [PubMed] [Google Scholar]
- 11.Zhou M, Wang X, Shi H, Cheng L, Wang Z, Zhao H, Yang L, Sun J. Characterization of long non-coding RNA-associated ceRNA network to reveal potential prognostic lncRNA biomarkers in human ovarian cancer. Oncotarget. 2016;7:12598–12611. doi: 10.18632/oncotarget.7181. [DOI] [PMC free article] [PubMed] [Google Scholar]
- 12.Bian Z, Lei W, Li Q, Xue W, Gao Y, Zeng Y, Wang Y, Tang L, Tang T, Chen C, Gao X, Guo W. Gm15575 functions as a ceRNA to up-regulate CCL7 expression through sponging miR-686 in Th17 cells. Mol Immunol. 2020;125:32–42. doi: 10.1016/j.molimm.2020.06.027. [DOI] [PubMed] [Google Scholar]
- 13.Wu L, Xia J, Li D, Kang Y, Fang W, Huang P. Mechanisms of M2 macrophage-derived exosomal long non-coding RNA PVT1 in regulating Th17 cell response in experimental autoimmune encephalomyelitisa. Front Immunol. 2020;11:1934. doi: 10.3389/fimmu.2020.01934. [DOI] [PMC free article] [PubMed] [Google Scholar] [Retracted]
- 14.Yue P, Jing L, Zhao X, Zhu H, Teng J. Down-regulation of taurine-up-regulated gene 1 attenuates inflammation by sponging miR-9-5p via targeting NF-kappaB1/p50 in multiple sclerosis. Life Sci. 2019;233:116731. doi: 10.1016/j.lfs.2019.116731. [DOI] [PubMed] [Google Scholar]
- 15.Dweep H, Gretz N. miRWalk2.0: a comprehensive atlas of microRNA-target interactions. Nat Methods. 2015;12:697. doi: 10.1038/nmeth.3485. [DOI] [PubMed] [Google Scholar]
- 16.Li JH, Liu S, Zhou H, Qu LH, Yang JH. starBase v2.0: decoding miRNA-ceRNA, miRNA-ncRNA and protein-RNA interaction networks from large-scale CLIP-Seq data. Nucleic Acids Res. 2014;42:D92–97. doi: 10.1093/nar/gkt1248. [DOI] [PMC free article] [PubMed] [Google Scholar]
- 17.Paraskevopoulou MD, Georgakilas G, Kostoulas N, Reczko M, Maragkakis M, Dalamagas TM, Hatzigeorgiou AG. DIANA-LncBase: experimentally verified and computationally predicted microRNA targets on long non-coding RNAs. Nucleic Acids Res. 2013;41:D239–245. doi: 10.1093/nar/gks1246. [DOI] [PMC free article] [PubMed] [Google Scholar]
- 18.Wang P, Li X, Gao Y, Guo Q, Wang Y, Fang Y, Ma X, Zhi H, Zhou D, Shen W, Liu W, Wang L, Zhang Y, Ning S, Li X. LncACTdb 2.0: an updated database of experimentally supported ceRNA interactions curated from low- and high-throughput experiments. Nucleic Acids Res. 2019;47:D121–D127. doi: 10.1093/nar/gky1144. [DOI] [PMC free article] [PubMed] [Google Scholar]
- 19.Dennis G Jr, Sherman BT, Hosack DA, Yang J, Gao W, Lane HC, Lempicki RA. DAVID: database for annotation, visualization, and integrated discovery. Genome Biol. 2003;4:P3. [PubMed] [Google Scholar]
- 20.Gene Ontology Consortium. The Gene Ontology (GO) project in 2006. Nucleic Acids Res. 2006;34:D322–326. doi: 10.1093/nar/gkj021. [DOI] [PMC free article] [PubMed] [Google Scholar]
- 21.Kanehisa M, Goto S. KEGG: kyoto encyclopedia of genes and genomes. Nucleic Acids Res. 2000;28:27–30. doi: 10.1093/nar/28.1.27. [DOI] [PMC free article] [PubMed] [Google Scholar]
- 22.Szklarczyk D, Franceschini A, Wyder S, Forslund K, Heller D, Huerta-Cepas J, Simonovic M, Roth A, Santos A, Tsafou KP, Kuhn M, Bork P, Jensen LJ, von Mering C. STRING v10: protein-protein interaction networks, integrated over the tree of life. Nucleic Acids Res. 2015;43:D447–452. doi: 10.1093/nar/gku1003. [DOI] [PMC free article] [PubMed] [Google Scholar]
- 23.Zhang G, Sun H, Zhang Y, Zhao H, Fan W, Li J, Lv Y, Song Q, Li J, Zhang M, Shi H. Characterization of dysregulated lncRNA-mRNA network based on ceRNA hypothesis to reveal the occurrence and recurrence of myocardial infarction. Cell Death Discov. 2018;4:35. doi: 10.1038/s41420-018-0036-7. [DOI] [PMC free article] [PubMed] [Google Scholar]
- 24.Wishart DS, Feunang YD, Guo AC, Lo EJ, Marcu A, Grant JR, Sajed T, Johnson D, Li C, Sayeeda Z, Assempour N, Iynkkaran I, Liu Y, Maciejewski A, Gale N, Wilson A, Chin L, Cummings R, Le D, Pon A, Knox C, Wilson M. DrugBank 5.0: a major update to the DrugBank database for 2018. Nucleic Acids Res. 2018;46:D1074–D1082. doi: 10.1093/nar/gkx1037. [DOI] [PMC free article] [PubMed] [Google Scholar]
- 25.Huang da W, Sherman BT, Lempicki RA. Systematic and integrative analysis of large gene lists using DAVID bioinformatics resources. Nat Protoc. 2009;4:44–57. doi: 10.1038/nprot.2008.211. [DOI] [PubMed] [Google Scholar]
- 26.Guo C, Ju QQ, Zhang CX, Gong M, Li ZL, Gao YY. Overexpression of HOXA10 is associated with unfavorable prognosis of acute myeloid leukemia. BMC Cancer. 2020;20:586. doi: 10.1186/s12885-020-07088-6. [DOI] [PMC free article] [PubMed] [Google Scholar]
- 27.Kong X, Wang J, Cao Y, Zhang H, Lu X, Wang Y, Bo C, Wang T, Li S, Tian K, Liu Z, Wang L. The long noncoding RNA MALAT-1 functions as a competing endogenous RNA to regulate MSL2 expression by sponging miR-338-3p in myasthenia gravis. J Cell Biochem. 2019;120:5542–5550. doi: 10.1002/jcb.27838. [DOI] [PubMed] [Google Scholar]
- 28.Jia Z, Peng J, Yang Z, Chen J, Liu L, Luo D, He P. Long non-coding RNA TP73AS1 promotes colorectal cancer proliferation by acting as a ceRNA for miR103 to regulate PTEN expression. Gene. 2019;685:222–229. doi: 10.1016/j.gene.2018.11.072. [DOI] [PubMed] [Google Scholar]
- 29.Matsui M, Corey DR. Non-coding RNAs as drug targets. Nat Rev Drug Discov. 2017;16:167–179. doi: 10.1038/nrd.2016.117. [DOI] [PMC free article] [PubMed] [Google Scholar]
- 30.Ineichen BV, Moridi T, Granberg T, Piehl F. Rituximab treatment for multiple sclerosis. Mult Scler. 2020;26:137–152. doi: 10.1177/1352458519858604. [DOI] [PubMed] [Google Scholar]
- 31.Hauser SL, Bar-Or A, Cohen JA, Comi G, Correale J, Coyle PK, Cross AH, de Seze J, Leppert D, Montalban X, Selmaj K, Wiendl H, Kerloeguen C, Willi R, Li B, Kakarieka A, Tomic D, Goodyear A, Pingili R, Haring DA, Ramanathan K, Merschhemke M, Kappos L, Asclepios I ASCLEPIOS I and ASCLEPIOS II Trial Groups. Ofatumumab versus teriflunomide in multiple sclerosis. N Engl J Med. 2020;383:546–557. doi: 10.1056/NEJMoa1917246. [DOI] [PubMed] [Google Scholar]
- 32.Rogers KA, MacDonald M. Therapeutic yoga: symptom management for multiple sclerosis. J Altern Complement Med. 2015;21:655–659. doi: 10.1089/acm.2015.0015. [DOI] [PMC free article] [PubMed] [Google Scholar]
- 33.Donninelli G, Saraf-Sinik I, Mazziotti V, Capone A, Grasso MG, Battistini L, Reynolds R, Magliozzi R, Volpe E. Interleukin-9 regulates macrophage activation in the progressive multiple sclerosis brain. J Neuroinflammation. 2020;17:149. doi: 10.1186/s12974-020-01770-z. [DOI] [PMC free article] [PubMed] [Google Scholar]
- 34.Das S, Ghosal S, Sen R, Chakrabarti J. lnCeDB: database of human long noncoding RNA acting as competing endogenous RNA. PLoS One. 2014;9:e98965. doi: 10.1371/journal.pone.0098965. [DOI] [PMC free article] [PubMed] [Google Scholar]
- 35.Chen YG, Satpathy AT, Chang HY. Gene regulation in the immune system by long noncoding RNAs. Nat Immunol. 2017;18:962–972. doi: 10.1038/ni.3771. [DOI] [PMC free article] [PubMed] [Google Scholar]
- 36.Shaker OG, Mahmoud RH, Abdelaleem OO, Ibrahem EG, Mohamed AA, Zaki OM, Abdelghaffar NK, Ahmed TI, Hemeda NF, Ahmed NA, Mansour DF. LncRNAs, MALAT1 and lnc-DC as potential biomarkers for multiple sclerosis diagnosis. Biosci Rep. 2019;39:BSR20181335. doi: 10.1042/BSR20181335. [DOI] [PMC free article] [PubMed] [Google Scholar]
- 37.Dinescu S, Ignat S, Lazar AD, Constantin C, Neagu M, Costache M. Epitranscriptomic signatures in lncRNAs and their possible roles in cancer. Genes (Basel) 2019;10:52. doi: 10.3390/genes10010052. [DOI] [PMC free article] [PubMed] [Google Scholar]
- 38.Torke S, Weber MS. Inhibition of Bruton’s tyrosine kinase as a novel therapeutic approach in multiple sclerosis. Expert Opin Investig Drugs. 2020;29:1143–1150. doi: 10.1080/13543784.2020.1807934. [DOI] [PubMed] [Google Scholar]
- 39.von Essen MR, Ammitzboll C, Hansen RH, Petersen ERS, McWilliam O, Marquart HV, Damm P, Sellebjerg F. Proinflammatory CD20+ T cells in the pathogenesis of multiple sclerosis. Brain. 2019;142:120–132. doi: 10.1093/brain/awy301. [DOI] [PubMed] [Google Scholar]
- 40.Cardamone G, Paraboschi EM, Solda G, Cantoni C, Supino D, Piccio L, Duga S, Asselta R. Not only cancer: the long non-coding RNA MALAT1 affects the repertoire of alternatively spliced transcripts and circular RNAs in multiple sclerosis. Hum Mol Genet. 2019;28:1414–1428. doi: 10.1093/hmg/ddy438. [DOI] [PubMed] [Google Scholar]
- 41.Hauser SL, Cree BAC. Treatment of multiple sclerosis: a review. Am J Med. 2020;133:1380–1390. e2. doi: 10.1016/j.amjmed.2020.05.049. [DOI] [PMC free article] [PubMed] [Google Scholar]
- 42.Guo C, Gao YY, Ju QQ, Zhang CX, Gong M, Li ZL. LINC00649 underexpression is an adverse prognostic marker in acute myeloid leukemia. BMC Cancer. 2020;20:841. doi: 10.1186/s12885-020-07331-0. [DOI] [PMC free article] [PubMed] [Google Scholar]
- 43.Chen X, Chen S. LINC00649 promotes bladder cancer malignant progression by regulating the miR15a5p/HMGA1 axis. Oncol Rep. 2021;45:8. doi: 10.3892/or.2021.7959. [DOI] [PMC free article] [PubMed] [Google Scholar]
- 44.Wang H, Di X, Bi Y, Sun S, Wang T. Long non-coding RNA LINC00649 regulates YES-associated protein 1 (YAP1)/Hippo pathway to accelerate gastric cancer (GC) progression via sequestering miR-16-5p. Bioengineered. 2021;12:1791–1802. doi: 10.1080/21655979.2021.1924554. [DOI] [PMC free article] [PubMed] [Google Scholar]
Associated Data
This section collects any data citations, data availability statements, or supplementary materials included in this article.


