Abstract
Cholangiocarcinoma (CHOL) is a digestive tract tumor with high malignancy and poor prognosis and is extremely challenging to treat. At present, induced cell death holds great promise in tumor therapy. Ferroptosis is a recently proposed pattern of programmed cell death, and numerous studies have shown that it is intimately involved in tumors. However, the roles of differentially expressed ferroptosis-related genes (DEFRGs) in CHOL have not been investigated. Our study was based on The Cancer Genome Atlas (TCGA) database, and DEFRGs were obtained to construct a prognostic riskScore model of CHOL by univariate and multivariate Cox regression analyses. Subsequently, the model was evaluated by nomogram construction, survival analysis, receiver operating characteristic (ROC) analysis, and exploration of the immune microenvironment. The mRNA and protein expression levels of each gene in the model were validated by the Gene Expression Omnibus (GEO) database, quantitative real-time PCR (qRT-PCR) and immunohistochemistry (IHC) staining. Our study found that the construction of a nomogram confirmed the predictive value of the model for overall survival (OS), and it was confirmed to have high diagnostic value by ROC analysis. Our experimental results were almost consistent with our bioinformatics results. In conclusion, we found that the prognostic model showed extremely high diagnostic and prognostic value and could predict the possibility of immunotherapy, thus providing a new direction for individualized treatment of patients with CHOL.
Keywords: Ferroptosis, cholangiocarcinoma (CHOL), bioinformatics analysis, prognosis, immune microenvironment
Introduction
Cholangiocarcinoma (CHOL) is a highly malignant solid tumor originating from the epithelial cells of the biliary tree. According to anatomic location, it is classified into intrahepatic and extrahepatic cholangiocarcinoma, and the latter is further divided into hilar and distal cholangiocarcinoma [1]. As the second most common primary liver tumor, it has currently an increasing trend in morbidity and mortality, with significant regional variation in incidence, accounting for 80% in Asia and South America [2,3]. CHOL has an insidious early onset, and the late clinical manifestations are mostly nonspecific, mainly related to biliary obstruction caused by the tumor. Most patients are often diagnosed in the middle or advanced stage or when the disease is accompanied by distant metastasis. Although there are many treatment options, the overall prognosis is still poor [4,5]. In addition, current multigenic prognostic models have been widely used to assess the risk of tumors, but a well-established prognostic biomarker for CHOL is still lacking, which makes it difficult for hepatobiliary surgeons to risk-stratify CHOL, affecting the choice of treatment regimen. Therefore, we used bioinformatics approaches to mine The Cancer Genome Atlas (TCGA) and the Gene Expression Omnibus (GEO) database and developed new prognostic models, which are essential to improve the prognosis.
Ferroptosis is an iron-dependent regulatory cell death process driven by lipid peroxidation that is different from apoptosis and necrosis. Its characteristic morphologic features are mainly plasma membrane blistering, mitochondrial cristae reduction or disappearance, mitochondrial shrinkage and mitochondrial membrane condensation [6,7]. Since the concept of ferroptosis was first proposed in 2012, many studies have shown that ferroptosis is strongly correlated with systemic lupus erythematosus, inflammatory bowel disease, and tumors [8,9]. Among these, ferroptosis has attracted extensive attention as a potential treatment modality for tumors, and we can find a large number of studies on ferroptosis in relation to tumors such as hepatocellular carcinoma [10], gastric cancer and lung adenocarcinoma [11,12]. Currently, some ferroptosis inducers composed of small molecules or nanomaterials have been developed, which not only help to overcome drug resistance but also prevent the metastasis of tumors. However, the roles of differentially expressed ferroptosis-related genes (DEFRGs) in CHOL have not been deeply studied and should be further explored.
In our study, we thoroughly explored the roles of DEFRGs in CHOL and developed a novel prognostic model based on DEFRGs. First, RNA-sequencing (RNA-seq) data and relevant clinical data were extracted from the TCGA database. Next, the FRGs were extracted from FerrDb, the two databases were integrated, and a prognostic model of CHOL composed of four genes was constructed and subsequently validated in the GEO database (GSE26566). Finally, we further elucidated the roles of FRGs in CHOL by quantitative real-time PCR (qRT-PCR) and immunohistochemical (IHC) staining of clinical samples. Studies have shown that this model holds great promise in evaluating CHOL prognosis and guiding immunotherapy. The flow chart of our research is shown in Figure 1.
Figure 1.
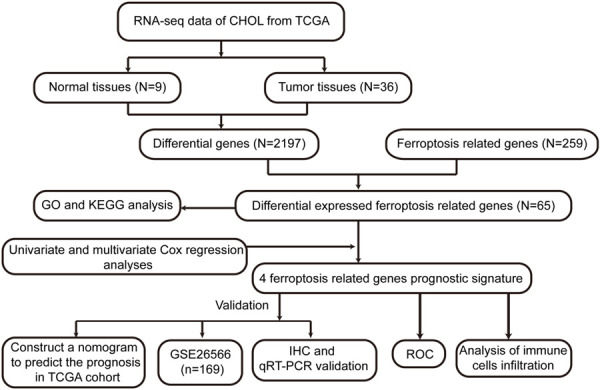
Flow chart of our study. GO, gene ontology; KEGG, Kyoto Encyclopedia of Genes and Genomes; TCGA, The Cancer Genome Atlas; ROC, receiver operating characteristic; IHC, immunohistochemistry; qRT-PCR, Quantitative real time PCR.
Materials and methods
Patients
We randomly collected 10 pairs of fresh CHOL specimens and adjacent normal tissue specimens from the First Affiliated Hospital of Chongqing Medical University from July to November 2021. Paraffin sections of 80 pairs (N=20) of CHOL tissues and normal tissues were retrospectively collected from the Department of Pathology of the First Affiliated Hospital of Chongqing Medical University (collected from December 2019 to June 2021), and all sections were confirmed as CHOL or paracancerous tissues by two pathologists. This study was approved by the Ethics Committee of the First Affiliated Hospital of Chongqing Medical University, and all patients signed informed consent forms.
Quantitative real time PCR (qRT-PCR)
Total RNA was extracted from 10 pairs of fresh CHOL and paracancerous tissues with TRIzol reagent (Takara Biotechnology Co., Ltd., Dalian, China). Total RNA was reverse-transcribed into cDNA using a PrimeScriptTM RT kit (Takara Biotechnology Co., Ltd.). Then, cDNA was amplified with specific primers, and the primer sequences involved in this study are shown in Table 1. The 2-ΔΔCt method was used to calculate the relative expression levels of genes of interest using β-actin as a standard.
Table 1.
Sequences of the primers utilized for quantitative real-time PCR
| Name | Sequence |
|---|---|
| STMN1 | |
| Forward (5’-3’) | 5’-GTACTTCTGGACTCACGGGC-3’ |
| Reverse (5’-3’) | 5’-AAGGCAAGAGTGGTCTGCTC-3’ |
| ALOX5 | |
| Forward (5’-3’) | 5’-AAAGAACTGGAAACACGTCAGAAA-3’ |
| Reverse (5’-3’) | 5’-AACTGGTGTGTACAGGGGTCAGTT-3’ |
| BNIP3 | |
| Forward (5’-3’) | 5’-AACTCAGATTGGATATGGGATTGG-3’ |
| Reverse (5’-3’) | 5’-AGAGCAGCAGAGATGGAAGG-3’ |
| EGFR | |
| Forward (5’-3’) | 5’-TCTCAGCAACATGTCGATGG-3’ |
| Reverse (5’-3’) | 5’-TCGCACTTCTTACACTTGCG-3’ |
Immunohistochemistry (IHC) staining
First, 80 pairs of CHOL and paracancerous paraffin sections were sequentially deparaffinized in xylene, rehydrated in different graded ethanol solutions, and processed for antigen retrieval and peroxidase activity blockade. Subsequently, the tissue sections were incubated with primary antibodies against STMN1 (YT3465; 1:200 dilution), ALOX5 (GB111330; 1:1000 dilution), BNIP3 (GB111204; 1:1000 dilution) and EGFR (GB111504; 1:1000 dilution). Then, sections were incubated with HRP-labeled goat anti-rabbit antibody (GB23303; 1:200 dilution) for 50 min in a 37°C incubator, stained with DAB and counterstained with hematoxylin. A semiquantitative method was used to evaluate the results of IHC staining by two pathologists blinded to the sample information. The specimens were classified into a high expression group and a low expression group according to the degree of staining, and the images were captured using a Leica microscope imaging system (100 × and 400 × magnification; Leica Microsystems GM-bh, Wetzlar, Germany).
Data collection from public databases
In our study, the RNA-seq datasets and corresponding clinical information of 36 CHOL samples and 9 normal samples were derived from the TCGA database (https://portal.gdc.cancer.gov/repository/), the data cutoff was October 10, 2021, and differentially expressed genes between tumor and normal samples were selected based on gene attributes by the “limma” package. The cutoff value was set at |log2fold change| >1 and FDR <0.05. In addition, we extracted FRGs from the FerrDb (http://www.zhounan.org/ferrdb/) database, which is a database containing ferroptosis-related regulators and ferroptosis-related diseases, and then intersected the data with the above FRGs to obtain DEFRGs. The GSE26566 dataset was acquired from the GEO (http://www.ncbi.nlm.nih.gov/geo) database as a validation set, derived from the GPL6104 platform. This dataset includes 104 freshly-frozen tumors and 59 matched non-cancerous livers from Australia, Europe and the United States, and the experiments performed by Copenhagen University.
Establishment of DEFRGs prognostic model
First, univariate Cox regression analysis was applied to identify the DEFRGs with potential prognostic value, a prognostic model was constructed, and the correlation coefficient was obtained by multivariate Cox regression. Then, the riskScore of CHOL patients was determined by the following formula: RiskScore = e(β1 × expression of STMN1) + (β2 × expression of EGFR) + (β3 × expression of ALOX5) + (β4 × expression of BNIP3) - 0.09 (β values for the correlation coefficient and a constant value of 0.09). Then, according to the median value of the riskScore, patients were divided into high- and low-risk groups for further analysis.
Construction of the nomogram
Univariate and multivariate Cox regression analyses were used to explore whether the riskScore and clinical values could be used as independent prognostic factors for CHOL patients. Subsequently, the specificity and sensitivity of the prognostic model were verified by receiver operating characteristic (ROC) curve analysis. In addition, based on clinicopathological values and riskScore, we constructed a nomogram by using the “regplot” R package to evaluate the 1-, 3-, and 5-year overall survival of CHOL patients.
Bioinformatics analysis
Gene Ontology (GO) and Kyoto Encyclopedia of Genes and Genomes (KEGG) enrichment analyses of the above DEFRGs were performed using the “clusterprofiler” package and then visualized using “ggplot”. Then, we used the single-sample gene set enrichment analysis (ssGSEA) function from the “gsva” package in the R language to calculate individual enrichment scores for each paired sample and gene set [7,13], allowing quantification of the extent of immune cell infiltration in tumors. The 24 immune cells involved in this study were referenced to a previous study by our group [14]. Furthermore, we explored immune-related pathways involved in prognostic models.
Statistical analysis
In our study, the statistical analyses were completed with R 4.1.5, SPSS (version 25), and plots of the results were performed using GraphPad Prism software (version 8.0) and R 4.1.5. Student’s t test was performed to analyze the difference in gene expression between the two groups of continuous variables, and Pearson’s correlation analysis was used. Univariate and multivariate Cox regressions were used to analyze the hazard ratio (HR) and 95% confidence interval (CI) and assess the prognostic value. P value <0.05 was considered significant.
Results
Screening of DEFRGs in CHOL patients
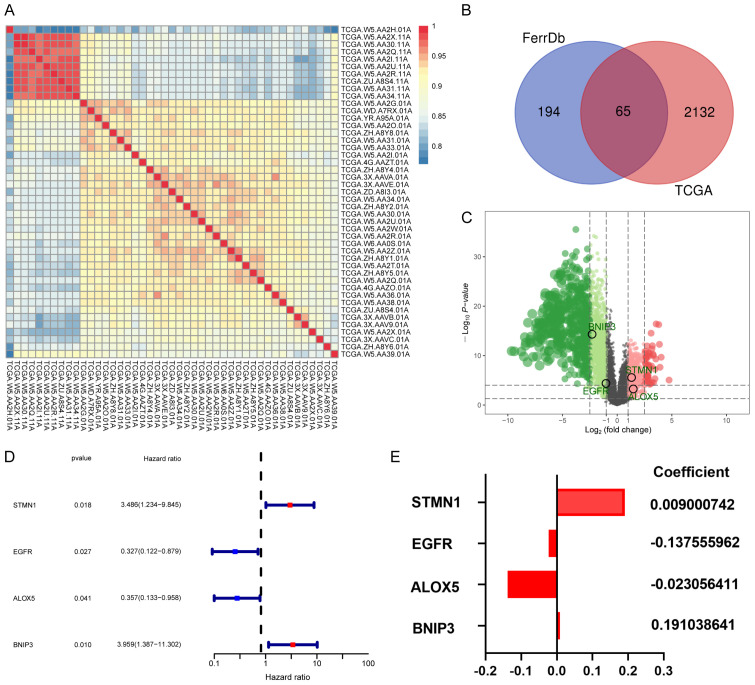
The RNA expression data and corresponding clinical information of 36 CHOL and 9 adjacent normal samples were extracted from TCGA database, hierarchical clustering was used to detect the sample group data (Figure 2A), a total of 2197 differential genes were screened out by “limma” R package, and 259 FRGs were extracted from FerrDb. The intersection of the above differential genes was taken, and a Venn diagram was used for visualization (Figure 2B). A total of 65 DEFRGs were obtained, and these up- and downregulated genes are presented in a volcano plot (Figure 2C).
Figure 2.
A. The use of the hierarchical clustering method for the classification of 9 normal and 36 tumor samples. B. The intersection of 2197 differential genes and 259 FRGs was visualized by Venn diagram, and 65 DEFRGs were ultimately screened. C. Volcano plot of all genes. D. Exploration of the prognosis of DEFRGs. The results of the univariate Cox regression analysis of overall survival in CHOL. E. The coefficients of 4 DEFRGs.
Construction of the ferroptosis-related prognostic model
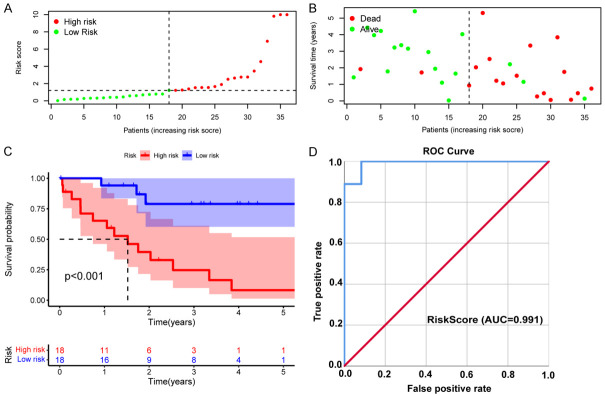
Univariate Cox regression analysis was applied to evaluate the potential prognostic value of the above DEFRGs. As a result, four DEFRGs related to the overall survival of CHOL, namely, STMN1, ALOX5, EGFR, and BNIP3, were selected for the construction of the prognostic model (Figure 2D), and multivariate Cox regression analysis was used to calculate the correlation coefficient (Figure 2E). The riskScore formula is as follows: RiskScore = e(0.009000742 × expression of STMN1) + (-0.137555962 × expression of EGFR) + (-0.023056411 × expression of ALOX5) + (0.191038641 × expression of BNIP3) - 0.09. In addition, the patients were divided into a high-risk group (n=18) and a low-risk group (n=18) according to the median riskScore (Figure 3A). As shown in the figure survStat (Figure 3B), patients in the high-risk group had a significantly shorter survival time, and Kaplan-Meier survival analysis further confirmed our conclusion (P<0.001, Figure 3C). In addition, the ROC curve indicated that the riskScore model had higher diagnostic value (AUC=0.991, Figure 3D).
Figure 3.
Validation of the riskScore prognostic model in TCGA-CHOL cohort. A. Distribution of riskScores. Green dots indicate the patients in the low-risk group, and red dots indicate the high-risk group. B. Survival status of high- and low-risk patients. Red dots represent dead patients, and green dots represent surviving patients. C. Kaplan-Meier survival curve for OS. D. The AUC of the ROC curve was used to evaluate the diagnostic value of the riskScore in the CHOL cohort.
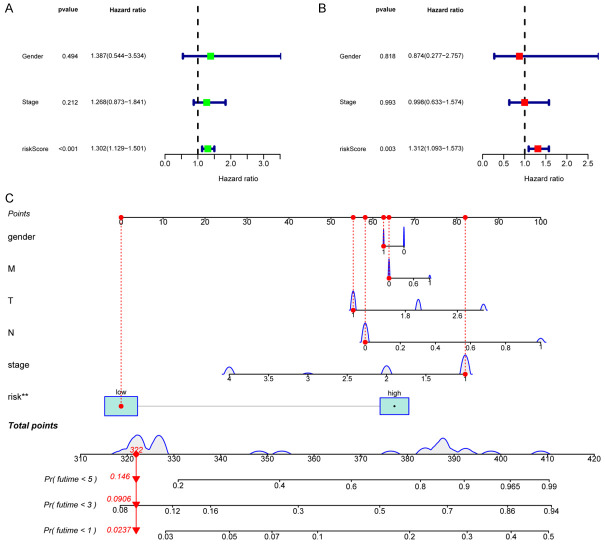
To further explore whether the riskScore can become an independent prognostic factor, we performed univariate and multivariate Cox regression analyses, and in the univariate Cox regression analysis, the riskScore was significantly correlated with survival time (HR=1.302, 95% CI=1.129-1.501, P<0.001, Figure 4A). After removing confounding factors, the riskScore remained a valuable independent prognostic factor (HR=1.312, 95% CI=1.093-1.573, P=0.003, Figure 4B).
Figure 4.
Univariate (A) and multivariate (B) Cox regression analyses to evaluate the relationship between the riskScore and clinical data and OS in the CHOL cohort. (C) Establishing a nomogram based on the signature to predict the 1-, 3-, and 5-year OS in CHOL patients.
Verification of the prognostic model
First, we established a nomogram by combining the clinical data (sex and stage) of patients and the riskScore to further predict the 1-, 3-, and 5-year overall survival of CHOL patients (Figure 4C).
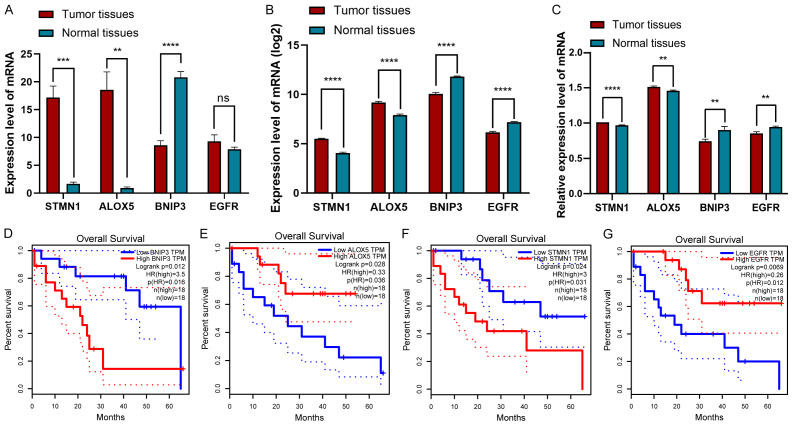
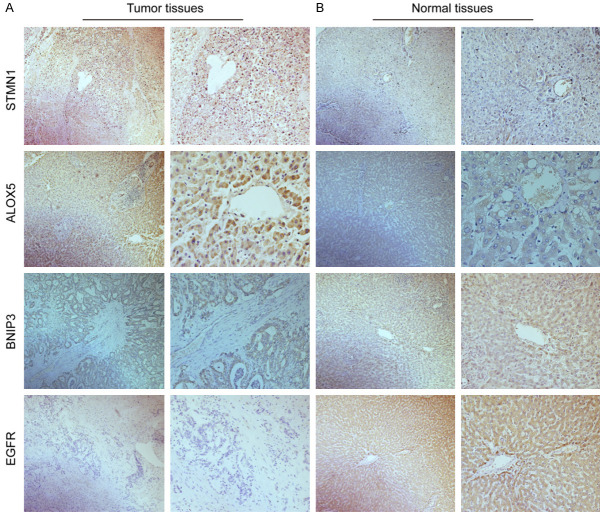
In addition, of the 45 samples in the TCGA database, STMN1 and ALOX5 were significantly upregulated compared with normal tissues (all P<0.05), but the expression of BNIP3 was significantly downregulated compared with normal tissues, and there was no significant difference in the expression of EGFR between CHOL and adjacent normal tissues (P<0.05, Figure 5A). In addition, to increase the reliability of genes in the model, we downloaded data on 169 cases of CHOL and adjacent sample data containing gene expression from the GSE26566 cohort as the validation set. Unlike the results obtained from TCGA, EGFR was highly expressed in normal samples (P<0.05, Figure 5B). Moreover, we examined the mRNA and protein expression levels corresponding to the four genes between CHOL tissues and adjacent normal tissues by qRT-PCR (n=10, P<0.05, Figure 5C) and IHC (n=20, Figure 6). We found that the results were almost consistent with those in TCGA and GEO, and the expression level of EGFR was low in CHOL tissues, the results indicated that the difference was more significant after expanding the sample size.
Figure 5.
A-C. Differential mRNA expression levels of the four DEFRGs in CHOL and normal tissues. A. Data from the TCGA. B. Data from the GEO. C. Ten pairs of fresh CHOL specimens and adjacent normal tissue specimens from the First Affiliated Hospital of Chongqing Medical University. D-G. The overall survival curve of CHOL patients based on the expression of BNIP3, ALOX5, STMN1 and EGFR.
Figure 6.
Immunohistochemistry results of four key FRGs in CHOL tumor (A) and adjacent normal (B) tissues.
Finally, the survival curves of the above genes were plotted using the Gene Expression Profiling Interactive Analysis (GEPIA) database; patients with low expression of STMN1 and BNIP3 had a long survival time, and those with high expression of ALOX5 versus EGFR had a long survival time (Figure 5D-G).
Functional enrichment analysis
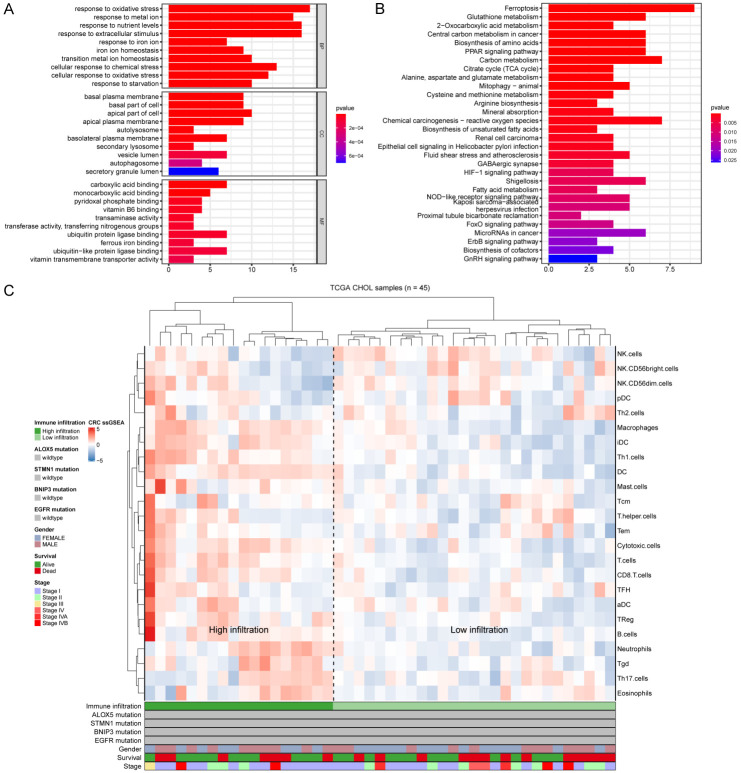
We performed functional enrichment analysis of 65 DEFRGs to explore the pathways and biological functions involved in CHOL. The GO results showed that these DEFRGs were mainly related to the response to oxidative stress (Figure 7A). KEGG analysis indicated that these DEFRGs were mainly enriched in ferroptosis, glutathione metabolism, 2-oxocarboxylic acid metabolism and central carbon metabolism in cancer (Figure 7B).
Figure 7.
(A, B) Functional enrichment analysis of the 65 DEFRGs in CHOL, showing the top 10 enriched BP, CC and MF (A), and KEGG pathways (B). (C) The 45 patients from the TCGA-CHOL cohort were clustered using single-sample gene set enrichment analysis scores from 24 immune cell types. The mutation statuses of ALOX5, STMN1, BNIP3 and EGFR, sex, survival, and stage are shown in the lower panel. High infiltration and low infiltration were defined by hierarchical clustering analysis.
Correlation between immune infiltration and prognosis of CHOL
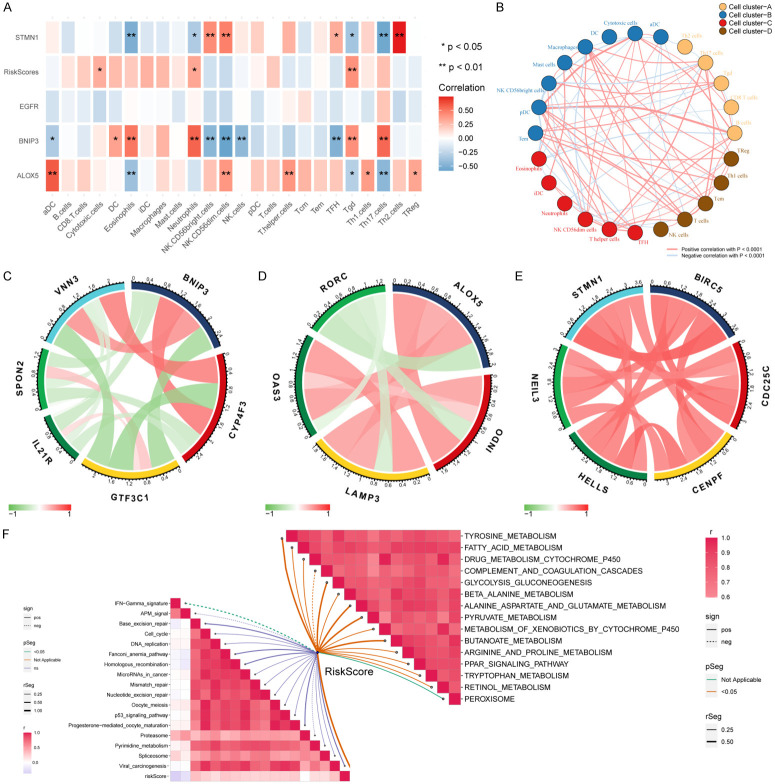
To explore the infiltration of immune cells in CHOL, we analyzed 45 CHOL and paracancerous samples in TCGA, which were divided into a high invasion group and a low invasion group according to the cluster analysis of the degree of immune cell infiltration, and the immunoprofile of CHOL was visualized using ssGSEA (Figure 7C). Based on this analysis, we found significant differences in the infiltration of immune cells in CHOL. Next, the association between the four DEFRGs and the immune infiltrate microenvironment was further analyzed (Figure 8A). The results revealed that ALOX5 had the strongest correlations with aDCs (r=0.60, P<0.001) and Th17 cells (r=-0.45, P<0.01), BNIP3 was positively correlated with neutrophils (r=0.57, P<0.001) and negatively correlated with NK CD56 dim cells (r=-0.58, P<0.001), and STMN1 had a positive correlation with Th2 cells (r=0.74, P<0.001). ALOX5 was negatively correlated with Th17 cells (r=-0.56, P<0.001), whereas there was no significant correlation between EGFR and immune cells. Tgd, cytotoxic cells and neutrophils were more significantly enriched in the high-risk group of the prognostic model.
Figure 8.
(A) Correlations between the DEFRGs, riskScore, and 24 immune cell types; blue boxes indicate negative correlations, and red boxes indicate positive correlations. *represents P<0.05, **represents P<0.01. (B) Cluster analysis of 24 immune cell types, which were divided into four categories. Red line indicates positive correlation, blue line indicates negative correlation. (C-E) Correlations between BNIP3, ALOX5, STMN1 and immune biomarkers in the TCGA-CHOL cohort. (F) Correlations between riskScore and immunotherapy-predicted pathways (left half of F) and correlations between riskScore and enriched pathways of the gene sets in CHOL (right half of F).
Next, we validated the correlation between immune cells and the prognostic model by immune cell markers, which showed that BNIP3 was negatively correlated with SPON2 and IL-21R, markers of NK CD56dim cells, and strongly positively correlated with CYP4F3 and VNN3, markers of neutrophils (Figure 8C). ALOX5 was positively correlated with the molecular markers LAMP3 and OAS3 of aDCs and negatively correlated with the immune marker RORC of Th17 cells (Figure 8D). STMN1 was positively correlated with the biomarkers BIRC5, CDC25C, HELLS, NEIL3 and CENPF of Th2 cells (Figure 8E), which were consistent with our previous conclusion.
In addition, enrichment analysis of immune function in CHOL showed that the riskScore was negatively correlated with the IFN-γ signature. Then we explored the pathways related to CHOL by GSEA. The riskScore was positively correlated with tyrosine metabolism, fatty acid metabolism, and cytochrome P450 drug metabolism, but negatively correlated with complexity and coordination cascades (Figure 8F).
Discussion
Cell death has long been considered a typical feature of malignant tumors, as it is very important for maintaining body balance and preventing excessive tumor proliferation. Cancerous cells always show high metabolic levels, antioxidant modification, and increased iron intake to maintain unlimited proliferation [15]. The proposal of ferroptosis alters people’s understanding of cell death and emphasizes the important role of excessive iron metabolism in carcinogenesis [16]. In recent years, this unique cell death mode has become a new research hotspot. A considerable number of scholars have explored the mechanism of ferroptosis in tumors, such as hepatocellular carcinoma [17], glioma [18], and lung adenocarcinoma [19]. However, the mechanism of ferroptosis in CHOL is not clear. In our study, we found that these DEFRGs were mainly related to oxidative stress, ferroptosis, and tumor metabolism. In addition, a nomogram based on clinicopathological values and riskScore was constructed to help clinicians make better decisions and treatment plans. The ROC curve indicated that the model also has high specificity and sensitivity and can be used for the early diagnosis of CHOL. In addition, single-sample immune cell enrichment analysis showed that ferroptosis was closely related to immunity in CHOL. These results suggest that the model has great research value in CHOL.
At present, although great progress has been made in the treatment of CHOL, its prognosis is still poor due to its complex pathogenesis. Therefore, understanding the specific pathogenesis of CHOL is very important for the development of targeted therapy. The GO and KEGG results suggested that the DEFRGs were significantly enriched in ferroptosis, reactive oxygen species (ROS), cell oxidative stress, iron ion reaction, carbon metabolism, and other related pathways. These biological processes are crucial for the implementation of ferroptosis [20,21]. A large number of studies have shown that ferroptosis is a ROS- and iron-dependent cell death mode [22]. Therefore, the close relationship between ferroptosis and oxidative stress can be understood as iron-dependent lipid peroxidation accumulation. Iron chelators and fat-soluble antioxidants can inhibit ferroptosis [23]. We further analyzed the gene enrichment pathway in CHOL by GSEA, which showed that it was significantly enriched in amino acid, fatty acid and other metabolic pathways, and the riskScore was positively correlated with most pathways (Figure 8F). Moreover, studies have shown that fatty acids can be used as an energy source for the progression of CHOL [24], which further confirms our conclusion.
It is worth noting that the prognostic model we constructed is closely related to the ferroptosis of tumors. The mitotic receptor BNIP3 is a key mitochondrial autophagy receptor in cells and is necessary to prevent increases in ROS levels and cell death. It is regulated by upstream hypoxia inducible factor (HIF-1) and is highly expressed in normal tissues; it can inhibit the growth of many types of tumors [25,26]. However, when cells become cancerous, the interaction between inflammation and tumors increases the production of ROS in tumor cells [25,27], and the production of ROS may also be carcinogenic, leading to oxidative DNA damage and genetic instability [28]. At this time, the BNIP3 gene is a risk factor in tumors, which may be the result of the joint action of many factors. The lipase family encoded by the ALOX5 gene plays an important role in leukotriene biosynthesis and participates in a variety of processes, such as inflammation and tumors [25]. In the study of stroke, some scholars proposed that N-acetylcysteine (NAC) can prevent ferroptosis by neutralizing the toxic lipids produced by ALOX5 [29]. However, the role of ALOX5 in CHOL needs to be further explored. STMN1 is the main regulator of microtubule dynamics and plays an important role in the regulation of the cell cycle [30], which is closely related to the proliferation and division of tumor cells [31].
In recent years, there has been a close relationship between immunity and tumor progression, and this is also a research hotspot. A large number of studies have shown that the tumor immune microenvironment has important value in predicting tumor prognosis and evaluating therapeutic effects [32]. Different types of immune cell infiltration may create a favorable or unfavorable environment for tumor cell proliferation and metastasis [33]. Interestingly, this study found a correlation between the expression level of genes in the prognostic model and immune infiltrating cells.
Among them, BNIP3 has a strong correlation with most immune cells, especially NK CD56dim cells and neutrophils. First, for NK CD56dim cells, increasing evidence supports that NK CD56dim cells play a cytotoxic role mainly by mediating the antitumor response [34,35]. We also found that the riskScore was negatively correlated with IFN-γ in CHOL (Figure 8F). Notably, NK CD56dim cells secrete IFN-γ to activate antitumor adaptive immunity in head and neck cancer [36], further confirming our conclusion. Second, it is well known that the presence of neutrophils in tumors is usually related to the poor prognosis of patients because they participate in the proliferation, invasion, and immunosuppression of various tumors and induce blood vessels by releasing ROS, reactive nitrogen species (RNS) or protease to promote tumorigenesis [37-39]. This is consistent with the aforementioned poor prognosis of patients with high expression of BNIP3 in CHOL (Figure 5D).
In addition, we found that the expression of ALOX5 was positively correlated with aDC and its molecular markers LAMP3 and OAS3. From the cluster analysis of immune cells (Figure 8B), aDCs were positively correlated with NK CD56dim cells. Therefore, aDCs may also play an antitumor role in tumors. LAMP3 is induced by hypoxia and is upregulated in esophageal cancer [40]. Another molecular marker, OAS3, is an important part of interferon-induced antiviral enzymes, and studies have shown that the high expression of OAS3 in breast cancer is closely related to prognosis [41]. The expression of ALOX5 is negatively correlated with Th17 cells. Some studies have shown that in colorectal cancer, patients with high infiltration of Th17 and high expression of its immune marker RORC have a poor prognosis [42]. This seems to be one of the reasons why ALOX5 is highly expressed in CHOL, but the prognosis of patients is better (Figure 5E).
In addition, the oncogene STMN1 is positively correlated with Th2 cells in CHOL. Studies have shown that patients with high tumor malignancy have a low Th1/Th2 ratio; generally speaking, tumor cells produce immunosuppressive cytokines and prostaglandins, which relatively enhance the immune effect of Th2 cells and significantly reduce the antitumor ability [42-44]. Interestingly, we know that BIRC5, CDC25C, HELLS, NEIL3, and CENPF are common immune markers of Th2 cells. Some scholars believe that BIRC5 plays an important role in cell division and can inhibit apoptosis [45]. In hepatocellular carcinoma, the upregulation of BIRC5 expression promotes the proliferation of tumor cells [46]. CDC25C plays a significant role in regulating the cell cycle and is highly expressed in prostate cancer [47]. The high expression of HELLS and NEIL3 is related to the shortening of survival time associated with liver cancer and other tumors [48,49]. The upregulated expression of CENPF is closely related to the poor prognosis and progression of liver cancer, lung adenocarcinoma and other tumors [50,51]. These findings seem to explain the poor prognosis of patients with high expression of STMN1 in CHOL (Figure 5F).
Our study has some limitations. First, the amount of patient information available in public databases is insufficient, and clinical staging, treatment options and other valuable data could not be obtained, therefore, a large amount of clinicopathological information needs to be collected later for prospective studies. Moreover, the mechanism by which the DEFRGs regulated CHOL in this prognostic model needs to be explored in further experimental studies.
Conclusions
In conclusion, this study is the first to construct a polygenic prognostic model of ferroptosis in CHOL, showing that ALOX5, BNIP3, EGFR and STMN1 act together to strongly contribute to CHOL cell apoptosis, ferroptosis and the immune microenvironment and confirming the diagnostic and prognostic value of this model in CHOL. As relevant studies are scarce, this topic also provides ideas and directions for research related to ferroptosis in CHOL, and provides a reference for finding new treatment modalities.
Acknowledgements
We express our profound thanks to the teachers who provided me with experimental guidance and pathology department of Chongqing Medical University (Chongqing).
Disclosure of conflict of interest
None.
References
- 1.Banales JM, Cardinale V, Carpino G, Marzioni M, Andersen JB, Invernizzi P, Lind GE, Folseraas T, Forbes SJ, Fouassier L, Geier A, Calvisi DF, Mertens JC, Trauner M, Benedetti A, Maroni L, Vaquero J, Macias RI, Raggi C, Perugorria MJ, Gaudio E, Boberg KM, Marin JJ, Alvaro D. Expert consensus document: cholangiocarcinoma: current knowledge and future perspectives consensus statement from the European Network for the Study of Cholangiocarcinoma (ENS-CCA) Nat Rev Gastroenterol Hepatol. 2016;13:261–280. doi: 10.1038/nrgastro.2016.51. [DOI] [PubMed] [Google Scholar]
- 2.Rizvi S, Gores GJ. Pathogenesis, diagnosis, and management of cholangiocarcinoma. Gastroenterology. 2013;145:1215–1229. doi: 10.1053/j.gastro.2013.10.013. [DOI] [PMC free article] [PubMed] [Google Scholar]
- 3.Valle JW, Borbath I, Khan SA, Huguet F, Gruenberger T, Arnold D ESMO Guidelines Committee. Biliary cancer: ESMO Clinical Practice Guidelines for diagnosis, treatment and follow-up. Ann Oncol. 2016;27(Suppl 5):v28–v37. doi: 10.1093/annonc/mdw324. [DOI] [PubMed] [Google Scholar]
- 4.Lendvai G, Szekerczés T, Illyés I, Dóra R, Kontsek E, Gógl A, Kiss A, Werling K, Kovalszky I, Schaff Z, Borka K. Cholangiocarcinoma: classification, histopathology and molecular carcinogenesis. Pathol Oncol Res. 2020;26:3–15. doi: 10.1007/s12253-018-0491-8. [DOI] [PubMed] [Google Scholar]
- 5.Rodrigues PM, Olaizola P, Paiva NA, Olaizola I, Agirre-Lizaso A, Landa A, Bujanda L, Perugorria MJ, Banales JM. Pathogenesis of cholangiocarcinoma. Annu Rev Pathol. 2021;16:433–463. doi: 10.1146/annurev-pathol-030220-020455. [DOI] [PubMed] [Google Scholar]
- 6.Dixon SJ, Lemberg KM, Lamprecht MR, Skouta R, Zaitsev EM, Gleason CE, Patel DN, Bauer AJ, Cantley AM, Yang WS, Morrison B 3rd, Stockwell BR. Ferroptosis: an iron-dependent form of nonapoptotic cell death. Cell. 2012;149:1060–1072. doi: 10.1016/j.cell.2012.03.042. [DOI] [PMC free article] [PubMed] [Google Scholar]
- 7.Stockwell BR, Friedmann Angeli JP, Bayir H, Bush AI, Conrad M, Dixon SJ, Fulda S, Gascón S, Hatzios SK, Kagan VE, Noel K, Jiang X, Linkermann A, Murphy ME, Overholtzer M, Oyagi A, Pagnussat GC, Park J, Ran Q, Rosenfeld CS, Salnikow K, Tang D, Torti FM, Torti SV, Toyokuni S, Woerpel KA, Zhang DD. Ferroptosis: a regulated cell death nexus linking metabolism, redox biology, and disease. Cell. 2017;171:273–285. doi: 10.1016/j.cell.2017.09.021. [DOI] [PMC free article] [PubMed] [Google Scholar]
- 8.Li P, Jiang M, Li K, Li H, Zhou Y, Xiao X, Xu Y, Krishfield S, Lipsky PE, Tsokos GC, Zhang X. Glutathione peroxidase 4-regulated neutrophil ferroptosis induces systemic autoimmunity. Nat Immunol. 2021;22:1107–1117. doi: 10.1038/s41590-021-00993-3. [DOI] [PMC free article] [PubMed] [Google Scholar]
- 9.Xu M, Tao J, Yang Y, Tan S, Liu H, Jiang J, Zheng F, Wu B. Ferroptosis involves in intestinal epithelial cell death in ulcerative colitis. Cell Death Dis. 2020;11:86. doi: 10.1038/s41419-020-2299-1. [DOI] [PMC free article] [PubMed] [Google Scholar]
- 10.Liang JY, Wang DS, Lin HC, Chen XX, Yang H, Zheng Y, Li YH. A novel ferroptosis-related gene signature for overall survival prediction in patients with hepatocellular carcinoma. Int J Biol Sci. 2020;16:2430–2441. doi: 10.7150/ijbs.45050. [DOI] [PMC free article] [PubMed] [Google Scholar]
- 11.Jiang X, Yan Q, Xie L, Xu S, Jiang K, Huang J, Wen Y, Yan Y, Zheng J, Tang S, Nie K, Zheng Z, Pan J, Liu P, Huang Y, Yan X, Zou Y, Chen X, Liu F, Li P, Zhuang K. Construction and validation of a ferroptosis-related prognostic model for gastric cancer. J Oncol. 2021;2021:6635526. doi: 10.1155/2021/6635526. [DOI] [PMC free article] [PubMed] [Google Scholar]
- 12.Wohlhieter CA, Richards AL, Uddin F, Hulton CH, Quintanal-Villalonga À, Martin A, de Stanchina E, Bhanot U, Asher M, Shah NS, Hayatt O, Buonocore DJ, Rekhtman N, Shen R, Arbour KC, Donoghue M, Poirier JT, Sen T, Rudin CM. Concurrent mutations in STK11 and KEAP1 promote ferroptosis protection and SCD1 dependence in lung cancer. Cell Rep. 2020;33:108444. doi: 10.1016/j.celrep.2020.108444. [DOI] [PMC free article] [PubMed] [Google Scholar]
- 13.Barbie DA, Tamayo P, Boehm JS, Kim SY, Moody SE, Dunn IF, Schinzel AC, Sandy P, Meylan E, Scholl C, Fröhling S, Chan EM, Sos ML, Michel K, Mermel C, Silver SJ, Weir BA, Reiling JH, Sheng Q, Gupta PB, Wadlow RC, Le H, Hoersch S, Wittner BS, Ramaswamy S, Livingston DM, Sabatini DM, Meyerson M, Thomas RK, Lander ES, Mesirov JP, Root DE, Gilliland DG, Jacks T, Hahn WC. Systematic RNA interference reveals that oncogenic KRAS-driven cancers require TBK1. Nature. 2009;462:108–112. doi: 10.1038/nature08460. [DOI] [PMC free article] [PubMed] [Google Scholar]
- 14.Toyokuni S, Ito F, Yamashita K, Okazaki Y, Akatsuka S. Iron and thiol redox signaling in cancer: an exquisite balance to escape ferroptosis. Free Radic Biol Med. 2017;108:610–626. doi: 10.1016/j.freeradbiomed.2017.04.024. [DOI] [PubMed] [Google Scholar]
- 15.Liu Y, Zhang X, Zhang J, Tan J, Li J, Song Z. Development and validation of a combined ferroptosis and immune prognostic classifier for hepatocellular carcinoma. Front Cell Dev Biol. 2020;8:596679. doi: 10.3389/fcell.2020.596679. [DOI] [PMC free article] [PubMed] [Google Scholar]
- 16.Zhuo S, Chen Z, Yang Y, Zhang J, Tang J, Yang K. Clinical and biological significances of a ferroptosis-related gene signature in glioma. Front Oncol. 2020;10:590861. doi: 10.3389/fonc.2020.590861. [DOI] [PMC free article] [PubMed] [Google Scholar]
- 17.Zhang A, Yang J, Ma C, Li F, Luo H. Development and validation of a robust ferroptosis-related prognostic signature in lung adenocarcinoma. Front Cell Dev Biol. 2021;9:616271. doi: 10.3389/fcell.2021.616271. [DOI] [PMC free article] [PubMed] [Google Scholar]
- 18.Hassannia B, Vandenabeele P, Vanden Berghe T. Targeting ferroptosis to iron out cancer. Cancer Cell. 2019;35:830–849. doi: 10.1016/j.ccell.2019.04.002. [DOI] [PubMed] [Google Scholar]
- 19.Lelièvre P, Sancey L, Coll JL, Deniaud A, Busser B. Iron dysregulation in human cancer: altered metabolism, biomarkers for diagnosis, prognosis, monitoring and rationale for therapy. Cancers (Basel) 2020;12:3524. doi: 10.3390/cancers12123524. [DOI] [PMC free article] [PubMed] [Google Scholar]
- 20.Xie Y, Hou W, Song X, Yu Y, Huang J, Sun X, Kang R, Tang D. Ferroptosis: process and function. Cell Death Differ. 2016;23:369–379. doi: 10.1038/cdd.2015.158. [DOI] [PMC free article] [PubMed] [Google Scholar]
- 21.Dixon SJ, Winter GE, Musavi LS, Lee ED, Snijder B, Rebsamen M, Superti-Furga G, Stockwell BR. Human haploid cell genetics reveals roles for lipid metabolism genes in nonapoptotic cell death. ACS Chem Biol. 2015;10:1604–1609. doi: 10.1021/acschembio.5b00245. [DOI] [PMC free article] [PubMed] [Google Scholar]
- 22.Zhang H, Bosch-Marce M, Shimoda LA, Tan YS, Baek JH, Wesley JB, Gonzalez FJ, Semenza GL. Mitochondrial autophagy is an HIF-1-dependent adaptive metabolic response to hypoxia. J Biol Chem. 2008;283:10892–10903. doi: 10.1074/jbc.M800102200. [DOI] [PMC free article] [PubMed] [Google Scholar] [Retracted]
- 23.Li L, Tan J, Miao Y, Lei P, Zhang Q. ROS and autophagy: interactions and molecular regulatory mechanisms. Cell Mol Neurobiol. 2015;35:615–621. doi: 10.1007/s10571-015-0166-x. [DOI] [PMC free article] [PubMed] [Google Scholar]
- 24.Nie J, Zhang J, Wang L, Lu L, Yuan Q, An F, Zhang S, Jiao Y. Adipocytes promote cholangiocarcinoma metastasis through fatty acid binding protein 4. J Exp Clin Cancer Res. 2017;36:183. doi: 10.1186/s13046-017-0641-y. [DOI] [PMC free article] [PubMed] [Google Scholar]
- 25.Prevete N, Liotti F, Amoresano A, Pucci P, de Paulis A, Melillo RM. New perspectives in cancer: modulation of lipid metabolism and inflammation resolution. Pharmacol Res. 2018;128:80–87. doi: 10.1016/j.phrs.2017.09.024. [DOI] [PubMed] [Google Scholar]
- 26.Chourasia AH, Macleod KF. Tumor suppressor functions of BNIP3 and mitophagy. Autophagy. 2015;11:1937–1938. doi: 10.1080/15548627.2015.1085136. [DOI] [PMC free article] [PubMed] [Google Scholar]
- 27.Güngör N, Knaapen AM, Munnia A, Peluso M, Haenen GR, Chiu RK, Godschalk RW, van Schooten FJ. Genotoxic effects of neutrophils and hypochlorous acid. Mutagenesis. 2010;25:149–154. doi: 10.1093/mutage/gep053. [DOI] [PubMed] [Google Scholar]
- 28.Karuppagounder SS, Alin L, Chen Y, Brand D, Bourassa MW, Dietrich K, Wilkinson CM, Nadeau CA, Kumar A, Perry S, Pinto JT, Darley-Usmar V, Sanchez S, Milne GL, Pratico D, Holman TR, Carmichael ST, Coppola G, Colbourne F, Ratan RR. N-acetylcysteine targets 5 lipoxygenase-derived, toxic lipids and can synergize with prostaglandin E to inhibit ferroptosis and improve outcomes following hemorrhagic stroke in mice. Ann Neurol. 2018;84:854–872. doi: 10.1002/ana.25356. [DOI] [PMC free article] [PubMed] [Google Scholar]
- 29.Steinmetz MO. Structure and thermodynamics of the tubulin-stathmin interaction. J Struct Biol. 2007;158:137–147. doi: 10.1016/j.jsb.2006.07.018. [DOI] [PubMed] [Google Scholar]
- 30.Belletti B, Baldassarre G. Stathmin: a protein with many tasks. New biomarker and potential target in cancer. Expert Opin Ther Targets. 2011;15:1249–1266. doi: 10.1517/14728222.2011.620951. [DOI] [PubMed] [Google Scholar]
- 31.Zhang HQ, Guo X, Guo SQ, Wang Q, Chen XQ, Li XN, Guo LS. STMN1 in colon cancer: expression and prognosis in Chinese patients. Eur Rev Med Pharmacol Sci. 2016;20:2038–2044. [PubMed] [Google Scholar]
- 32.Li M, Yang J, Zhou W, Ren Y, Wang X, Chen H, Zhang J, Chen J, Sun Y, Cui L, Liu X, Wang L, Wu C. Activation of an AKT/FOXM1/STMN1 pathway drives resistance to tyrosine kinase inhibitors in lung cancer. Br J Cancer. 2017;117:974–983. doi: 10.1038/bjc.2017.292. [DOI] [PMC free article] [PubMed] [Google Scholar]
- 33.Binnewies M, Roberts EW, Kersten K, Chan V, Fearon DF, Merad M, Coussens LM, Gabrilovich DI, Ostrand-Rosenberg S, Hedrick CC, Vonderheide RH, Pittet MJ, Jain RK, Zou W, Howcroft TK, Woodhouse EC, Weinberg RA, Krummel MF. Understanding the tumor immune microenvironment (TIME) for effective therapy. Nat Med. 2018;24:541–550. doi: 10.1038/s41591-018-0014-x. [DOI] [PMC free article] [PubMed] [Google Scholar]
- 34.Gajewski TF, Schreiber H, Fu YX. Innate and adaptive immune cells in the tumor microenvironment. Nat Immunol. 2013;14:1014–1022. doi: 10.1038/ni.2703. [DOI] [PMC free article] [PubMed] [Google Scholar]
- 35.Cooper MA, Fehniger TA, Caligiuri MA. The biology of human natural killer-cell subsets. Trends Immunol. 2001;22:633–640. doi: 10.1016/s1471-4906(01)02060-9. [DOI] [PubMed] [Google Scholar]
- 36.Jonges LE, Albertsson P, van Vlierberghe RL, Ensink NG, Johansson BR, van de Velde CJ, Fleuren GJ, Nannmark U, Kuppen PJ. The phenotypic heterogeneity of human natural killer cells: presence of at least 48 different subsets in the peripheral blood. Scand J Immunol. 2001;53:103–110. doi: 10.1046/j.1365-3083.2001.00838.x. [DOI] [PubMed] [Google Scholar]
- 37.Mandal R, Şenbabaoğlu Y, Desrichard A, Havel JJ, Dalin MG, Riaz N, Lee KW, Ganly I, Hakimi AA, Chan TA, Morris LG. The head and neck cancer immune landscape and its immunotherapeutic implications. JCI Insight. 2016;1:e89829. doi: 10.1172/jci.insight.89829. [DOI] [PMC free article] [PubMed] [Google Scholar]
- 38.Swierczak A, Mouchemore KA, Hamilton JA, Anderson RL. Neutrophils: important contributors to tumor progression and metastasis. Cancer Metastasis Rev. 2015;34:735–751. doi: 10.1007/s10555-015-9594-9. [DOI] [PubMed] [Google Scholar]
- 39.Coffelt SB, Wellenstein MD, de Visser KE. Neutrophils in cancer: neutral no more. Nat Rev Cancer. 2016;16:431–446. doi: 10.1038/nrc.2016.52. [DOI] [PubMed] [Google Scholar]
- 40.Antonio N, Bønnelykke-Behrndtz ML, Ward LC, Collin J, Christensen IJ, Steiniche T, Schmidt H, Feng Y, Martin P. The wound inflammatory response exacerbates growth of pre-neoplastic cells and progression to cancer. EMBO J. 2015;34:2219–2236. doi: 10.15252/embj.201490147. [DOI] [PMC free article] [PubMed] [Google Scholar]
- 41.Liao X, Chen Y, Liu D, Li F, Li X, Jia W. High expression of LAMP3 is a novel biomarker of poor prognosis in patients with esophageal squamous cell carcinoma. Int J Mol Sci. 2015;16:17655–17667. doi: 10.3390/ijms160817655. [DOI] [PMC free article] [PubMed] [Google Scholar]
- 42.Zhang Y, Yu C. Prognostic characterization of OAS1/OAS2/OAS3/OASL in breast cancer. BMC Cancer. 2020;20:575. doi: 10.1186/s12885-020-07034-6. [DOI] [PMC free article] [PubMed] [Google Scholar]
- 43.Tosolini M, Kirilovsky A, Mlecnik B, Fredriksen T, Mauger S, Bindea G, Berger A, Bruneval P, Fridman WH, Pagès F, Galon J. Clinical impact of different classes of infiltrating T cytotoxic and helper cells (Th1, th2, treg, th17) in patients with colorectal cancer. Cancer Res. 2011;71:1263–1271. doi: 10.1158/0008-5472.CAN-10-2907. [DOI] [PubMed] [Google Scholar]
- 44.Loose D, Van de Wiele C. The immune system and cancer. Cancer Biother Radiopharm. 2009;24:369–376. doi: 10.1089/cbr.2008.0593. [DOI] [PubMed] [Google Scholar]
- 45.Kumar S, Saini RV, Mahindroo N. Recent advances in cancer immunology and immunology-based anticancer therapies. Biomed Pharmacother. 2017;96:1491–1500. doi: 10.1016/j.biopha.2017.11.126. [DOI] [PubMed] [Google Scholar]
- 46.Wheatley SP, Altieri DC. Survivin at a glance. J Cell Sci. 2019;132:jcs223826. doi: 10.1242/jcs.223826. [DOI] [PMC free article] [PubMed] [Google Scholar]
- 47.Cao L, Li C, Shen S, Yan Y, Ji W, Wang J, Qian H, Jiang X, Li Z, Wu M, Zhang Y, Su C. OCT4 increases BIRC5 and CCND1 expression and promotes cancer progression in hepatocellular carcinoma. BMC Cancer. 2013;13:82. doi: 10.1186/1471-2407-13-82. [DOI] [PMC free article] [PubMed] [Google Scholar]
- 48.Ozen M, Ittmann M. Increased expression and activity of CDC25C phosphatase and an alternatively spliced variant in prostate cancer. Clin Cancer Res. 2005;11:4701–4706. doi: 10.1158/1078-0432.CCR-04-2551. [DOI] [PubMed] [Google Scholar]
- 49.Law CT, Wei L, Tsang FH, Chan CY, Xu IM, Lai RK, Ho DW, Lee JM, Wong CC, Ng IO, Wong CM. HELLS regulates chromatin remodeling and epigenetic silencing of multiple tumor suppressor genes in human hepatocellular carcinoma. Hepatology. 2019;69:2013–2030. doi: 10.1002/hep.30414. [DOI] [PubMed] [Google Scholar]
- 50.Wang W, Yin Q, Guo S, Wang J. Contributes toward the carcinogenesis of liver cancer and regulates PI3K/Akt/mTOR signaling. Exp Ther Med. 2021;22:1053. doi: 10.3892/etm.2021.10487. [DOI] [PMC free article] [PubMed] [Google Scholar]
- 51.Si T, Huang Z, Jiang Y, Walker-Jacobs A, Gill S, Hegarty R, Hamza M, Khorsandi SE, Jassem W, Heaton N, Ma Y. Expression levels of three key genes CCNB1, CDC20, and CENPF in HCC are associated with antitumor immunity. Front Oncol. 2021;11:738841. doi: 10.3389/fonc.2021.738841. [DOI] [PMC free article] [PubMed] [Google Scholar]


