

Abstract
Background
The repulsive guidance molecule a (RGMa) is a GPI-anchor axon guidance molecule first found to play important roles during neuronal development. RGMa expression patterns and signaling pathways via Neogenin and/or as BMP coreceptors indicated that this axon guidance molecule could also be working in other processes and diseases, including during myogenesis. Previous works from our research group have consistently shown that RGMa is expressed in skeletal muscle cells and that its overexpression induces both nuclei accretion and hypertrophy in muscle cell lineages. However, the cellular components and molecular mechanisms induced by RGMa during the differentiation of skeletal muscle cells are poorly understood. In this work, the global transcription expression profile of RGMa-treated C2C12 myoblasts during the differentiation stage, obtained by RNA-seq, were reported.
Results
RGMa treatment could modulate the expression pattern of 2,195 transcripts in C2C12 skeletal muscle, with 943 upregulated and 1,252 downregulated. Among them, RGMa interfered with the expression of several RNA types, including categories related to the regulation of RNA splicing and degradation. The data also suggested that nuclei accretion induced by RGMa could be due to their capacity to induce the expression of transcripts related to ‘adherens junsctions’ and ‘extracellular-cell adhesion’, while RGMa effects on muscle hypertrophy might be due to (i) the activation of the mTOR-Akt independent axis and (ii) the regulation of the expression of transcripts related to atrophy. Finally, RGMa induced the expression of transcripts that encode skeletal muscle structural proteins, especially from sarcolemma and also those associated with striated muscle cell differentiation.
Conclusions
These results provide comprehensive knowledge of skeletal muscle transcript changes and pathways in response to RGMa.
Supplementary Information
The online version contains supplementary material available at 10.1186/s12864-022-08396-w.
Keywords: Axon Guidance, Myogenesis, Hypertrophy, Hyperplasia, Skeletal muscle differentiation, Transcriptomic analysis
Background
Repulsive guidance molecule a (RGMa) comprises the first repulsive glycoprotein member identified in the family of repulsive guidance molecules [1]. It was originally identified as a repulsive clue in the orientation of axonal growth in the central and peripheral nervous system and as an important target for neuronal survival [1–4] However, RGMa action domains were found to go beyond the processes related to neurogenesis and could be extended to different processes, including the induction of endochondral ossification during skeletal development [5], the suppression of endothelial tube formation [6], and inflammatory responses [7, 8].
These diverse functions can be performed by RGMa because it can signal through different receptors and work as a modular protein. The RGMa C-terminal domain (C-RGMa) harbours a GPI-anchor and presents affinity to the type I transmembrane neogenin receptor [9, 10], which is known as a guidance receptor for migrating neuronal and mesodermal cells [11–13]. This domain also harbours a von Willibrand type D structural domain, containing a GDPH autocatalytic site [14]. The RGMa N-terminal domain (N-RGMa) harbours a signal peptide, an additional neogenin-binding site, and an RGD motif, that is known to be important in cell–cell adhesion processes mediated by integrins [15]. However, RGMa signaling through integrins has not been reported thus far. Notably, N-RGMa presents high affinity to bone morphogenetic proteins (BMP) ligands, making RGMa (and all the members of this family) a modulator of this important signaling pathway [16–19]. N-RGMa shares the same binding site on the BMP ligand with the ectodomain of the BMP type I receptor A (BMP-R1A), meaning that RGM can induce the BMP canonical signaling pathway via activation of Smad 1/5/8. RGMa could also integrate neogenin and BMP signaling cascades [5, 20–22]. Finally, RGMa was recently found to promote astrogliosis and glial scar formation in a rat model of middle cerebral artery occlusion/reperfusion by forming a complex with ALK5 and Smad2/3, which are the main members of the transforming growth factor β1 (TGFβ1) signaling pathway [23].
In previous works, we found RGMa transcripts in the myogenic and satellite cell precursors in the somites during chicken embryonic development [24] and at the sarcolemma and in the sarcoplasm of adult mice muscle cells [25]. RGMa overexpression in C2C12 cells induced the formation of larger myotubes (hypertrophy) with an increased number of myonuclei (nuclei accretion), while its knockdown resulted in the appearance of smaller cells, with a deficient ability to form multinucleated myotubes [25].
Skeletal muscle cell size is known to be determined by the balance between protein and cellular turnover [26–28]. Because of cellular turnover, the skeletal muscle cell grows by myonuclei accretion, in a process mediated by cell fusion. The increase of myonuclei into myofibers leads to muscle mass expansion due to the higher rate of transcription given the nuclear turnover [29]. Muscle nuclei accretion is important not only during embryonic development but also during muscle regeneration [29–36]. In contrast, because of protein turnover, the skeletal muscle cell grows by upregulating protein synthesis pathways, consequently increasing the level of protein within the muscle tissue [27, 29]. Although hypertrophy and nuclei accretion are two distinct processes, they frequently occur together [36], and not all signals involved during the proliferation and differentiation of skeletal musculature are known.
Despite having found that RGMa can induce hypertrophy and nuclear accretion in skeletal muscle cells cultivated in vitro, the molecular mechanisms that are induced by this axon guidance molecule in these particular cells have not been investigated thus far. Our hypothesis is that RGMa can modulate the expression of a number of transcripts in skeletal muscle cells, especially those involved with nuclei accretion and striated muscle cell differentiation. In this work, C2C12 cells were treated with RGMa recombinant protein to investigate the molecular mechanisms that are modulated by this axon guidance molecule during myogenic differentiation. This was the first work to show, through RNA-seq analysis, the transcript targets and molecular profile triggered by RGMa during skeletal muscle differentiation and its possible involvement in multiple functions, including cell fusion and hypertrophy.
Results
Overview of the RNA-seq data and differentially expressed transcripts (DETs)
The quality of the generated sequence database was first evaluated to verify the internal consistency and reproducibility of the replicate samples, as well as the disparity among them. The Pearson correlation coefficient (PCC) of the normalized read-counts revealed a perfect positive linear correlation between all RGMa-treated samples and an extremely strong correlation among the control ones (Fig. 1A). The analysis also revealed a subtle difference between treated and control samples, as there was a positive linear correlation showing Pearson r coefficients above 0.97 among all correlated samples (Fig. 1B). MA-plot analysis revealed that RGMa treatment modulated gene expression in skeletal muscle cells, with very few of them presenting a drastic effect (Fig. 1C).
Fig. 1.

Quality and transcriptomic profile of RGMa-treated myoblasts during myogenic differentiation. A Experimental design. B Pearson Correlation Coefficient (PCC) analysis of normalized read-counts denoted a high internal consistency and reproducibility of treated and control replicates. C MA plot analysis showing the RNA-seq profile of the log2 (fold change) distributions of all DETs in the average of normalised counts. Each point represents one transcript. Those dots marked in blue were detected as differentially expressed at a 5% FDR with log2(FC) > 0 (upregulated) and log2(FC) < 0 (downregulated) after RGMa treatment. Transcripts with similar expression levels are represented around the horizontal line (y = 0). Dots that are outside the window are plotted as triangles. D Heatmap analysis of DET with muscle-associated terms (‘cellular component,’ ‘biological process,’ and ‘molecular function’) of Gene Ontology (GO). Transcripts with the lowest expression values are marked in red, median expression values in black, and the highest expression values in green
The expression of 23,855 transcripts could be detected after normalization, and 2,195 were found as differentially expressed transcripts (DETs, p < 0.05, Fig. 1B, grey dots), with 943 upregulated and 1,252 downregulated by RGMa treatment compared to the control (Fig. 1C, blue dots with Log2(FC) > 0 and Log2(FC) < 0, respectively). Twenty-six DETs were exclusively expressed in RGMa-treated myoblasts, and 79 DETs had their expression drastically altered by the treatment (Supplementary Table 1). Differential expression analysis was also performed in gene level. We found that RGMa could modulate the expression of 1,788 genes (DEGs, p < 0.05, Supplementary Table 2). From the 2,195 DETs, 1,091 were also found as DEGs, meaning that 1,104 (~ 50%) were found as differentially expressed only at the transcription level.
The most drastic effects among the DETs were also observed as a heatmap of transcripts with enriched muscle-associated terms (Fig. 1D). The heatmap also allowed the observation that the expression of the majority of the transcripts did not change considerably between the control and treated samples. The 20 most upregulated and 20 most downregulated transcripts by RGMa treatment in C2C12 cells are shown in Table 1.
Table 1.
The most drastically altered transcripts in RGMa-treated C2C12 myoblast, during myogenic differentiation
| Transcripts most downregulated by RGMa | Transcripts most upregulated by RGMa | ||||
|---|---|---|---|---|---|
| Ensembl Transcript Access | Trancript name | log2(FC) < 0 | Ensembl Transcript Access | Trancript name | log2(FC) > 0 |
| ENSMUST00000113926.7 | Zfx-203 | -12,09,700,663 | ENSMUST00000160260.8 | Pou2f1-208 | 11,86,541,962 |
| ENSMUST00000187142.1 | Zfp469-202 | -11,6,517,089 | ENSMUST00000075836.11 | Dock7-202 | 11,30,650,103 |
| ENSMUST00000111427.8 | Pou2f1-205 | -11,58,532,487 | ENSMUST00000182593.7 | Prrc2c-209 | 11,18,773,896 |
| ENSMUST00000113870.2 | Tsc1-204 | -11,08,073,619 | ENSMUST00000182155.7 | Ank3-210 | 10,39,693,989 |
| ENSMUST00000169353.2 | Kifc3-202 | -10,96,464,702 | ENSMUST00000040711.14 | Nrap-201 | 10,01,424,135 |
| ENSMUST00000177916.7 | Zfp131-201 | -10,66,135,536 | ENSMUST00000106643.7 | Parva-203 | 9,856,496,026 |
| ENSMUST00000134230.7 | Hnrnph1-211 | -10,61,576,893 | ENSMUST00000155282.8 | Myo5a-214 | 9,842,528,635 |
| ENSMUST00000107857.10 | Ap2a1-202 | -10,25,950,022 | ENSMUST00000097864.8 | Pum1-203 | 9,697,390,548 |
| ENSMUST00000194801.5 | Rbm5-224 | -10,17,739,189 | ENSMUST00000212451.1 | Mau2-206 | 9,650,005,064 |
| ENSMUST00000132947.1 | Pds5b-204 | -9,920,365,984 | ENSMUST00000217647.1 | Scaper-205 | 9,631,678,893 |
| ENSMUST00000154403.7 | Polg-214 | -9,869,641,974 | ENSMUST00000212100.1 | Iqsec1-210 | 9,270,515,836 |
| ENSMUST00000170647.1 | Tnpo3-209 | -9,791,146,902 | ENSMUST00000039892.8 | Tbc1d25-201 | 9,251,526,431 |
| ENSMUST00000231973.1 | D16Ertd472e-205 | -9,770,163,529 | ENSMUST00000183148.7 | Ank3-239 | 9,209,545,896 |
| ENSMUST00000095037.1 | Whrn-204 | -9,756,960,752 | ENSMUST00000163483.1 | Rab1a-206 | 9,145,085,159 |
| ENSMUST00000208730.1 | Picalm-212 | -9,589,780,073 | ENSMUST00000230614.1 | Acap2-203 | 9,047,789,318 |
| ENSMUST00000066986.12 | Zfp142-202 | -9,460,284,761 | ENSMUST00000171937.1 | Arhgap35-202 | 6,619,772,687 |
| ENSMUST00000222395.1 | Atg2b-205 | -9,411,773,318 | ENSMUST00000205765.1 | Crebbp-205 | 6,563,438,613 |
| ENSMUST00000150905.1 | Htra1-204 | -9,363,035,965 | ENSMUST00000224799.1 | Spire1-207 | 5,741,134,073 |
| ENSMUST00000092614.8 | Pcgf1-201 | -9,362,877,176 | ENSMUST00000098816.9 | Slc7a2-202 | 4,478,565,603 |
| ENSMUST00000216284.1 | Cep164-207 | -4,150,389,783 | ENSMUST00000194877.5 | Ints7-206 | 4,424,334,603 |
The twenty most highly downregulated (Log2(Fold Change) < 0) and twenty most highly upregulated (Log2(Fold Change) > 0) Differentially Expression Transcripts (DET—with a false discovery rate (FDR) < 0,05) modulated in C2C12 cells treated with RGMa during differentiation. Access number and transcript name identified in the Ensembl database; log2(FD) < 0 corresponds to the fold change of the downregulation and log2(FD) > 0, of the upregulation of each transcript after RGMa treatment
The most highly upregulated DET induced by RGMa treatment was the Pou2F1 transcription factor (isoform Pou2F1-208, ENSMUST00000160260.9), also known as Oct-1 (Table 1). Among the other highly expressed genes, RGMa was able to induce the expression of genes related to skeletal muscle structure, including sarcomere and costamere organization (e.g., Ank3, Nrap and Parva), vesicle formation and trafficking (e.g., Myo5a, Iqsec1, Tbc1d25, Acap and Rab1a), and control of the cell cycle (Mau2 and Scaper).
Notably, another isoform of the Pou2F1 transcription factor (Pou2F1-205, ENSMUST00000111427.9) was found to be one of the most downregulated genes by RGMa treatment (Table 1).
Among the others, the downregulation of genes from the same categories included those associated with regulators of muscle mass and structure, such as Tsc1 and Tnpo3, with the formation of clathrin-coated vesicles (Ap2a1, and Picalm), and with cell cycle progression and apoptosis (Pcgf1, Kifc3 and Cep164) (Table 1).
RNA categories among DET
Given the reliability of the transcriptome data, we next classified all 2,195 DETs by RNA biotypes to determine which were the main RNA categories influenced by RGMa treatment. Among the 1,252 DETs that were found to be downregulated, 917 (73.2%) were protein coding, 246 (19.6%) were processed transcripts, 67 (5.35%) were NMDs, and 22 (1.75%) were pseudogenes (Fig. 2). Among the 943 upregulated DETs, 786 (83.3%) were protein coding, 115 (12.2%) were processed transcripts, 36 (3.8%) were NMDs, 5 (0.5%) were pseudogenes, and 1 (0.1%) was a TEC (Fig. 2). Overall, this data revealed that most of the RNA biotypes that were modulated by RGMa treatment were ORF-containing RNAs, while the remaining were composed of RNAs mainly associated with the regulation of gene expression, including the NMD category, which was composed of transcripts containing a premature stop codon, and processed transcripts, a category composed of lncRNA, ncRNA, antisense, and intron-retained RNAs.
Fig. 2.
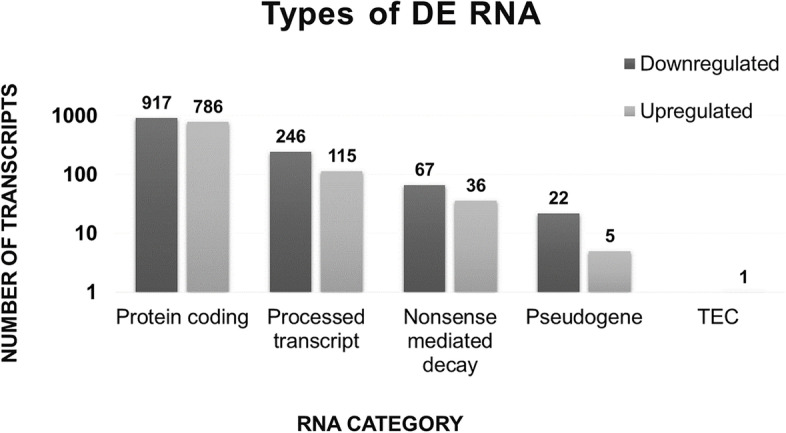
RNA biotypes modulated by RGMa treatment. RGMa could modulate the differential expression of 13 RNA biotypes, classified in six RNA categories according to Ensembl (https://m.ensembl.org/info/genome/genebuild/biotypes.html): (1) protein coding, (2) processed transcripts (lncRNA: antisense, bidirection-promoter-lncRNA, lincRNA, retained intron and ncRNA: snRNA and Mt-rRNA), (3) nonsense mediated decay, (4) pseudogenes (processed-pseudogenes, transcribed-processed-pseudogene, and unprocessed-pseudogene), and (5) Tec (to be experimentally confirmed)
GO pathway enrichment analysis of the non-coding RNA found as DETs
The non-coding RNA found as DETs that were upregulated by RGMa treatment were mostly involved with the ‘regulation of RNA splicing,’ ‘stress fibre,’ ‘myoblast fusion,’ and ‘integrin binding’ (Fig. 3A), while ‘regulation of RNA transport’ and ‘peptide biosynthetic process’ were enriched among the downregulated non-coding DETs (Fig. 3B).
Fig. 3.

Functional analysis of the non-protein coding RNA differentially regulated by RGMa treatment. For this analysis, we considered upregulated DETs that do not encode proteins. Pie analysis of the GO enrichment, showing the most frequent terms, including cellular component, biological process, molecular function, and immune system process, and KEGG GO terms that were A upregulated and B downregulated. The right-sided hypergeometric test was used in statistical inference, and the Benjamini–Hochberg method was applied for a p-value correlation (p < 0.05). The analysis was conducted using the plugin ClueGO (v.2.5.4) for Cytoscape (v3.7.1)
GO pathway enrichment analysis of the protein coding RNA found as DETs
DETs were characterized based on the Gene Ontology (GO) terms to identify the pathways that were enriched among the up- and downregulated transcripts. The enriched GO terms for the protein coding upregulated DETs were mostly related to the following biological processes: ‘morphogenesis,’ ‘metabolism,’ and ‘developmental regulation of muscle cell’ (Fig. 4A). Related to the cellular components, RGMa treatment could induce the upregulation of transcripts associated with ‘cytoskeleton,’ ‘cell projection,’ ‘endomembrane system,’ ‘adherens junction,’ ‘nucleus,’ and ‘nucleoplasm’ (Fig. 4B); and related to molecular function, transcripts were grouped as ‘nucleic acid binding,’ ‘transcription factor binding,’ and ‘regulation of GTPase’ and ‘Ras GTPase activity’ (Fig. 4C).
Fig. 4.

Functional analysis of the protein coding RNA upregulated by RGMa. For this analysis, we considered the DETs that encode proteins that were found to be upregulated (FC > 1) by the treatment with RGMa, compared to the control. A-C Pie chart analysis of the three GO categories used to classify the upregulated protein coding transcripts. The right-sided hypergeometric test was used in statistical inference, and the Benjamini–Hochberg method was applied for a p-value correlation (p < 0.0001). The analysis was conducted using the plugin ClueGO (v.2.5.4) for Cytoscape (v3.7.1)
A different pattern was found with the classification of the protein coding downregulated DETs; terms related to ‘metabolism’ and ‘tissue survival’ were the most downregulated after RGMa treatment. ‘Purine nucleoside triphosphate metabolic process,’ ‘peptide biosynthetic process,’ ‘translation,’ and ‘positive regulation of apoptotic signaling pathway’ were the most enriched terms of biological processes (Fig. 5A). Cellular components were mostly associated with ‘mitochondria protein complex,’ ‘actin cytoskeleton,’ ‘cytosolic ribosome,’ ‘proteasome complex,’ and ‘vesicle coat’ (Fig. 5B), while those found to be associated with molecular function were grouped in ‘activity of nucleoside-triphosphatase,’ ‘ATPase,’ and ‘positive regulation of catalysis’ categories (Fig. 5C).
Fig. 5.

Functional analysis of the protein coding RNA downregulated by RGMa. For this analysis, we considered the DETs that encode proteins and were found to be downregulated (FC < 1) in the RGMa treated group, compared to the control one. A-C Pie chart analysis of the three GO categories for downregulated DETs. D Functionally grouped network of enriched categories for expressed transcripts, annotated for ‘biological process,’ ‘cellular component,’ and ‘molecular function’ GO terms. The right-sided hypergeometric test was used in statistical inference, and the Benjamini–Hochberg method was applied for a p-value correlation (p < 0.001). The analysis was conducted using the plugin ClueGO (v.2.5.4) for Cytoscape (v3.7.1)
Cell adhesion and hypertrophy-associated terms
We selected GO terms associated with “cell adhesion” and with “skeletal muscle structure” and “hypertrophy”, from both up and downregulated DETs, for a network analysis (Fig. 6).
Fig. 6.

Muclei accretion and muscle-related enriched terms from the functional analysis of all DETs in response to RGMa. GO enrichment and the network analysis of DETs was performed using the software ClueGO. Terms were selected for network analysis related to nuclei accretion A and to muscle differentiation and structure B. The right-sided hypergeometric test was used in statistical inference, and the Benjamini–Hochberg method was applied for a p-value correlation (p < 0.001). The network was designed using the ForceAtlas2 algorithm and node size represents network centrality which was calculated using Eigenvector Centrality algorithm
Our analysis revealed a number of upregulated transcripts were associated with GO terms including ‘adherens junctions’, ‘cell-substrate adherens junction’, ‘adherens junction assembly’ and ‘adherens junction organization’, ‘cell-substrate junction assembly’, ‘regulation of cell adhesion’, ‘extracellular matrix organization’, ‘collagen-containing extracellular matrix’; while downregulated transcripts were mainly associated with ‘Focal adhesion’, ‘regulation of cell-substrate adhesion’, ‘cell-substrate adhesion’, ‘cell–matrix adhesion’ and ‘tight junction’ (Fig. 6A).
Related to muscle term, we could find upregulated transcripts associated with GO terms including ‘contractile fiber part’, ‘muscle cell differentiation’ and ‘striated muscle cell differentiation’; while the transcripts found as downregulated were mostly associated with the following GO terms: ‘sarcomere’, ‘Z disk’, ‘I band’, ‘myofibril’, ‘contractile fiber’, ‘myofilament’, ‘striated muscle thin filament’, ‘troponin complex’, ‘actin cytoskeleton’, ‘contractile actin filament bundle’, ‘stress fiber’, among others (Fig. 6B).
RNA-seq validation
We chose 12 DET isoforms to validate our RNA-seq data and analysis by qPCR. Arhgap35-202 and 201, Hipk2-206, Mef2d-202, 204 and 203, mTOR-202, Myh9-201, Myo5a-214, Nfat5-206, 208 and 214, Parva-203, and Pou2f1-208 were selected from the upregulated DETs isoforms, and Cep164-170, Kifc3-202 and Pcgf1-201 isoforms were chosen from the downregulated ones. The qPCR results showed a total concordance with the RNA-seq analysis (Fig. 7).
Fig. 7.
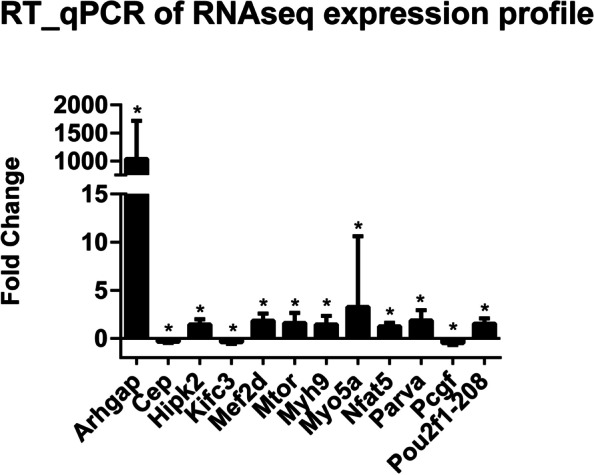
Validation of the RNA-seq expression profiles by qPCR. A subset of twelve DETs that were upregulated and downregulated by RGMa treatment during muscle differentiation were used to validate the obtained RNA-seq expression data. Transcripts were selected by their expression and their known association with muscle hyperplasic or hypertrophic phenotypes. Expression patterns indicate agreement between the two methods and *, significance of p-adj < 0.05
Discussion
Although originally identified as a guidance clue for axonal growth, RGMa has been identified as playing roles in a number of different biological processes, including during myogenesis. RGMa transcripts could be found in chicken somites at the origin site of the muscle and satellite cell precursors [24]. In adult muscle, RGMa was found in regions of the sarcolemma and sarcoplasm, with an expression pattern similar to sarcomeric proteins [25]. Initial functional studies revealed that RGMa can induce myonuclear accretion and hypertrophy of myotubes, suggesting that this axon guidance molecule might be involved with the mechanisms that modulate skeletal muscle cell size [25].
However, the molecular mechanisms induced by RGMa during these important muscle phenotypes have not been clarified thus far. RGMa exerts its canonical effects through the type-I transmembrane neogenin receptor [6, 7, 9, 37], but it can also work as a bone morphogenetic protein (BMP) co-receptor, as it shares the same binding site in BMP-R1A with BMP ligands [15]. Notably, both signaling pathways seem to be active in skeletal muscle cells, inducing similar phenotypes in controlling the cell size, but these effects were never investigated in the context of having RGMa as a possible ligand. Using RGMa recombinant proteins in C2C12 cells, we could not clearly elucidate if RGMa effects were induced via neogenin and/or BMP signaling pathways, possibly because these receptors do not have RGMa as an exclusive ligand [38]. For this reason, in this work, the transcriptome of C2C12 cells was sequenced after being treated with RGMa recombinant protein during the late differentiation stage to detect the transcripts that had their expression modulated by this axon guidance molecule during the differentiation of skeletal muscle cells.
A database composed of 23,856 transcripts expressed during C2C12 differentiation was generated. Sequenced biological triplicates from treated and control groups were found to be homogeneous, conferring internal consistency and reproducibility of replicate samples. Three technical replicates are considered a sufficient for a reliable quantitative inferential analysis [39]. From these expressed transcripts, 2,195 were modulated by RGMa treatment, with 943 upregulated and 1,252 downregulated.
From this database, it was noted that RGMa was able to modulate the expression of five RNA biotypes. The most frequent RNA biotype modulated by RGMa was ‘protein coding,’ which included ORF containing transcripts. However, a significant portion of DETs were included in categories involved with the regulation of gene expression, including in the ‘nonsense mediated decay’ (composed of transcripts with a premature stop codon) and ‘processed transcript’ (composed of ‘retained intron RNA’, ‘antisense’ and ‘ncRNA’) biotypes. According to Wong et al. (2013), a number of transcripts must be destroyed to permit developmental transitions during differentiation [40]. Therefore, this data suggests that RGMa treatment induced the regulation of the genes that were being expressed during the differentiation stages using these particular molecular mechanisms, allowing the adaptation of these cells to reach terminal differentiation.
Additionally, our analysis also revealed that RGMa could differentially induce the expression of alternatively spliced transcripts. Pou2F1 (Pou Class 2 Homeobox 1, also known as Oct-1) isoforms were found to be the most upregulated DET (Pou2f1-208, ENSMUST00000160260.9), as well as the most downregulated DET (Pou2f1-205, ENSMUST00000111427.9) by RGMa treatment in skeletal muscle cells. Although the specific functions of each of these isoforms have not been described thus far, it is known that Pou2F1 is an ubiquitously expressed member of the Pou transcription factor family and is associated with a plethora of processes, including the activation of some snRNA, histone H2B, immunoglobulins, and other housekeeping genes [41], the regulation of the circadian clock [42], and glycolytic metabolism [43]. In skeletal muscle cells, this transcription factor was associated with the activation of pro-inflammatory immune response in patients with myalgia [44] and with MyHC IIB expression, when associated with MEF2 and the serum response factor (SRF) [45–47]. Pou2F1 was also identified on a slow skeletal muscle troponin I promoter in Gaoyou duck skeletal muscle [48]. In addition to Pou2F1, multiple isoforms for myoferlin (Myof), myosin heavy chain 10 (Myh10), myosin IXB (Myo9b), titin (Ttn), tensin 2 (Tns2), supervillain (Svil), and chromodomain helicase DNA binding protein 2 (Chd2) were also found as modulated by the RGMa treatment in C2C12 cells; these genes are of wide importance for development, differentiation, and maintenance of skeletal muscle cells.
RGMa treatment modulated the expression of muscle hypertrophic markers
The protein coding DETs were analyzed to determine how RGMa induces hypertrophic and nuclear accretion effects on skeletal muscle cells.
Our transcriptome database showed that RGMa induced the expression of the mammalian target of rapamycin (mTOR) transcript, which is a common factor from different pathways that culminate with skeletal muscle hypertrophy [27, 49–53]. RGMa could specifically induce mTOR transcript isoform 202 (ENSMUST00000103221.10), suggesting a new mechanism for this isoform in these cells. The effect of RGMa on mTOR expression was also confirmed by qPCR. mTOR exerts its effects as part of two complexes, termed mTORC1 and mTORC2. Increased mTORC1 activity can positively regulate muscle protein synthesis via S6K1 and also inhibit its negative regulation when working via 4EBP1 [27, 54]. TSC1, in a complex with TSC2, is responsible for the negative regulation of mTORC1 signaling, inhibiting the nutrient-mediated or growth factor-stimulated phosphorylation of S6K1 and 4EBP1 [53]. Furthermore, TSC1-204 (ENSMUST00000113870.3) was also highly downregulated by RGMa treatment in skeletal muscle cells. The inhibition of TSC1/2 protein synthesis resulted in rapid activation of mTORC1 signaling independent of Akt [53, 55]. The hypertrophic effects observed by RGMa treatment could then be a result of the inhibition of the TSC1 transcript and of the induction of mTOR expression, which are both crucial for muscle growth. Additionally, although the TSC1/2 complex is not physically associated with mTORC1, it is required for mTORC2 activation and consequently, for Akt phosphorylation, in a manner that is independent of its GTPase-activating protein activity toward Rheb [56]. Thus, the inhibition of TSC1 by RGMa suggests that RGMa simultaneously works to prevent mTORC2 activation. The fact that TSC1 inhibition contributes to mTORC1 activation independently of Akt, as well as to mTORC2 inhibition, resulting in the loss of Akt stimulation [55], might explain why Akt was not induced by RGMa in skeletal muscle cells. Our results suggest that mTOR upregulation in response to RGMa is independent of Akt phosphorylation.
Other factors associated with the mTORC pathway were also dysregulated by the RGMa treatment and could contribute to including this axon guidance molecule in an alternative muscle hypertrophic pathway. For example, RGMa could induce the expression of the phospholipase D1 (Pld1-202, ENSMUST00000120834.8) transcript, which was found to be an activator of mTORC1 [50, 57].
RGMa could also induce the upregulation of members of the Myocyte Enhancer Factor 2 (Mef2) family, specifically Mef2a-204 (ENSMUSG00000030557.17) and Mef2d-204 (ENSMUSG00000001419.17) isoforms. Mef2 transcription factors activate many muscle-specific growth factor-induced genes and regulate muscle cell differentiation and muscle embryonic development [58–60]. Mef2 can also act as a nodal point for remodeling programs in metabolic gene expression, fiber-type switching, and skeletal muscle regeneration [58, 59, 61]. Mef2a upregulation can also contribute to terminal differentiation and myoblast fusion, which is also consistent with the present GO term analysis and with the RGMa muscle phenotype [25, 38]. Mef2a, Mef2c, and Mef2d deleted in combination in satellite cells abolished skeletal muscle regeneration after cardiotoxin injury [59].
Our RNA-seq database suggested other hypertrophic mechanisms that could be regulated by RGMa treatment, including the upregulation of Sirtuin 1 (Sirt1), which is known to regulate protein degradation via FoxO inhibition [62]; the upregulation of Nos1, which interacts with Sirt1 [63]; or the downregulation of genes that promote muscle protein degradation, such as the activating transcription factor 4 (Atf4) [64, 65].
RGMa treatment also modulated the expression of genes associated with nuclei accretion
We have also searched for genes associated with myonuclear accretion that were modulated by RGMa treatment in C2C12 cells. Among these, cadherin2 (Cdh2, ENSMUST00000025166.13), integrin alpha-V (Itgav, ENSMUST00000141725.2), neural cell adhesion molecule (NCAM, ENSMUST00000166811.8), calcium voltage-gated channel subunit alpha1S (Cacna1s, ENSMUST00000112068.9), actinin alpha 1 (Actn1, ENSMUST00000167327.1), disabled homolog 2 (Dab2, ENSMUST00000080880.11), myoferlin (Myof, ENSMUST00000224560.1, ENSMUST00000041475.15, ENSMUST00000224518.1), the myosins Myo5a (ENSMUST00000155282.8, ENSMUST00000123128.7), Myo10 (ENSMUST00000022882.11, ENSMUST00000110457.7, ENSMUST00000125667.2), Myh9 (ENSMUST00000016771.12), Myh10 (ENSMUST00000102611.9) phosphatase, and actin regulator 4 (Phactr4, ENSMUST00000136711.1) were upregulated by RGMa treatment.
Myof, for example, is a member of the Ferlin protein family, highly expressed in myoblasts during the pre-fusion phase of differentiation and in myofibers, especially during regeneration after injury [66–68]. It is associated with fusion events and intracellular trafficking in muscle, including myoblast fusion, vesicle traffic, membrane repair, and endocytic recycling [69].
Myh9 and Myh10 are equally fundamental for the positive regulation of cell–cell adhesion and myoblast fusion [70]. Myh9 is known as non-muscle myosin heavy chain IIa (NMMHC-IIA), while Myh10 is the non-muscle myosin heavy chain IIb [71]. These myosins are expressed in most cell types, working as motor proteins in a variety of processes requiring contractile force, such as cytokinesis, cell migration, polarisation and adhesion, maintenance of cell shape, and signal transduction [72–74]. In skeletal muscle cells, non-muscle myosins drive myoblasts to align and fuse to form multinucleated myotubes [70, 75]. The knockdown of these myosins inhibit the change of the myoblast shape, interfering with cell–cell adhesion and fusion [70].
Dab2 plays an important role as a modulator of cell–cell interactions, as it is a clathrin adaptor and can mediate integrin signaling [76]. In the musculature, Dab2 was detected during early myogenic differentiation [77, 78]. Shang et al. (2020) showed that Dab2 expression is upregulated in C2C12 myoblast during the differentiation in myotubes, and its knockdown resulted in reduced myoblast fusion and fewer myotubes. Besides, Dab2 overexpression could enhance the myotube formation and also restore the myotube differentiation capacity of its knockdown [79].
The calcium voltage-gated channel subunit alpha1 S (Cacna1s-202, ENSMUST00000112068.10) encodes one of the five subunits of the L-type voltage-dependent calcium channel in skeletal muscle cells. In the musculature, calcium is generally related to muscle contraction and muscle relaxation [80–82]. However, the regulation of calcium influx into muscle cells plays a critical role in muscle differentiation [82, 83]. Intracellular calcium is able to regulate transcription factors necessary for myotube fusion [83, 84], while its reduction inhibits myoblast differentiation [85]. The upregulation of Cacna1s in response to RGMa treatment suggests an association with the regulation of intracellular calcium, which is important for the myoblast fusion process and myotube contraction.
Conclusion
The current work allowed us to unravel some molecular mechanisms that were altered in skeletal muscle cells after treatment with RGMa, especially those associated with muscle nuclei accretion and hypertrophy. Our analysis suggested that RGMa induced cell hypertrophy via (i) upregulation of hypertrophic markers, (ii) downregulation of inhibitors of hypertrophic pathways, (iii) downregulation of transcripts related to the positive regulation of muscle atrophy, and (iv) upregulation of transcripts that negatively regulate atrophy. At the same time, transcripts associated with known myoblast fusion pathways were also found to be modulated by RGMa, mainly those related to cell–cell adhesion pathways.
Our results provide comprehensive knowledge of skeletal muscle transcriptional changes and pathways in response to RGMa treatment.
Material and methods
Cell culture and differentiation
The lineage of immortalized mouse myoblasts C2C12 (ATCC® CRL1772™) was cultured at 37 °C and 5% CO2 in growth medium (GM), composed of DMEM (Dulbecco’s Modified Eagle’s Medium) with high glucose and L-glutamine (Gibco), supplemented with 10% fetal bovine serum (FBS, Gibco) and 1% penicillin, streptomycin, and amphotericin B solution (Gibco). Myogenic differentiation was induced in differentiation medium (DM), composed of DMEM, supplemented with 2% horse serum (Gibco) and 1% penicillin, streptomycin, and amphotericin B. For growth or differentiation conditions, the medium was replaced every 2 days.
RGMa recombinant protein treatment
C2C12 cells were seeded at 2 × 10⁴ cells per well in 24-well plates and cultivated in GM at 37 °C and 5% CO2. After reaching 90–100% confluency, cells were induced to differentiate in DM for 72 h (Fig. 1A). DM was then replaced with fasting medium (FM), composed of DMEM supplemented with 0.2% FBS, and cells were incubated at the same conditions for 3 h. Subsequently, C2C12 were treated with 50 ng/ml mouse RGMa recombinant protein (R&D Systems) in FM and incubated for an additional 48 h, as previously described [38]. The recombinant protein was omitted in the control samples.
Total RNA isolation and cDNA synthesis
Cells were harvested in TriReagent (Sigma Aldrich) as pools of three wells in triplicate. Total RNA isolation was performed according to the manufacturer's instructions. Sample integrity, purity, and concentration were evaluated by electrophoresis in 1% agarose gel and in NanoDrop® ND-1000 UV/Vis Spectrophotometer, respectively.
The quality of the total RNA was also evaluated in a Bioanalyzer (Agilent) before being submitted to sequencing. Values for RNA integrity number (RIN) ranging from 8 to 10 were considered suitable for RNA-seq.
RNA-seq library preparation and next-generation sequencing (NGS)
For cDNA library construction, 2 μg of total RNA were treated with 1U of DNaseI amplification grade (Invitrogen) and purified according to the TruSeq Stranded mRNA Sample Prep LS Protocol of Illumina (http://grcf.jhmi.edu/hts/protocols/mRNA-Seq_SamplePrep_1004898_D.pdf), using magnetic microspheres for messenger RNA separation. The purified mRNA was fragmented in Illumina buffer. Superscript III (Invitrogen) and oligo(dT) were used for reverse transcription of the first cDNA strand. The second strand was synthesized using the enzymes RNase H and DNA Polymerase I (Illumina). Molecule ends were treated with T4 DNA Polymerase and Klenow DNA Polymerase (Illumina), making them blunt. The 3’ end of the synthetized cDNA was phosphorylated with T4 PNK (Illumina) and adenylated with Klenow exo (Illumina). Adaptors were bound to cDNA ends, and the samples were purified and selected by size of 200 bp ± 25 bp after fractioning in agarose gel electrophoresis (QIAquick Gel Extraction Kit, QIAGEN). Purified cDNA was quantified by RT-qPCR using adaptor-specific oligonucleotides (Illumina).
Sequencing was performed using HiScanSQ (Illumina),—according to the manufacturer’s recommendations, and using the paired-end reads protocol. Each sample was sequenced until it reached around 34 million reads/library.
Mapping RNA-seq data
Transcript quantification analysis was performed based on Salmon (version 0.13.1), an open-source and freely-licensed software (available at https://github.com/COMBINE-lab/Salmon [86]). Raw reads were used as an input to quantify transcripts in mapping-based mode. The current version of the mouse transcriptome (available at https://www.gencodegenes.org/mouse/release_M20.html) was used as a reference, which includes all RNA categories used to classify the transcripts obtained in this work.
Statistical RNA-seq
Statistical analysis was performed using the DESeq2 package of R Bioconductor [87]. An adjusted p-value with a false discovery rate (FDR) correction (Benjamini and Hochberg, 1995) of 5% was calculated and used to control false-positive significance in transcript expression variation. Log2(fold change) > 0 and log2(fold change) < 0 were selected as the threshold to show an increase or decrease in transcript expression of treated groups relative to the control group.
Transcript expression pattern and RNA-seq quality analysis
Transcript-specific normalisation was performed to remove disparities in the base means correlations and to eliminate the noise of transcripts with low expression.
Normalised transcripts were plotted in MA form using the DESeq2 package to generate a scatter plot of log2 fold changes < 0 and > 0 versus the mean of normalised counts of transcripts, considering DE those with FDR < 0.05. The correlation of each sample and the clustering of the treated and control groups was performed by calculating the PCC of normalised read-counts.
Functional RNA-seq analysis
The GO enrichment and the network analysis of DETs was performed using the software ClueGO v.2.5.4 [88] and Gephi v 0.9.2 (https://ojs.aaai.org/index.php/ICWSM/article/view/13937). The right-sided hypergeometric test was used to identify overrepresented GO terms and the BenjaminiHochberg method was used for the correction of the p-values (p < 0.001). The Ensembl Transcript ID of the DETs was used as input for ClueGO analysis. Terms were selected for network analysis by related to nuclei accretion (Fig. 6A) and related to muscle differentiation and structure (Fig. 6B). The network was designed using the ForceAtlas2 algorithm and node size represents network centrality which was calculated using Eigenvector Centrality algorithm.
The heatmap graph was obtained using the D3Heatmap package (https://www.rdocumentation.org/packages/d3heatmap/versions/0.6.1.2), using ID ensemble transcripts as an input (of clue go output for muscle associated terms) and the correlated base mean expression.
Primer design and qPCR
qPCR was performed for the specific upregulated isoforms of Arhgap35-202 and 201, Hipk2-206, Mef2d-202, 204 and 203, mTOR-202, Myh9-201, Myo5a-214, Nfat5-206, 208 and 214, Parva-203, Pou2f1-208 and for the downregulated isoforms of Cep164-170, Kifc3-202 and Pcgf1-201, that were selected due to their importance for muscle phenotypes, as well as by their relevance between the more enriched terms.
The multiline interface (http://multalin.toulouse.inra.fr/multalin/) was used for the alignment of genes with some specific isoforms up and others downregulated by RGMa. The non-consensus sequences among them were selected to avoid undesired isoforms and the consensus ones were used to obtain an amplicon of up to 250 bp for the chosen isoforms. Primer 3.0 software was used for primer design. Manual primers were designed for small specific strings.
cDNA was synthesized using 1 μg of total RNA following the recommendations of the RevertAid™ H Minus First Strand cDNA Synthesis kit (Fermentas).
qPCR was performed in the Rotor-Gene RT-qPCR system (Qiagen), using the iTaq Universal Sybr Green Supermix (Bio Rad) and 0.4–0.8 μM of each primer for a final volume of 10 μl. GAPDH was used as a housekeeping gene. The analysis of differential gene expression was performed using REST 2009 (Relative Expression Software Tool, V.2.0.13) software via randomisation tests (Pair Wise Fixed Reallocation Randomisation Test) [89] with 95% significance.
Supplementary Information
Additional file1: Supplementary file 1. Differentially expressed transcripts modulated by RGMa treatment during the differentiation of C2C12 cells.
Additional file 2: Supplementary file 2. Differentially expressed genes modulated by RGMa treatment during the differentiation of C2C12 cell.
Acknowledgements
We wish to thank Professor Antonio Figueira from Centro de Energia Nuclear na Agricultura (CENA, Universidade de São Paulo, Piracicaba, Brazil) for supporting our laboratory.
Abbreviations
- 4EBP1
Ukaryotic Translation Initiation Factor 4E Binding Protein 1
- Acap
ArfGAP With Coiled-Coil, Ankyrin Repeat And PH Domains 1
- Actn1
Actinin alpha 1
- Akt
Serine/Threonine Kinase 1
- ALK5
Activin A Receptor Type II-Like Protein Kinase Of 53kD, also Known as Transforming Growth Factor Beta Receptor 1
- Ank3
Ankyrin 3
- Ap2a1
Adaptor Related Protein Complex 2 Subunit Alpha 1
- Arhgap-35
Rho GTPase Activating Protein 35
- Atf4
Activating transcription factor 4
- BMP
Bone Morphogenetic protein
- BMP-R1A
BMP type I receptor A
- C2C12
Immortalized Mouse Myoblast cell line
- Cacna1s
Calcium voltage-gated channel subunit alpha1S
- Cep164
Centrosomal Protein 164
- Cdh2
Cadherin2
- cDNA
Complementary DNA
- Chd2
Chromodomain helicase DNA binding protein 2
- C-RGMa
RGMa C-terminal domain
- Dab2
Disabled homolog 2
- DE
Differentially expressed
- DET
Differentially expressed transcripts
- DM
Differentiation medium
- DMEM
Dulbecco’s Modified Eagle’s Medium
- FBS
Fetal bovine serum
- FDR
False Discovery Rate
- FM
Fasting medium
- FoxO
Forkhead Box Protein O
- GDPH
Glyceraldehyde 3-phosphate dehydrogenase
- GM
Growth medium
- GO
Gene Ontology
- GPI-anchor
Glycosylphosphatidylinositol-anchor
- GTP
Nucleotide guanosine triphosphate
- Hipk2
Homeodomain Interacting Protein Kinase 2
- Iqsec1
IQ Motif And Sec7 Domain ArfGEF 1
- Itgav
Integrin alpha-V
- KEGG
Kyoto Encyclopedia of Genes and Genomes
- Kifc3
Kinesin Family Member C3
- lncRNA
Long non coding RNA
- Mau2
MAU2 Sister Chromatid Cohesion Factor
- Mef2
Myocyte Enhancer Factor 2
- mRNA
Messenger RNA
- mTOR
Mechanistic Target Of Rapamycin Kinase
- mTORC1/2
Mechanistic target of rapamycin complex 1/2
- Myh9
Myosin heavy chain 9
- Myh10
Myosin heavy chain 10
- Myof
Myoferlin
- Myhc IIB
Myosin heavy chain IIb
- Myo5a
Myosin VA
- NCAM
Neural cell adhesion molecule
- NCBI
National Center for Biotechnology Information
- ncRNA
Non coding RNA
- NGS
Next Generation Sequencing
- NMD
Nonsense Mediated Decay
- Nos1
Nitric Oxide Synthase 1
- Nrap
Nebulin Related Anchoring Protein
- N-RGMa
RGMa N-terminal domain
- Oct-1
Octamer-Binding Transcription Factor 1
- Oligo(dT)
Oligonucleotide (deoxythymine)
- ORF
Open reading frame
- Parva
Parvin Alpha
- PCC
Pearson correlation coefficient
- Pcgf1
Polycomb Group Ring Finger 1
- Phactr4
Phosphatase and actin regulator 4
- Picalm
Phosphatidylinositol Binding Clathrin Assembly Protein
- Pld1
Phospholipase D1
- Pou2F1
Octamer-Binding Transcription Factor-1, also known as Oct1
- Rab1a
RAB1A, Member RAS Oncogene Family
- Rac
Family Small GTPase 1
- RGD
Tripeptide Arg-Gly-Asp
- RGMa
Repulsive Guidance Molecule a
- Rho
Rhodopsin
- RIN
RNA integrity number
- RNA
Ribonucleic acid
- RNA-seq
RNA sequencing
- RT-qPCR
Quantitative reverse transcription polymerase chain reaction
- S6k1
Ribosomal Protein S6 Kinase B1
- Scaper
S-Phase Cyclin A Associated Protein In The ER, also known as Zinc Finger Protein 291
- Sirt1
Sirtuin
- Smad2/3
Mothers Against Decapentaplegic Homolog 2/3
- snRNA
Small nuclear RNA
- SRF
Serum response factor
- Svil
Supervillain
- T4 PNK
T4 Polynucleotide Kinase
- Tns2
Tensin2
- Ttn
Titin
- Tbc1d25
TBC1 Domain Family Member 25
- TEC
To be Experimentally Confirmed
- TGF β1
Transforming Growth Factor β1
- Tnpo3
Transportin 3
- Tsc1
Tuberous Sclerosis 1 Protein
- Tsc2
Tuberin
Authors’ contributions
For this research, AGLC and ECJ designed the study. AGLC, JMN, and ACC performed the in vitro and qPCR experiments. LLC generated the RNA-seq data, and LEDB, PHAC and IMCAC performed the bioinformatic analysis. AGLC and IGDS extracted the biological information of the expression data. AGLC and ECJ wrote the manuscript. ECJ supervised and administrated the study. GABS provided part of the funding acquisition and supervised experimental work. All authors have read and agreed to the published version of the manuscript.
Funding
This research was supported by the Coordenação de Aperfeiçoamento de Pessoal de Nível Superior (CAPES), the Conselho Nacional de Desenvolvimento Científico e Tecnológico (CNPq) and the Fundação de Amparo à Pesquisa do Estado de Minas Gerais (FAPEMIG). AGLC, ACC and JMN were financed by the Coordenação de Aperfeiçoamento de Pessoal de Nível Superior (CAPES), Finance Code 001. ECJ and LLC received a scholarship from CNPq.
Availability of data and materials
The raw transcriptome sequencing data (RNA-seq) from the technical replicates of C2C12 myoblast treated with RGMa are available under the NCBI-BioProject submission code PRJNA730936. The datasets supporting the conclusions of this article are included within the article and its additional files.
Declarations
Ethics approval and consent to participate
Not applicable.
Consent for publication
Not applicable.
Competing interests
The authors declare that they have no competing interests.
Footnotes
Publisher’s Note
Springer Nature remains neutral with regard to jurisdictional claims in published maps and institutional affiliations.
References
- 1.Monnier PP, Sierra A, Macchi P, Deitinghoff L, Andersen JS, Mann M, Flad M, Hornberger MR, Stahl B, Bonhoeffer F, et al. RGM is a repulsive guidance molecule for retinal axons. Nature. 2002;419(6905):392–395. doi: 10.1038/nature01041. [DOI] [PubMed] [Google Scholar]
- 2.Stahl B, Müller B, von Boxberg Y, Cox EC, Bonhoeffer F. Biochemical characterization of a putative axonal guidance molecule of the chick visual system. Neuron. 1990;5(5):735–743. doi: 10.1016/0896-6273(90)90227-7. [DOI] [PubMed] [Google Scholar]
- 3.Müller B, Jay D, Bonhoeffer F. Chromophore-assisted laser inactivation of a repulsive axonal guidance molecule. Curr Biol. 1996;6(11):1497–1502. doi: 10.1016/s0960-9822(96)00754-3. [DOI] [PubMed] [Google Scholar]
- 4.Siebold C, Yamashita T, Monnier PP, Mueller BK, Pasterkamp RJ. RGMs: structural insights, molecular regulation, and downstream signaling. Trends Cell Biol. 2017;27(5):365–378. doi: 10.1016/j.tcb.2016.11.009. [DOI] [PMC free article] [PubMed] [Google Scholar]
- 5.Zhou Z, Xie J, Lee D, Liu Y, Jung J, Zhou L, Xiong S, Mei L, Xiong WC. Neogenin regulation of BMP-induced canonical Smad signaling and endochondral bone formation. Dev Cell. 2010;19(1):90–102. doi: 10.1016/j.devcel.2010.06.016. [DOI] [PMC free article] [PubMed] [Google Scholar]
- 6.Harada K, Fujita Y, Yamashita T. Repulsive guidance molecule A suppresses angiogenesis. Biochem Biophys Res Commun. 2016;469(4):993–999. doi: 10.1016/j.bbrc.2015.12.073. [DOI] [PubMed] [Google Scholar]
- 7.Fujita Y, Yamashita T. The roles of RGMa-neogenin signaling in inflammation and angiogenesis. Inflamm Regen. 2017;37:6. doi: 10.1186/s41232-017-0037-6. [DOI] [PMC free article] [PubMed] [Google Scholar]
- 8.Nohra R, Beyeen AD, Guo JP, Khademi M, Sundqvist E, Hedreul MT, Sellebjerg F, Smestad C, Oturai AB, Harbo HF, et al. RGMA and IL21R show association with experimental inflammation and multiple sclerosis. Genes Immun. 2010;11(4):279–293. doi: 10.1038/gene.2009.111. [DOI] [PubMed] [Google Scholar]
- 9.Rajagopalan S, Deitinghoff L, Davis D, Conrad S, Skutella T, Chedotal A, Mueller BK, Strittmatter SM. Neogenin mediates the action of repulsive guidance molecule. Nat Cell Biol. 2004;6(8):756–762. doi: 10.1038/ncb1156. [DOI] [PubMed] [Google Scholar]
- 10.Itokazu T, Fujita Y, Takahashi R, Yamashita T. Identification of the neogenin-binding site on the repulsive guidance molecule A. PLoS One. 2012;7(3):e32791. doi: 10.1371/journal.pone.0032791. [DOI] [PMC free article] [PubMed] [Google Scholar]
- 11.Fitzgerald DP, Seaman C, Cooper HM. Localization of Neogenin protein during morphogenesis in the mouse embryo. Dev Dyn. 2006;235(6):1720–1725. doi: 10.1002/dvdy.20744. [DOI] [PubMed] [Google Scholar]
- 12.Fitzgerald DP, Cole SJ, Hammond A, Seaman C, Cooper HM. Characterization of neogenin-expressing neural progenitor populations and migrating neuroblasts in the embryonic mouse forebrain. Neuroscience. 2006;142(3):703–716. doi: 10.1016/j.neuroscience.2006.06.041. [DOI] [PubMed] [Google Scholar]
- 13.Cole SJ, Bradford D, Cooper HM. Neogenin: A multi-functional receptor regulating diverse developmental processes. Int J Biochem Cell Biol. 2007;39(9):1569–1575. doi: 10.1016/j.biocel.2006.11.009. [DOI] [PubMed] [Google Scholar]
- 14.Bell CH, Healey E, van Erp S, Bishop B, Tang C, Gilbert RJC, Aricescu AR, Pasterkamp RJ, Siebold C. Structure of the repulsive guidance molecule (RGM)-neogenin signaling hub. Science. 2013;341(6141):77–80. doi: 10.1126/science.1232322. [DOI] [PMC free article] [PubMed] [Google Scholar]
- 15.Healey EG, Bishop B, Elegheert J, Bell CH, Padilla-Parra S, Siebold C. Repulsive guidance molecule is a structural bridge between neogenin and bone morphogenetic protein. Nat Struct Mol Biol. 2015;22(6):458–465. doi: 10.1038/nsmb.3016. [DOI] [PMC free article] [PubMed] [Google Scholar]
- 16.Babitt JL, Zhang Y, Samad TA, Xia Y, Tang J, Campagna JA, Schneyer AL, Woolf CJ, Lin HY. Repulsive guidance molecule (RGMa), a DRAGON homologue, is a bone morphogenetic protein co-receptor. J Biol Chem. 2005;280(33):29820–29827. doi: 10.1074/jbc.M503511200. [DOI] [PubMed] [Google Scholar]
- 17.Samad TA, Rebbapragada A, Bell E, Zhang Y, Sidis Y, Jeong SJ, Campagna JA, Perusini S, Fabrizio DA, Schneyer AL, et al. DRAGON, a bone morphogenetic protein co-receptor. J Biol Chem. 2005;280(14):14122–14129. doi: 10.1074/jbc.M410034200. [DOI] [PubMed] [Google Scholar]
- 18.Babitt JL, Huang FW, Wrighting DM, Xia Y, Sidis Y, Samad TA, Campagna JA, Chung RT, Schneyer AL, Woolf CJ, et al. Bone morphogenetic protein signaling by hemojuvelin regulates hepcidin expression. Nat Genet. 2006;38(5):531–539. doi: 10.1038/ng1777. [DOI] [PubMed] [Google Scholar]
- 19.Corradini E, Babitt JL, Lin HY. The RGM/DRAGON family of BMP co-receptors. Cytokine Growth Factor Rev. 2009;20(5–6):389–398. doi: 10.1016/j.cytogfr.2009.10.008. [DOI] [PMC free article] [PubMed] [Google Scholar]
- 20.Zhang AS, West AP, Jr, Wyman AE, Bjorkman PJ, Enns CA. Interaction of hemojuvelin with neogenin results in iron accumulation in human embryonic kidney 293 cells. J Biol Chem. 2005;280(40):33885–33894. doi: 10.1074/jbc.M506207200. [DOI] [PubMed] [Google Scholar]
- 21.Zhang AS, Yang F, Wang J, Tsukamoto H, Enns CA. Hemojuvelin-neogenin interaction is required for bone morphogenic protein-4-induced hepcidin expression. J Biol Chem. 2009;284(34):22580–22589. doi: 10.1074/jbc.M109.027318. [DOI] [PMC free article] [PubMed] [Google Scholar]
- 22.Tian C, Liu J. Repulsive guidance molecules (RGMs) and neogenin in bone morphogenetic protein (BMP) signaling. Mol Reprod Dev. 2013;80(9):700–717. doi: 10.1002/mrd.22199. [DOI] [PMC free article] [PubMed] [Google Scholar]
- 23.Zhang R, Wu Y, Xie F, Zhong Y, Wang Y, Xu M, Feng J, Charish J, Monnier PP, Qin X. RGMa mediates reactive astrogliosis and glial scar formation through TGFbeta1/Smad2/3 signaling after stroke. Cell Death Differ. 2018;25(8):1503–1516. doi: 10.1038/s41418-018-0058-y. [DOI] [PMC free article] [PubMed] [Google Scholar]
- 24.Jorge EC, Ahmed MU, Bothe I, Coutinho LL, Dietrich S. RGMa and RGMb expression pattern during chicken development suggest unexpected roles for these repulsive guidance molecules in notochord formation, somitogenesis, and myogenesis. Dev Dyn. 2012;241(12):1886–1900. doi: 10.1002/dvdy.23889. [DOI] [PubMed] [Google Scholar]
- 25.Martins AF, Xavier Neto J, Azambuja A, Sereno ML, Figueira A, Campos-Junior PH, Rosario MF, Toledo CB, Silva GA, Kitten GT, et al. Repulsive Guidance Molecules a, b and c Are Skeletal Muscle Proteins, and Repulsive Guidance Molecule a Promotes Cellular Hypertrophy and Is Necessary for Myotube Fusion. Cells Tissues Organs. 2015;200(5):326–338. doi: 10.1159/000433491. [DOI] [PubMed] [Google Scholar]
- 26.Sartorelli V, Fulco M. Molecular and cellular determinants of skeletal muscle atrophy and hypertrophy. Sci STKE. 2004;2004(244):re11. doi: 10.1126/stke.2442004re11. [DOI] [PubMed] [Google Scholar]
- 27.Bonaldo P, Sandri M. Cellular and molecular mechanisms of muscle atrophy. Dis Model Mech. 2013;6(1):25–39. doi: 10.1242/dmm.010389. [DOI] [PMC free article] [PubMed] [Google Scholar]
- 28.Sartori R, Schirwis E, Blaauw B, Bortolanza S, Zhao J, Enzo E, Stantzou A, Mouisel E, Toniolo L, Ferry A, et al. BMP signaling controls muscle mass. Nat Genet. 2013;45(11):1309–1318. doi: 10.1038/ng.2772. [DOI] [PubMed] [Google Scholar]
- 29.Otto A, Patel K. Signaling and the control of skeletal muscle size. Exp Cell Res. 2010;316(18):3059–3066. doi: 10.1016/j.yexcr.2010.04.009. [DOI] [PubMed] [Google Scholar]
- 30.Lyons GE, Moore R, Yahara O, Buckingham ME, Walsh FS. Expression of NCAM isoforms during skeletal myogenesis in the mouse embryo. Dev Dyn. 1992;194(2):94–104. doi: 10.1002/aja.1001940203. [DOI] [PubMed] [Google Scholar]
- 31.Nishi M, Yasue A, Nishimatu S, Nohno T, Yamaoka T, Itakura M, Moriyama K, Ohuchi H, Noji S. A missense mutant myostatin causes hyperplasia without hypertrophy in the mouse muscle. Biochem Biophys Res Commun. 2002;293(1):247–251. doi: 10.1016/S0006-291X(02)00209-7. [DOI] [PubMed] [Google Scholar]
- 32.Krauss RS, Cole F, Gaio U, Takaesu G, Zhang W, Kang JS. Close encounters: regulation of vertebrate skeletal myogenesis by cell-cell contact. J Cell Sci. 2005;118(Pt 11):2355–2362. doi: 10.1242/jcs.02397. [DOI] [PubMed] [Google Scholar]
- 33.Krauss RS. Regulation of promyogenic signal transduction by cell-cell contact and adhesion. Exp Cell Res. 2010;316(18):3042–3049. doi: 10.1016/j.yexcr.2010.05.008. [DOI] [PMC free article] [PubMed] [Google Scholar]
- 34.Krauss RS, Joseph GA, Goel AJ. Keep your friends close: cell-cell contact and skeletal myogenesis. Cold Spring Harb Perspect Biol. 2017;9(2):a029298. doi: 10.1101/cshperspect.a029298. [DOI] [PMC free article] [PubMed] [Google Scholar]
- 35.McClure MJ, Ramey AN, Rashid M, Boyan BD, Schwartz Z. Integrin-alpha7 signaling regulates connexin 43, M-cadherin, and myoblast fusion. Am J Physiol Cell Physiol. 2019;316(6):C876–C887. doi: 10.1152/ajpcell.00282.2018. [DOI] [PubMed] [Google Scholar]
- 36.Bastos UMC, de Andrade Rosa I, Teixeira JD, Goncalves G, Costa ML, Quintas LEM, Mermelstein C. Isoproterenol induces an increase in muscle fiber size by the proliferation of Pax7-positive cells and in a mTOR-independent mechanism. Cell Biol Int. 2019;43(12):1425–1434. doi: 10.1002/cbin.11190. [DOI] [PMC free article] [PubMed] [Google Scholar]
- 37.De Vries M, Cooper HM. Emerging roles for neogenin and its ligands in CNS development. J Neurochem. 2008;106(4):1483–1492. doi: 10.1111/j.1471-4159.2008.05485.x. [DOI] [PubMed] [Google Scholar]
- 38.do Carmo Costa A, Copola AGL, Carvalho ESC, Nogueira JM, Silva GAB, Jorge EC. RGMa can induce skeletal muscle cell hyperplasia via association with neogenin signaling pathway. In Vitro Cell Dev Biol Anim. 2021;57(4):415–427. doi: 10.1007/s11626-021-00555-9. [DOI] [PubMed] [Google Scholar]
- 39.Conesa A, Madrigal P, Tarazona S, Gomez-Cabrero D, Cervera A, McPherson A, Szczesniak MW, Gaffney DJ, Elo LL, Zhang X, et al. A survey of best practices for RNA-seq data analysis. Genome Biol. 2016;17:13. doi: 10.1186/s13059-016-0881-8. [DOI] [PMC free article] [PubMed] [Google Scholar]
- 40.Wong JJ, Ritchie W, Ebner OA, Selbach M, Wong JW, Huang Y, Gao D, Pinello N, Gonzalez M, Baidya K, et al. Orchestrated intron retention regulates normal granulocyte differentiation. Cell. 2013;154(3):583–595. doi: 10.1016/j.cell.2013.06.052. [DOI] [PubMed] [Google Scholar]
- 41.Segil N, Roberts SB, Heintz N. Mitotic phosphorylation of the Oct-1 homeodomain and regulation of Oct-1 DNA binding activity. Science. 1991;254(5039):1814–1816. doi: 10.1126/science.1684878. [DOI] [PubMed] [Google Scholar]
- 42.Bozek K, Relogio A, Kielbasa SM, Heine M, Dame C, Kramer A, Herzel H. Regulation of clock-controlled genes in mammals. PLoS One. 2009;4(3):e4882. doi: 10.1371/journal.pone.0004882. [DOI] [PMC free article] [PubMed] [Google Scholar]
- 43.Stepchenko AG, Lyanova BM, Krylova ID, Ilyin YV, Georgieva SG, Pankratova EV. Differentiation of monocytic cells is accompanied by a change in the expression of the set of Oct-1 isoforms. Dokl Biochem Biophys. 2018;483(1):306–308. doi: 10.1134/S1607672918060066. [DOI] [PubMed] [Google Scholar]
- 44.Elam MB, Majumdar G, Mozhui K, Gerling IC, Vera SR, Fish-Trotter H, Williams RW, Childress RD, Raghow R. Patients experiencing statin-induced myalgia exhibit a unique program of skeletal muscle gene expression following statin re-challenge. PLoS One. 2017;12(8):e0181308. doi: 10.1371/journal.pone.0181308. [DOI] [PMC free article] [PubMed] [Google Scholar]
- 45.Lakich MM, Diagana TT, North DL, Whalen RG. MEF-2 and Oct-1 bind to two homologous promoter sequence elements and participate in the expression of a skeletal muscle-specific gene. J Biol Chem. 1998;273(24):15217–15226. doi: 10.1074/jbc.273.24.15217. [DOI] [PubMed] [Google Scholar]
- 46.Bhavsar PK, Dellow KA, Yacoub MH, Brand NJ, Barton PJ. Identification of cis-acting DNA elements required for expression of the human cardiac troponin I gene promoter. J Mol Cell Cardiol. 2000;32(1):95–108. doi: 10.1006/jmcc.1999.1058. [DOI] [PubMed] [Google Scholar]
- 47.Allen DL, Weber JN, Sycuro LK, Leinwand LA. Myocyte enhancer factor-2 and serum response factor binding elements regulate fast Myosin heavy chain transcription in vivo. J Biol Chem. 2005;280(17):17126–17134. doi: 10.1074/jbc.M501207200. [DOI] [PubMed] [Google Scholar]
- 48.Ji GG, Shu JT, Zhang M, Ju XJ, Shan YJ, Liu YF, Tu YJ. Transcriptional regulatory region and DNA methylation analysis of TNNI1 gene promoters in Gaoyou duck skeletal muscle (Anas platyrhynchos domestica) Br Poult Sci. 2019;60(3):202–208. doi: 10.1080/00071668.2019.1602250. [DOI] [PubMed] [Google Scholar]
- 49.Bodine SC, Stitt TN, Gonzalez M, Kline WO, Stover GL, Bauerlein R, Zlotchenko E, Scrimgeour A, Lawrence JC, Glass DJ, et al. Akt/mTOR pathway is a crucial regulator of skeletal muscle hypertrophy and can prevent muscle atrophy in vivo. Nat Cell Biol. 2001;3(11):1014–1019. doi: 10.1038/ncb1101-1014. [DOI] [PubMed] [Google Scholar]
- 50.Hong-Brown LQ, Brown CR, Navaratnarajah M, Lang CH. Activation of AMPK/TSC2/PLD by alcohol regulates mTORC1 and mTORC2 assembly in C2C12 myocytes. Alcohol Clin Exp Res. 2013;37(11):1849–1861. doi: 10.1111/acer.12174. [DOI] [PMC free article] [PubMed] [Google Scholar]
- 51.Schiaffino S, Dyar KA, Ciciliot S, Blaauw B, Sandri M. Mechanisms regulating skeletal muscle growth and atrophy. FEBS J. 2013;280(17):4294–4314. doi: 10.1111/febs.12253. [DOI] [PubMed] [Google Scholar]
- 52.Sartori R, Sandri M. BMPs and the muscle-bone connection. Bone. 2015;80:37–42. doi: 10.1016/j.bone.2015.05.023. [DOI] [PubMed] [Google Scholar]
- 53.Zhan J, Chitta RK, Harwood FC, Grosveld GC. Phosphorylation of TSC2 by PKC-delta reveals a novel signaling pathway that couples protein synthesis to mTORC1 activity. Mol Cell Biochem. 2019;456(1–2):123–134. doi: 10.1007/s11010-019-03498-8. [DOI] [PubMed] [Google Scholar]
- 54.Laplante M, Sabatini DM. mTOR signaling in growth control and disease. Cell. 2012;149(2):274–293. doi: 10.1016/j.cell.2012.03.017. [DOI] [PMC free article] [PubMed] [Google Scholar]
- 55.Zhang H, Cicchetti G, Onda H, Koon HB, Asrican K, Bajraszewski N, Vazquez F, Carpenter CL, Kwiatkowski DJ. Loss of Tsc1/Tsc2 activates mTOR and disrupts PI3K-Akt signaling through downregulation of PDGFR. J Clin Invest. 2003;112(8):1223–1233. doi: 10.1172/JCI17222. [DOI] [PMC free article] [PubMed] [Google Scholar]
- 56.Huang J, Dibble CC, Matsuzaki M, Manning BD. The TSC1-TSC2 complex is required for proper activation of mTOR complex 2. Mol Cell Biol. 2008;28(12):4104–4115. doi: 10.1128/MCB.00289-08. [DOI] [PMC free article] [PubMed] [Google Scholar]
- 57.Xu L, Salloum D, Medlin PS, Saqcena M, Yellen P, Perrella B, Foster DA. Phospholipase D mediates nutrient input to mammalian target of rapamycin complex 1 (mTORC1) J Biol Chem. 2011;286(29):25477–25486. doi: 10.1074/jbc.M111.249631. [DOI] [PMC free article] [PubMed] [Google Scholar]
- 58.Potthoff MJ, Olson EN. MEF2: a central regulator of diverse developmental programs. Development. 2007;134(23):4131–4140. doi: 10.1242/dev.008367. [DOI] [PubMed] [Google Scholar]
- 59.Liu N, Nelson BR, Bezprozvannaya S, Shelton JM, Richardson JA, Bassel-Duby R, Olson EN. Requirement of MEF2A, C, and D for skeletal muscle regeneration. Proc Natl Acad Sci U S A. 2014;111(11):4109–4114. doi: 10.1073/pnas.1401732111. [DOI] [PMC free article] [PubMed] [Google Scholar]
- 60.Schiaffino S, Dyar KA, Calabria E. Skeletal muscle mass is controlled by the MRF4-MEF2 axis. Curr Opin Clin Nutr Metab Care. 2018;21(3):164–167. doi: 10.1097/MCO.0000000000000456. [DOI] [PubMed] [Google Scholar]
- 61.Yuan H, Niu Y, Liu X, Fu L. Exercise increases the binding of MEF2A to the Cpt1b promoter in mouse skeletal muscle. Acta Physiol (Oxf) 2014;212(4):283–292. doi: 10.1111/apha.12395. [DOI] [PubMed] [Google Scholar]
- 62.Lee D, Goldberg AL. SIRT1 protein, by blocking the activities of transcription factors FoxO1 and FoxO3, inhibits muscle atrophy and promotes muscle growth. J Biol Chem. 2013;288(42):30515–30526. doi: 10.1074/jbc.M113.489716. [DOI] [PMC free article] [PubMed] [Google Scholar]
- 63.Koltai E, Bori Z, Chabert C, Dubouchaud H, Naito H, Machida S, Davies KJ, Murlasits Z, Fry AC, Boldogh I, et al. SIRT1 may play a crucial role in overload-induced hypertrophy of skeletal muscle. J Physiol. 2017;595(11):3361–3376. doi: 10.1113/JP273774. [DOI] [PMC free article] [PubMed] [Google Scholar]
- 64.Ebert SM, Monteys AM, Fox DK, Bongers KS, Shields BE, Malmberg SE, Davidson BL, Suneja M, Adams CM. The transcription factor ATF4 promotes skeletal myofiber atrophy during fasting. Mol Endocrinol. 2010;24(4):790–799. doi: 10.1210/me.2009-0345. [DOI] [PMC free article] [PubMed] [Google Scholar]
- 65.Ebert SM, Dyle MC, Bullard SA, Dierdorff JM, Murry DJ, Fox DK, Bongers KS, Lira VA, Meyerholz DK, Talley JJ, et al. Identification and Small Molecule Inhibition of an Activating Transcription Factor 4 (ATF4)-dependent Pathway to Age-related Skeletal Muscle Weakness and Atrophy. J Biol Chem. 2015;290(42):25497–25511. doi: 10.1074/jbc.M115.681445. [DOI] [PMC free article] [PubMed] [Google Scholar]
- 66.Davis DB, Delmonte AJ, Ly CT, McNally EM. Myoferlin, a candidate gene and potential modifier of muscular dystrophy. Hum Mol Genet. 2000;9(2):217–226. doi: 10.1093/hmg/9.2.217. [DOI] [PubMed] [Google Scholar]
- 67.Doherty KR, Cave A, Davis DB, Delmonte AJ, Posey A, Earley JU, Hadhazy M, McNally EM. Normal myoblast fusion requires myoferlin. Development. 2005;132(24):5565–5575. doi: 10.1242/dev.02155. [DOI] [PMC free article] [PubMed] [Google Scholar]
- 68.Demonbreun AR, Lapidos KA, Heretis K, Levin S, Dale R, Pytel P, Svensson EC, McNally EM. Myoferlin regulation by NFAT in muscle injury, regeneration and repair. J Cell Sci. 2010;123(Pt 14):2413–2422. doi: 10.1242/jcs.065375. [DOI] [PMC free article] [PubMed] [Google Scholar]
- 69.Posey AD, Jr, Demonbreun A, McNally EM. Ferlin proteins in myoblast fusion and muscle growth. Curr Top Dev Biol. 2011;96:203–230. doi: 10.1016/B978-0-12-385940-2.00008-5. [DOI] [PMC free article] [PubMed] [Google Scholar]
- 70.Swailes NT, Colegrave M, Knight PJ, Peckham M. Non-muscle myosins 2A and 2B drive changes in cell morphology that occur as myoblasts align and fuse. J Cell Sci. 2006;119(Pt 17):3561–3570. doi: 10.1242/jcs.03096. [DOI] [PubMed] [Google Scholar]
- 71.Simons M, Wang M, McBride OW, Kawamoto S, Yamakawa K, Gdula D, Adelstein RS, Weir L. Human nonmuscle myosin heavy chains are encoded by two genes located on different chromosomes. Circ Res. 1991;69(2):530–539. doi: 10.1161/01.res.69.2.530. [DOI] [PubMed] [Google Scholar]
- 72.Foth BJ, Goedecke MC, Soldati D. New insights into myosin evolution and classification. Proc Natl Acad Sci U S A. 2006;103(10):3681–3686. doi: 10.1073/pnas.0506307103. [DOI] [PMC free article] [PubMed] [Google Scholar]
- 73.Even-Ram S, Yamada KM. Of mice and men: Relevance of cellular and molecular characterizations of myosin IIA to MYH9-related human disease. Cell Adh Migr. 2007;1(3):152–155. doi: 10.4161/cam.1.3.5089. [DOI] [PMC free article] [PubMed] [Google Scholar]
- 74.Sebe-Pedros A, Grau-Bove X, Richards TA, Ruiz-Trillo I. Evolution and classification of myosins, a paneukaryotic whole-genome approach. Genome Biol Evol. 2014;6(2):290–305. doi: 10.1093/gbe/evu013. [DOI] [PMC free article] [PubMed] [Google Scholar]
- 75.Dey SK, Saha S, Das P, Das MR, Jana SS. Regulation of nonmuscle myosin II during 3-methylcholanthrene induced dedifferentiation of C2C12 myotubes. Exp Cell Res. 2014;326(1):68–77. doi: 10.1016/j.yexcr.2014.05.015. [DOI] [PubMed] [Google Scholar]
- 76.Margadant C, Monsuur HN, Norman JC, Sonnenberg A. Mechanisms of integrin activation and trafficking. Curr Opin Cell Biol. 2011;23(5):607–614. doi: 10.1016/j.ceb.2011.08.005. [DOI] [PubMed] [Google Scholar]
- 77.Tomczak KK, Marinescu VD, Ramoni MF, Sanoudou D, Montanaro F, Han M, Kunkel LM, Kohane IS, Beggs AH. Expression profiling and identification of novel genes involved in myogenic differentiation. FASEB J. 2004;18(2):403–405. doi: 10.1096/fj.03-0568fje. [DOI] [PubMed] [Google Scholar]
- 78.Lee EJ, Malik A, Pokharel S, Ahmad S, Mir BA, Cho KH, Kim J, Kong JC, Lee DM, Chung KY, et al. Identification of genes differentially expressed in myogenin knock-down bovine muscle satellite cells during differentiation through RNA sequencing analysis. PLoS One. 2014;9(3):e92447. doi: 10.1371/journal.pone.0092447. [DOI] [PMC free article] [PubMed] [Google Scholar]
- 79.Shang N, Lee JTY, Huang T, Wang C, Lee TL, Mok SC, Zhao H, Chan WY. Disabled-2: a positive regulator of the early differentiation of myoblasts. Cell Tissue Res. 2020;381(3):493–508. doi: 10.1007/s00441-020-03237-2. [DOI] [PMC free article] [PubMed] [Google Scholar]
- 80.Bannister RA. Bridging the myoplasmic gap: recent developments in skeletal muscle excitation-contraction coupling. J Muscle Res Cell Motil. 2007;28(4–5):275–283. doi: 10.1007/s10974-007-9118-5. [DOI] [PubMed] [Google Scholar]
- 81.Nakada T, Kashihara T, Komatsu M, Kojima K, Takeshita T, Yamada M. Physical interaction of junctophilin and the CaV1.1 C terminus is crucial for skeletal muscle contraction. Proc Natl Acad Sci U S A. 2018;115(17):4507–4512. doi: 10.1073/pnas.1716649115. [DOI] [PMC free article] [PubMed] [Google Scholar]
- 82.Park JW, Lee JH, Kim SW, Han JS, Kang KS, Kim SJ, Park TS. Muscle differentiation induced up-regulation of calcium-related gene expression in quail myoblasts. Asian-Australas J Anim Sci. 2018;31(9):1507–1515. doi: 10.5713/ajas.18.0302. [DOI] [PMC free article] [PubMed] [Google Scholar]
- 83.Tajhya RB, Hu X, Tanner MR, Huq R, Kongchan N, Neilson JR, Rodney GG, Horrigan FT, Timchenko LT, Beeton C. Functional KCa1.1 channels are crucial for regulating the proliferation, migration and differentiation of human primary skeletal myoblasts. Cell Death Dis. 2016;7(10):e2426. doi: 10.1038/cddis.2016.324. [DOI] [PMC free article] [PubMed] [Google Scholar]
- 84.Liu JH, Konig S, Michel M, Arnaudeau S, Fischer-Lougheed J, Bader CR, Bernheim L. Acceleration of human myoblast fusion by depolarization: graded Ca2+ signals involved. Development. 2003;130(15):3437–3446. doi: 10.1242/dev.00562. [DOI] [PubMed] [Google Scholar]
- 85.Porter GA, Jr, Makuck RF, Rivkees SA. Reduction in intracellular calcium levels inhibits myoblast differentiation. J Biol Chem. 2002;277(32):28942–28947. doi: 10.1074/jbc.M203961200. [DOI] [PubMed] [Google Scholar]
- 86.Patro R, Duggal G, Love MI, Irizarry RA, Kingsford C. Salmon provides fast and bias-aware quantification of transcript expression. Nat Methods. 2017;14(4):417–419. doi: 10.1038/nmeth.4197. [DOI] [PMC free article] [PubMed] [Google Scholar]
- 87.Love MI, Huber W, Anders S. Moderated estimation of fold change and dispersion for RNA-seq data with DESeq2. Genome Biol. 2014;15(12):550. doi: 10.1186/s13059-014-0550-8. [DOI] [PMC free article] [PubMed] [Google Scholar]
- 88.Bindea G, Mlecnik B, Hackl H, Charoentong P, Tosolini M, Kirilovsky A, Fridman WH, Pages F, Trajanoski Z, Galon J. ClueGO: a Cytoscape plug-in to decipher functionally grouped gene ontology and pathway annotation networks. Bioinformatics. 2009;25(8):1091–1093. doi: 10.1093/bioinformatics/btp101. [DOI] [PMC free article] [PubMed] [Google Scholar]
- 89.Pfaffl MW, Horgan GW, Dempfle L. Relative expression software tool (REST) for group-wise comparison and statistical analysis of relative expression results in real-time PCR. Nucleic Acids Res. 2002;30(9):e36. doi: 10.1093/nar/30.9.e36. [DOI] [PMC free article] [PubMed] [Google Scholar]
Associated Data
This section collects any data citations, data availability statements, or supplementary materials included in this article.
Supplementary Materials
Additional file1: Supplementary file 1. Differentially expressed transcripts modulated by RGMa treatment during the differentiation of C2C12 cells.
Additional file 2: Supplementary file 2. Differentially expressed genes modulated by RGMa treatment during the differentiation of C2C12 cell.
Data Availability Statement
The raw transcriptome sequencing data (RNA-seq) from the technical replicates of C2C12 myoblast treated with RGMa are available under the NCBI-BioProject submission code PRJNA730936. The datasets supporting the conclusions of this article are included within the article and its additional files.