

Abstract
Despite significant interest in the neural underpinnings of behavioral variability, little light has been shed on the cortical mechanism underlying the failure to respond to perceptual-level stimuli. We hypothesized that cortical activity resulting from perceptual-level stimuli is sensitive to the moment-to-moment fluctuations in cortical excitability, and thus may not suffice to produce a behavioral response. We tested this hypothesis using electrocorticographic recordings to follow the propagation of cortical activity in six human subjects that responded to perceptual-level auditory stimuli. Here we show that for presentations that did not result in a behavioral response, the likelihood of cortical activity decreased from auditory cortex to motor cortex, and was related to reduced local cortical excitability. Cortical excitability was quantified using instantaneous voltage during a short window prior to cortical activity onset. Therefore, when humans are presented with an auditory stimulus close to perceptual-level threshold, moment-by-moment fluctuations in cortical excitability determine whether cortical responses to sensory stimulation successfully connect auditory input to a resultant behavioral response.
Keywords: Electrocorticography (ECoG), alpha oscillations, perception threshold, broadband gamma activity, instantaneous voltage, stimulus detection
Graphical Abstract
1. Introduction
Human responses to external sensory stimuli are inherently variable. Not only do humans vary in how quickly they respond, but also in whether they respond at all to sensory stimuli. The underlying physiology of this behavioral variability has been widely investigated at different levels ranging from high-level cognitive studies to the electrophysiology that underlies perception in humans and animals (for reviews see Dehaene and Changeux, 2011, Ruhnau et al., 2014). These studies have shown how stimulus properties such as intensity, contrast, and duration affect the cortical (Rose et al., 1971, Bruneau et al., 1993, Mäkinen et al., 2004, Busch et al., 2004, Schadow et al., 2007, Muniak et al., 2007, Palmer et al., 2007, Buran et al., 2014) and behavioral response (Raab and Fehrer, 1962, Raab, 1962, Kohfeld, 1971, Ulrich et al., 1998, Kurylo et al., 2015, Schlittenlacher and Ellermeier, 2015). For example, stimuli at higher intensity evoke a stronger cortical response, and a faster and more reliable behavioral response.
This behavioral variability is especially apparent for external sensory stimuli presented at the perceptual threshold, i.e., an intensity at which humans respond approximately 50% of the time (Fechner, 1860, Leek, 2001, Smith, 2008). Studies make use of this effect to better understand why humans do not always respond to external sensory stimuli. In these studies, external stimuli are presented at the perceptual-threshold level to investigate the underlying cortical mechanisms that govern perception of and response to tactile (De Lafuente and Romo, 2005, Monto et al., 2008, Sachidhanandam et al., 2013, Yang et al., 2016, Kyriakatos et al., 2017, Rickard et al., 2018), visual (Palmer et al., 2007, Melloni et al., 2007, Hesselmann et al., 2008, Busch et al., 2009, Gutnisky et al., 2017, Iemi et al., 2017, Iemi and Busch, 2018) and auditory (Bruneau et al., 1993, Mäkinen et al., 2004, Sadaghiani et al., 2009, Zoefel and Heil, 2013, Buran et al., 2014) stimuli. With this, these studies investigated the role of cortical excitability and population-level activity in the behavioral response to stimuli at perceptual threshold.
Cortical excitability is expressed by cortical oscillations, i.e., rhythmic changes embedded in the ongoing cortical activity (Berger, 1929, Buzsaki and Draguhn, 2004, Buzsaki, 2006). Oscillations arise from interactions between excitatory pyramidal cells and inhibitory interneurons. The variations in the amplitude of alpha oscillations, are related to cortical excitability, i.e., the probability of cortical excitation/activation in response to inputs. This relationship between alpha power and cortical excitability is supported by several studies showing that lower alpha power coincides with higher cortical activity and higher alpha power coincides with lower cortical activity (Romei et al., 2008, Jensen and Mazaheri, 2010, de Pesters et al., 2016, Lange et al., 2013, Klimesch et al., 2007, Mazaheri and Jensen, 2010). Moreover, the level of excitability of neural populations at each time point is reflected in the cycle of oscillation (Haegens et al., 2011). Specifically, cortical excitability is high in the trough of oscillations and is low in the peak of oscillations. Cortical oscillations have been implicated in the transmission of sensory information throughout the cortex (Ward, 2003, Brovelli et al., 2004, Schnitzler and Gross, 2005, Coon et al., 2016, Zhang et al., 2018). This is facilitated through modulating cortical excitability of the underlying neural populations. The more excitable neural populations are at the time of the stimulus onset, the faster the stimulus is perceived (Bishop, 1932, Haegens et al., 2011). Power (Pfurtscheller et al., 1996, Foxe et al., 1998, Jensen and Mazaheri, 2010, de Pesters et al., 2016) and phase (Hirase et al., 1999, Fries, 2005, Haegens et al., 2011) of low-frequency cortical oscillations have been shown to be hallmarks of cortical excitability. Commonly, a decrease in power of low-frequency cortical oscillations increases cortical excitability, while the phase of the oscillation governs the time of maximum cortical excitability. Most recently, instantaneous voltage has been proposed as a unified concept in which the amplitude of instantaneous voltage is an even better predictor of cortical excitability than power and phase alone (Schalk et al., 2017). This new concept is motivated by the observation that the voltage amplitude of oscillations in the alpha band (8–12 Hz) is asymmetric around zero (Mazaheri and Jensen, 2008, Nikulin et al., 2010). The asymmetric property of alpha oscillations is suggested to result from unidirectionality of intracellular currents in the dendrites of pyramidal cells (Mazaheri and Jensen, 2008). In the process of band-pass filtering, the asymmetric property of alpha oscillations is lost. A recently developed hypothesis called function-through-biased-oscillations (FBO, Schalk et al. 2017) introduces a new feature called instantaneous voltage that contains the offset bias. Specifically, instantaneous voltage is the instantaneous amplitude of a biased alpha oscillation. The instantaneous voltage provides an estimate of asymmetric alpha oscillations (Schalk et al., 2017).
Recent studies have shown that increased cortical excitability results in a higher probability to respond to perceptual-threshold stimuli (Hesselmann et al., 2008, Monto et al., 2008, Busch et al., 2009, Sachidhanandam et al., 2013, Ruhnau et al., 2014, Gutnisky et al., 2017, Rickard et al., 2018). This is complemented by studies that have shown increased cortical activity for those perceptual-threshold stimuli that subjects responded to (Dehaene et al., 2001, Melloni et al., 2007, Palmer et al., 2007, Quiroga et al., 2008, Sadaghiani et al., 2009, Fisch et al., 2009). While these studies illustrate the role of cortical oscillations and population-level activity in the behavioral response to perception-level stimuli, they do not fully explain their interaction and influence throughout the cortex (Ruhnau et al., 2014). In other words, the specific neural mechanism underlying variability in response and processing of perceptual-level stimuli is a continuing subject of debate in neuroscience (Weiskrantz, 1999, Hesselmann et al., 2008, Monto et al., 2008, Dehaene and Changeux, 2011, Zoefel and Heil, 2013, Ruhnau et al., 2014, Yang et al., 2016, Baria et al., 2017, Iemi and Busch, 2018, Reznik and Mukamel, 2019, Sederberg et al., 2019).
Investigating this interaction requires the ability to record brain signals at high temporal and spatial fidelity and to analyze the interaction between cortical oscillations and population-level activity at the single-trial level. This has only recently become possible with the advent of electrocorticographic (ECoG) signal recordings and the development of methods to analyze these signals at the single-trial level. Using this approach, recent studies have shown the progression of population-level activity from sensory to motor cortex (Coon and Schalk, 2016, Coon et al., 2016).
In this study, we make use of these methods by applying them to the cortical response of perceptual-level stimuli. The behavioral response to these stimuli is uncertain, and thus results in hit and miss trials. We are following the evoked cortical activity throughout the cortex, and relating the propagation of cortical activity to the underlying cortical excitability. Specifically, we hypothesized that: 1) the disruption in the transmission of information from sensory to motor cortex leads to miss trials; and 2) variations in cortical excitability can explain the observed disruption in cortical transmission. Our first hypothesis is based on previous studies that suggest that gamma phase synchronization and connectivity across distant cortical sites is stronger for hit than for miss trials (Melloni et al., 2007, Gaillard et al., 2009). Our second hypothesis is based on the established understanding that cortical excitability modulates population-level activity. Consequently, the decrease of cortical excitability throughout the cortex inhibits population-level activity and prevents a behavioral response (Haegens et al., 2011, de Pesters et al., 2016).
Our work addresses this important neuroscientific question using electrocorticographic (ECoG) recordings from wide cortical areas in 6 human subjects that performed an auditory reaction time task. In this task, the subjects rapidly responded to a 25 ms-long near perceptual-level sound (i.e., a 1 kHz tone) with a button press. Our results show that in those trials that did not result in a behavioral response, early sensory cortex is activated but the propagation of that activation towards motor cortex is inhibited. Furthermore, we show that this phenomenon can be explained by alpha-band oscillations that directly modulate local cortical excitability.
2. Methods
2.1. Subjects
Six human subjects with normal hearing (age 27–69, three men: A–C and three women: D–F) participated in this study at Albany Medical Center (Albany, New York). All subjects were patients with intractable epilepsy who underwent temporary placement of subdural electrocorticographic (ECoG) electrode grids for the localization of their seizure onset area. About one week after electrode implantation, the electrode grids were removed and the localized seizure focus area was surgically resected. The electrode grids were located over the left (subjects B, C, E and F) or right (subjects A and D) hemisphere and covered large areas of temporal, frontal and parietal cortices (see Fig. S1). The platinum-iridium electrodes were 4 mm in diameter (2.3 mm exposed), spaced 6–10 mm center-to-center, and embedded in silicone (Ad-Tech Medical Corp., Racine, WI; and PMT Corp., Chanhassen, MN). The total number of electrodes varied from 92–134 across subjects. Subjects provided informed consent for participating in the study, which was approved by the Institutional Review Board of Albany Medical College and the Human Research Protections Office of the U.S. Army Medical Research and Materiel Command.
2.2. Anatomical Mapping
After ECoG electrode grids implantation, we generated patient-specific brain models based on pre-operative T1-weighted structural magnetic resonance images (MRI) using the FreeSurfer software (Reuter et al., 2012). Next, we co-registered MRI and post-operative recorded computed tomography (CT) scans to localize electrode locations on patient-specific brain models and to map these locations onto the brain template provided by the Montreal Neurological Institute (MNI brain model). Subsequently, we used the NeuralAct toolbox (Kubanek and Schalk, 2015) and MATLAB 2015a (The MathWorks, Inc., Natick, Massachusetts, United States) to generate brain plots.
2.3. Functional Mapping
Prior to performing our experimental task, we verified that the cortical areas essential to this study, were indeed covered with ECoG electrodes. For this purpose, we performed screening tasks, in which subjects listened to a sequence of tones, performed self-paced finger flexion and received tactile stimulation to their individual fingers (Schalk et al., 2008a,b, Brunner et al., 2009). The analysis of this data showed that auditory and finger motor cortex were indeed covered in all six subjects. Based on the sensory-motor screening, we instructed the subjects to perform the reaction task described below with their thumb (subjects A–E) or middle finger (subject F).
2.4. Task
The subjects performed an auditory reaction-time task in which they used their thumb (or middle finger in subject F) contralateral to the ECoG implant to respond as fast as possible to a 25 ms-long auditory stimulus (1 kHz tone). For this purpose, the subjects were fitted with sound isolating over-the-ear headphones (Panasonic RP-HTX7, 10 dB isolation). Throughout the task, the subjects were required to maintain gaze on a screen in front of them. A fixation cross cued the onset of each trial, and after a random 1–3 sec-long pre-stimulus interval the auditory stimulus was presented through the over-the-ear headphones. The subjects had to react by pressing the push button within 1.5 second of the stimulus onset. The screen presented the subject’s reaction time, or in the case they miss the stimulus, a negative feedback (“try harder”) (see Fig. S2A for experiment design). Each subject performed between 263 and 360 trials of this task.
To control for the remote possibility that subjects could have correctly guessed the time of the perception threshold stimuli, we presented 49 catch trials randomly interleaved within the other trials. In these catch trials no auditory stimulus was presented. Subjects responded only to 5/294 (1.7%) catch trials.
2.5. Calibration
We were interested in presenting the auditory stimulus at or above the perception threshold, i.e., a sound intensity for which subjects respond at a rate of 50%. The perception threshold varies across subjects mainly due to age (Wiley et al., 2008, Oxenham, 2016, Hwi Park et al., 2016) and also depends on stimulus properties such as duration and intensity (Garner and Miller, 1947, Lewis et al., 1977, Neubauer and Heil, 2004, Heil et al., 2006, Meddis and Lecluyse, 2011). For that reason, we performed a calibration session to determine each subject’s individual perception threshold prior to the main experimental task.
In our calibration session, subjects performed the above-described task, however with the auditory stimulus being presented at intensities ranging from 1 to 40 dB sound pressure level (SPL). Each calibration session started with the presentation of the auditory stimulus at 5.5 dB SPL, a level well above the perception threshold of adults for a 1 kHz tone (i.e., ~3 dB SPL) (Killion, 1978, Moore, 1989). Throughout of the calibration session, a Parameter Estimation by Sequential Testing (PEST; Taylor and Creelman 1967) algorithm adjusted the intensity of the tone to iteratively converge towards the perception threshold (see example in Fig. S2B). Specifically, after every four trials, the intensity of the tone presented in the subsequent trials was increased, decreased, or remained constant, depending on the performance in the preceding four trials. The intensity of the auditory stimulus eventually converged to the hearing-threshold, i.e., to an intensity for which the subject responded to at a rate of 50%.
To validate that the subject’s performance within the 1 to 40 dB SPL range conformed to the expected psychometric function, we modeled the subjects’ behavior with a sigmoid function (Fig. S2C for subject D and Fig. S3 for all subjects).
For each subject, based on our modeled psychometric function which is a sigmoid curve, we chose the following three sound intensities: 1) near hearing-threshold or low intensity (50±10% response); 2) medium intensity (60±11% response); and 3) high intensity (100±2% response, mean±sem). During the main experimental task, we presented the auditory stimulus at these three sound intensities in a block-randomized sequence (15 presentations per block, 7 blocks per subject, 105 total number of presentations for each subject). In total, subjects reacted to the high intensity stimulus in 593/629 (94%), the medium stimulus in 443/630 (70%), and the near hearing-threshold stimulus in 357/628 (56%) of all trials in the main experiment task.
2.6. Data Collection
We used the general-purpose BCI2000 software platform (Schalk et al., 2004, Schalk and Mellinger, 2010) to present the experimental task while simultaneously recording the ECoG signals along with stimulus onset, and the subject’s behavior using a 256-channel biosignal acquisition device connected to a hardware trigger (g.HIamp & g.TRIGbox, g.tec, Graz, Austria). This synchronized recording, at a sampling rate of 1200 Hz, ensured that ECoG signals, stimulus onset and behavioral response were captured without introducing any temporal jitter or delay.
In addition, BCI2000 simultaneously recorded the environmental noise sampled at 44.1 KHz, using two dynamic cardioid microphones, placed near the patient, and connected to a low-latency USB-audio interface (Tascam US122MKII, TEAC Corporation, Montebello, California).
2.7. Signal processing
In our signal processing, we were interested in extracting the neural response to the auditory reaction task. Specifically, we extracted alpha power and instantaneous voltage as measures of cortical excitability, and broadband gamma as a measure of population-level activity. The following paragraphs describe the signal processing steps that accomplished this.
To pre-process our signals, after visual inspection, we first removed 14 (2.1%) of 645 electrodes that were contaminated by noise (e.g., ground, reference channels, channels with broken connections, presence of environmental artifacts and interictal activity). This left us with 631 electrodes.
To extract alpha power, we first extracted alpha oscillations by 1) removing the DC bias offset in the signal using a 4th-order Butterworth (IIR) high-pass filter at 0.5 Hz; 2) re-referencing the signal to a common average reference (CAR); and 3) extracting alpha oscillations using a 6th-order Butterworth band-pass filter between 8 and 12 Hz. All filters used the filtfilt function in MATLAB for zero phase-lag filtering. Next, we determined alpha power as the square of absolute value of analytic signal calculated on the alpha oscillations (i.e., the output of the Hilbert function in MATLAB).
To extract the amplitude of the instantaneous voltage, we performed the procedure described in Schalk et al. (2017) on the alpha oscillations extracted above. This procedure is based on the model introduced in Schalk (2015), in which trough amplitudes do not vary with the voltage envelope amplitude (cyan trace in Figure S10). In short, we added the estimated bias offset, i.e., calculated using the bias offset as the 5th percentile of the voltage values in the alpha oscillations time course, to the alpha oscillations (see Fig. S7A).
To implement this bias correction, for each recorded location, we defined a bias offset (of f setbias) that represented the minimum value of the troughs as the 5th percentile of the voltage values of the filtered signal (yellow trace in Figure S10). We then subtracted from the bandpass-filtered alpha activity values, S AA, the difference between the negative of the corresponding amplitude envelope value, S AE, and the bias offset, of f setbias, to obtain the bias-corrected voltage amplitude of oscillatory activity using the equation:
In this paper, we refer to the bias-corrected voltage amplitude of oscillatory activity as instantaneous voltage amplitude.
To extract broadband gamma power, we performed the same signal processing steps as described above for the alpha power, except that we band-pass filtered the signal between 70–170 Hz. To reduce the computational complexity of all subsequent analyses, we down-sampled the signal by a factor of three to 400 Hz. For further analysis, we divided the alpha power, instantaneous voltage, and broadband gamma power signals into individual trials, i.e., into 2 sec-long segments centered around the stimulus onset (as defined by the hardware trigger).
To facilitate the comparison across different cortical areas, we normalized alpha power, instantaneous voltage, and broadband gamma power of each trial to the median of the baseline across trials . In this we used the median absolute deviation as the variance of the entire baseline period across all trials, and the as the median of baseline across trials (see Iglewicz and Hoaglin 1993 for details). In this analysis, for each electrode, we calculated median onset time across trials. We then calculated the median, 1st and 3rd quartile of the median onset times. Similarly, for each electrode, we calculated standard deviation of onset times across trials. We then calculated the median, 1st and 3rd quartile of the standard deviation of the onset times.
Finally, we rejected any trials during which environmental noise might have affected the subject’s performance. Specifically, we rejected 17 (0.9%) of all 1887 trials throughout which ongoing environmental noise in the 900–1100 Hz range occurred (i.e., average noise power during trial >75th percentile of noise power throughout the experiment).
To reject the remote possibility that environmental noise might have affected the performance in the remaining trials, we determined whether reaction times were correlated with the average power in the audio signals. The result of this analysis unequivocally rejects this possibility by showing that there was no significant correlation between reaction times and background noise for any of the subjects (Spearman’s correlation, p≫0.05).
2.8. Identification of task-related locations
Prior to our further analysis, we selected those electrodes that exhibited a statistically significant activity during the task period. Specifically, we selected those electrodes for which broadband gamma activity was significantly higher during the task period compared to the baseline period in response to high-intensity stimuli. Based on the subject’s average reaction time of 742 ms (90th-percentile; Fig. 2F), we defined the 750 ms after, and the 750 ms before stimulus onset as task and baseline periods, respectively.
Figure 2. Cortical and behavioral response evoked by high and low-intensity stimulus onset.
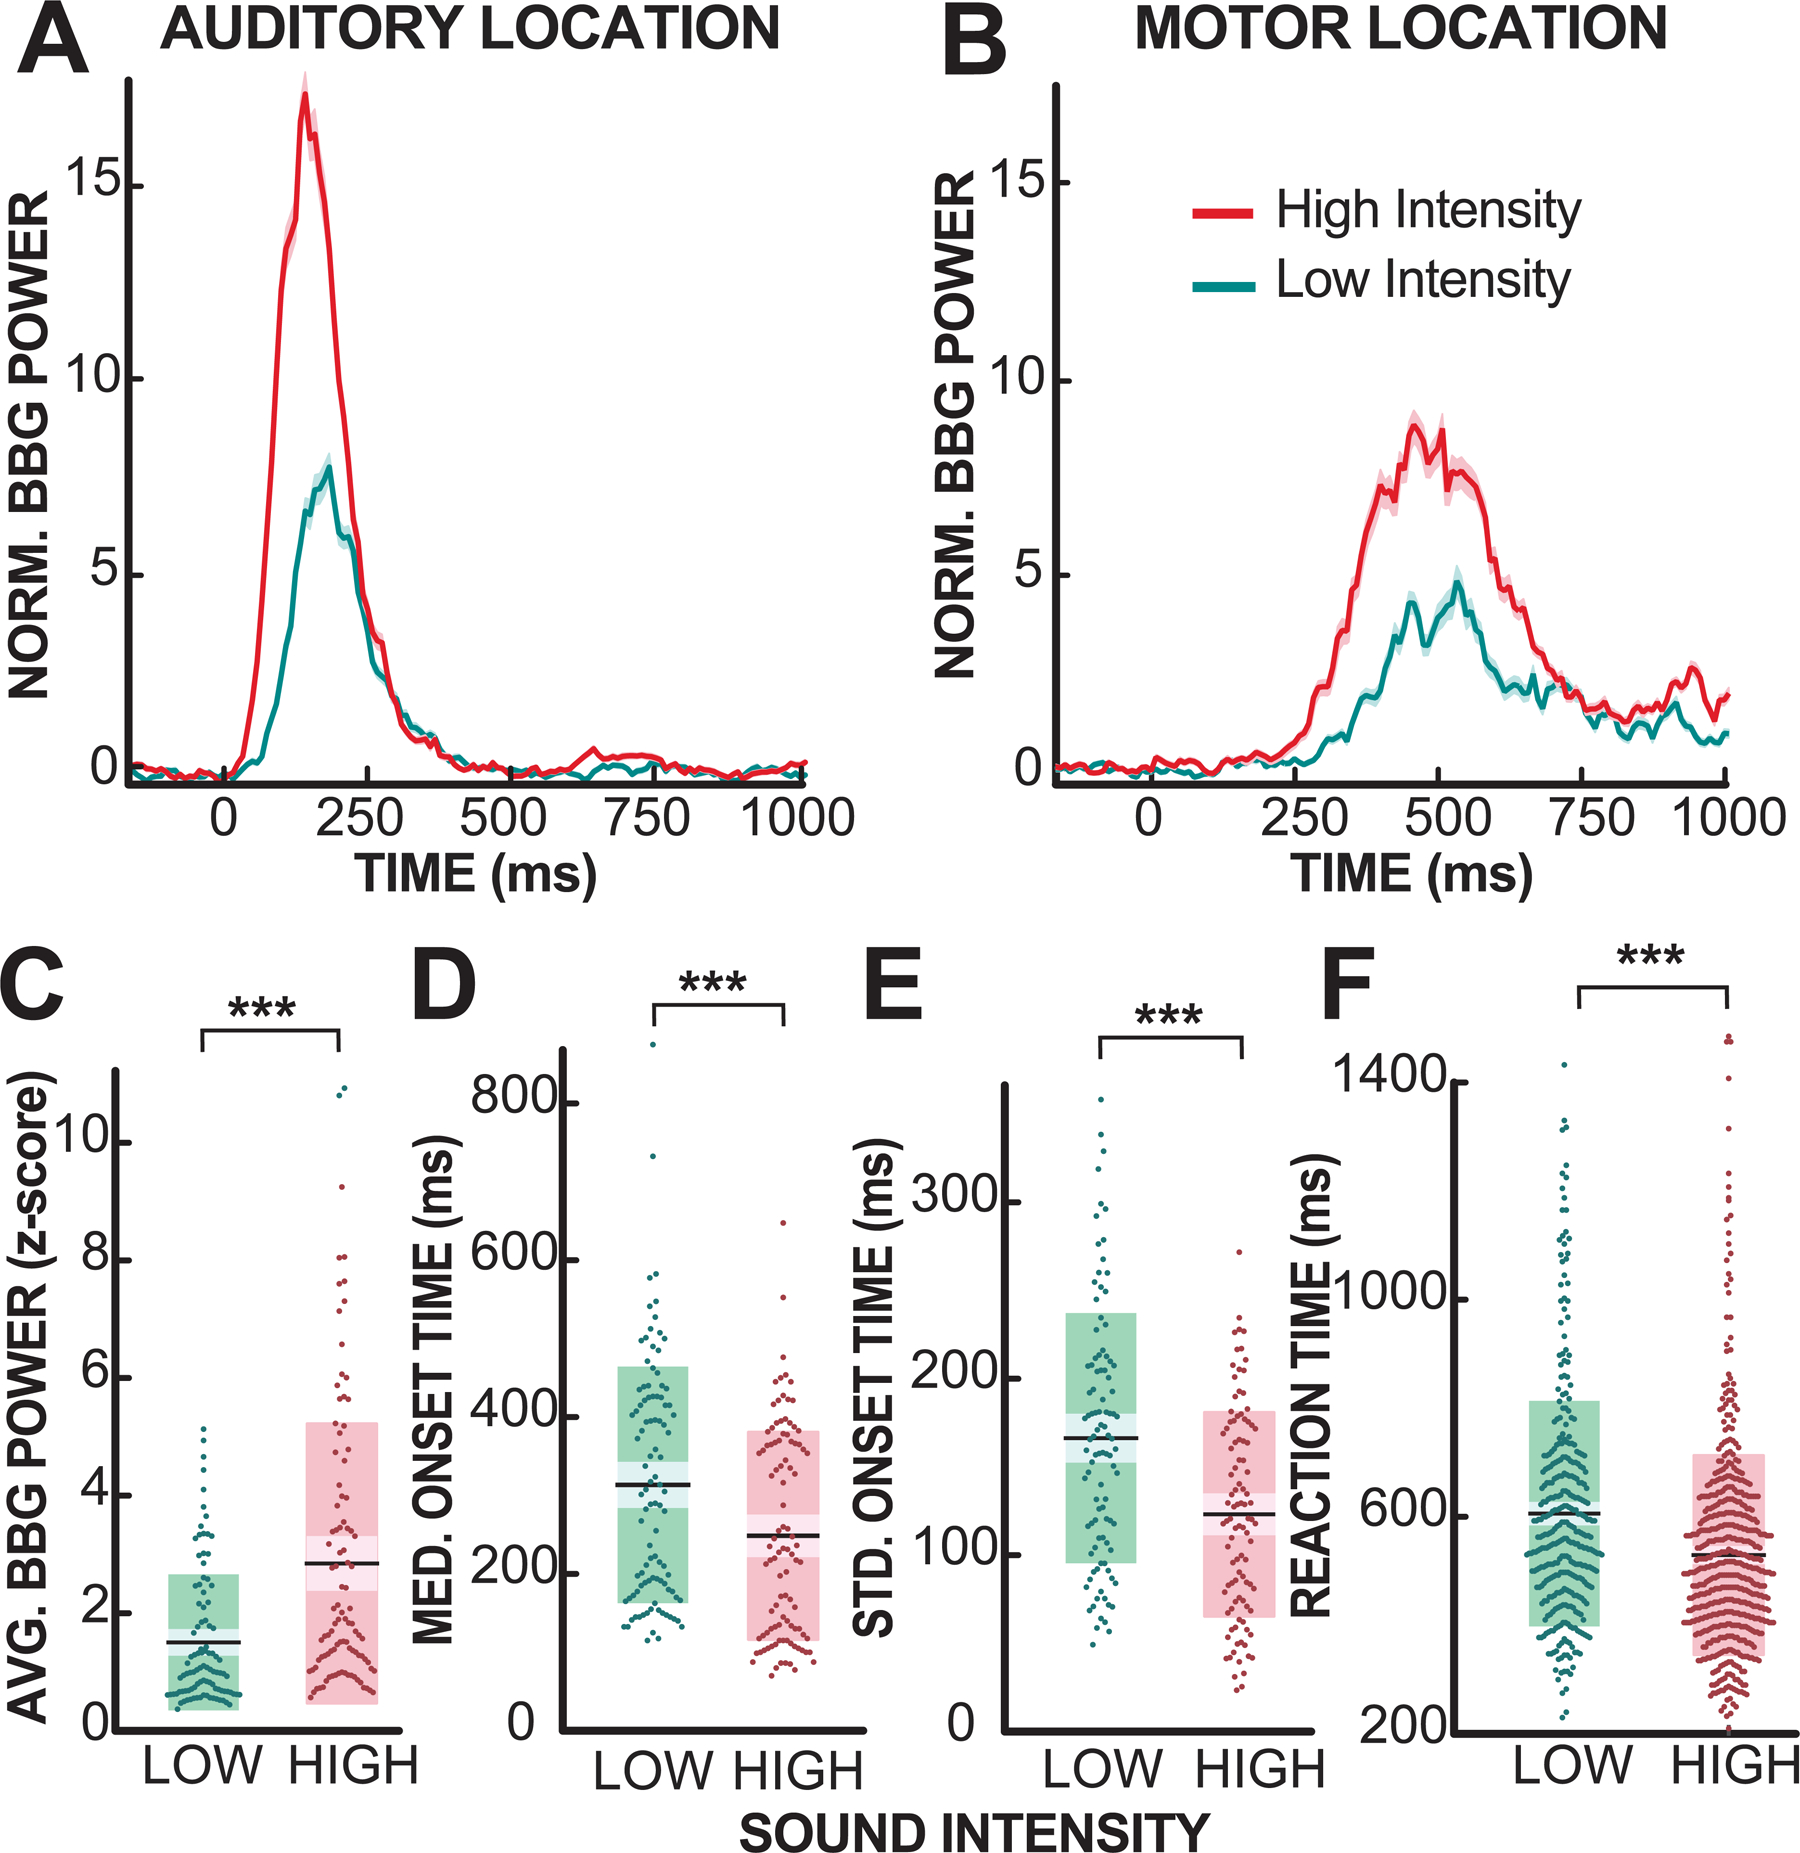
High-intensity stimuli evoked a larger and faster cortical response than low-intensity stimuli. (A,B) Broadband gamma (BBG) power response to high (red) and low (green) intensity stimulus, for one representative auditory (left) and motor (right) location. High-intensity stimuli evoke a larger broadband gamma power response than low-intensity stimuli. Semi-transparent shading represents the standard error of the mean (SEM). (C-E) Analysis of evoked broadband gamma response, onset time, and reaction time across all locations. High-intensity stimuli evoked a larger, faster, and less variable broadband gamma response than low-intensity stimuli (***: p<0.001, Wilcoxon rank-sum test). (F) High-intensity stimuli resulted in faster behavioral response (***: p<0.001, Wilcoxon rank-sum test). Error bars denote SEM.
In the first step of our selection procedure, we calculated the statistical difference between activity during task and baseline periods for each location. For this purpose, we calculated the average of the broadband gamma power for each baseline and task period and assigned it a corresponding label (i.e., −1 for baseline and +1 for task period). We then calculated the correlation between the averaged broadband gamma power and the corresponding labels. This yielded one correlation coefficient for each of our locations.
Next, we determined the statistical significance of our observed correlation coefficients. For this purpose, we performed a permutation test in which we compared our observed correlation coefficient against the distribution of correlation coefficients derived from the randomly assigned task and baseline periods. Specifically, we calculated the correlation coefficient 1000 times, each time with a newly permutated sequence of labels. We considered an observed correlation coefficient value to be statistically significant at the 95th percentile of that distribution (p<0.05, Bonferroni-corrected for the total number of electrodes in each subject). This procedure yielded 101 electrodes (i.e., 16.7±7.9 per subject) with statistically significant activity during the task period. The detected electrode locations are depicted in Fig. 1 for all subjects.
Figure 1. Cortical locations responsive to the high-intensity auditory stimulus.

Black dots depict ECoG electrode locations. Green dots depict those locations that exhibited a significant broadband gamma response to the stimulus onset. Locations of ECoG electrodes are presented on the MNI template brain.
To validate the specificity of our procedure, we performed the same analysis on signals recorded during the catch trials, i.e., those trials during which no sound stimulus was presented. As expected, this did not yield any electrode with statistically significant activity during the task period of the catch trials (p>0.05).
2.9. Single-trial broadband gamma onset detection
In our single-trial analysis, we detected the onset of broadband gamma activity after the stimulus onset. For this purpose, we used a method described in (Coon et al., 2016, Coon and Schalk, 2016). In this method, the onset is determined as the time point after stimulus onset at which activity exceeds a specific threshold. This threshold is determined for each electrode in a procedure that compares the number of detected onsets during baseline- and task-periods. The determined optimal electrode-specific threshold minimizes the detected onsets during baseline period while maximizing the detected onsets during task period.
The nature of our experiment required substantial modifications to the original onset detection method in order to accommodate variability across subjects in stimulus intensity, reaction-time, and magnitude of neural response.
To accommodate the variability in the magnitude of the neural response, we set the range for which the optimal electrode-specific threshold is determined to the range between one z-score above baseline broadband gamma power and the 90th percentile of maximum broadband gamma power value across trials. To accommodate the variability in reaction time, we defined the task period as the period between stimulus onset and the 90th percentile of the reaction time of all trials. To accommodate the variability in the stimulus intensity, we determined the optimal electrode-specific threshold for data recorded during the presentation of medium intensity stimuli. This common optimal electrode-specific threshold allowed us to compare the broadband gamma onset characteristics between low, medium, and high-intensity stimulus presentation (see Fig. 2). We consequently applied this optimal electrode-specific threshold to data recorded during all stimulus intensities.
3. Results
3.1. Cortical and behavioral responses evoked by perceptual-level and high-intensity stimulus onset
We were interested in the influence of stimulus intensity on cortical activity. Specifically, we investigated the influence of stimulus intensity on amplitude and onset time of broadband gamma power.
In our first analysis, we determined the cortical response evoked by the high and low-intensity (near perceptual-level) stimuli. For this purpose, and for each task-responsive location, we calculated the broadband gamma power response to the auditory stimulus (see Fig. 2A-B; normalized to the baseline). The analysis of this response shows that the maximum broadband gamma power evoked by high-intensity stimuli is significantly larger than that evoked by low-intensity stimuli (2.8±2.3>1.5±1.1; mean±std; Wilcoxon rank-sum test, p<0.001; see Fig. 2C). Further analysis of this response in the temporal and frontal-parietal lobe confirms that this relationship generalizes across lobes (see Fig. S4B and Table 1).
Table 1.
Effect of stimulus intensity on magnitude and onset time of broadband gamma power response.
| Broadband Gamma Characteristic | Electrode Location | r | Proportion of Variance Explained |
|---|---|---|---|
|
| |||
| Broadband gamma power | all | 0.28 | 8% |
| temporal lobe | 0.46 | 21% | |
| Frontal-parietal lobe | 0.31 | 10% | |
|
| |||
| Median onset time | all | −0.23 | 5% |
| temporal lobe | −0.44 | 19% | |
| Frontal-parietal lobe | −0.29 | 8% | |
|
| |||
| Standard deviation of onset time | all | −0.28 | 8% |
| temporal lobe | −0.37 | 13% | |
| Frontal-parietal lobe | −0.33 | 10% | |
In addition to quantifying the magnitude of the response, we also quantified the variance in this response that can be attributed to the intensity of the auditory stimuli. To do this, we calculated the correlation coefficient between a concatenated vector of broadband gamma power in response to low/high-intensity stimuli with a corresponding label (i.e., 0 for low and 1 for high intensity). The result of our analysis shows that 7.9% of the variance in broadband gamma power can be explained by the intensity of the presented sound stimulus (Spearman’s r=0.28, p≪0.001). Further analysis revealed that this relationship is most prominent in the temporal lobe (21%, r=0.46, p≪0.001), followed by the frontal-parietal lobe (10%, r=0.31, p<0.001, see Table 1).
In our next analysis, we determined the onset time of cortical activity in response to the auditory stimulus. For this purpose, we used a modified version of the method introduced in Coon et al. 2016 and Coon and Schalk 2016. In this method, the onset time is determined as the time when broadband gamma power exceeds a location-specific threshold (see section Single-trial broadband gamma onset detection for details). We applied this modified method to the broadband gamma responses.
The analysis of the detected onset times for low- and high-intensity stimuli shows that, high-intensity stimuli evoke a faster and less variable broadband gamma response than low-intensity stimuli (average median onset time: 247±128 ms<312±143 ms; average standard deviation of onset time: 124±58 ms<167±74 ms; mean±std; Wilcoxon rank-sum test; p<0.001; see Fig. 2D-E).
In addition to determining the mean and standard deviation of the broadband gamma onset times, we also quantified the variance in the onset time that can be attributed to the intensity of the auditory stimuli.
To accomplish this, we calculated the correlation coefficient between a concatenated vector of median broadband gamma onset time in response to low/high stimuli with a corresponding label (i.e., 0 for low and 1 for high intensity). We performed this analysis on both the median and the standard deviation of detected onset times. Our results show that 6% of variations in the median of onset time (Spearman’s r=−0.24, p<0.001) and 8% of variations in the standard deviation of onset time (r=−0.28, p<0.001) can be explained by stimulus intensity. Further analysis revealed that this relationship is most prominent in the temporal lobe (median: 19%, r=−0.44, p≪0.001; standard deviation: 13%, r=−0.37, p<0.001) followed by the frontal-parietal lobe (median: 8%, r=−0.29, p<0.01; standard deviation: 10%, r=−0.33, p<0.001, see Table 1).
Finally, we were interested in the effect of stimulus intensity on the behavioral response. Subjects responded to almost all of the high-intensity stimuli (94±6%), but only to approximately half of the low-intensity stimuli (56±12%; mean±std). As expected (Raab, 1962, Raab and Fehrer, 1962, Kohfeld, 1971, Ulrich et al., 1998, Schlittenlacher and Ellermeier, 2015, Kurylo et al., 2015), the response to high-intensity stimuli was faster and less variable (529±184 ms < 605±207 ms; Wilcoxon rank-sum test, p<0.001; mean±std; Fig. 2F). Both reaction times and variance are within the range of what has been reported in the literature for similar studies (Sadaghiani et al., 2009, Zoefel and Heil, 2013, Humes and Ahlstrom, 2014).
We also quantified the amount of variance in reaction time that can be attributed to the intensity of the auditory stimuli. To accomplish this, we calculated the correlation coefficient between a concatenated vector of reaction time in response to low/high and a corresponding label (i.e., 0 for low and 1 for high intensity). Our results show that only 4% of variations in reaction time (Spearman’s r=−0.20, p<0.01) can be explained by stimulus intensity.
3.2. Transmission of sensory activity from sensory cortex to motor cortex
We were interested in the propagation of cortical activity from auditory to motor cortex. Specifically, we investigated the likelihood of cortical activity evocation in each task-responsive location during hit and miss trials. We performed this analysis for each location in two steps. In the first step, we detected the onset time of the broadband gamma power in each trial (see section Single-trial broadband gamma onset detection for details). In the second step, we quantified the likelihood of cortical activity evocation using the onset detections of broadband gamma power.
The results in Fig. 3A show the results of the first step of our analysis, i.e., the detected onset times and the transmission of cortical activity throughout the cortex for a representative low-intensity hit-trial. This is further quantified in Fig. S5 for all locations and all subjects in response to high- and low-intensity stimuli. These results suggest a propagation of cortical activity from auditory cortex to motor cortex.
Figure 3. Cortical activity during hit and miss trials.

(A) The cortical surface on the top shows electrode coverage (black dots) and cortical locations (white circles) activated in response to the high-intensity auditory stimulus for subject D. Yellow lines indicate the central sulcus and Sylvian fissure. The traces on the bottom show a representative example of the cortical activity during a hit trial for five locations in this subject. Black arrows indicate the detected cortical activity onset time (Coon et al., 2016, Coon and Schalk, 2016). (B) Cortical activity is more likely to be evoked during hit trials (orange bar) than during miss trials (blue bar) (***: p<0.001, Wilcoxon rank-sum test, across all subjects). (C) Cortical activity onset occurs earlier for hit (orange) trials than miss (blue) trials (**: p<0.01, Wilcoxon rank-sum test, across all subjects and electrodes, normalized to mean onset time within each electrode). (D) For trials in which cortical activity is evoked, hit (orange) and miss (blue) trials evoked the same peak amplitude (p>0.05, Wilcoxon rank-sum test, across all subjects and electrodes, time-locked to activity onset).
To validate that our onset detections are accurate, we performed two control analyses. In the first control analysis, we validated that the variability of the onset time steadily increases throughout the trajectory from auditory to motor cortex, as originally described in (Coon and Schalk, 2016). Indeed, we found that the standard deviation of onset time is significantly correlated with median broadband gamma onset time (r = 0.55, p<0.001). In the second control analysis, we validated that onset time is explained by reaction time in the parietal lobe, but not in the temporal lobe (Coon et al., 2016, Brumberg et al., 2016, Chang et al., 2011, Leuthardt et al., 2012). To test this, we first calculated the correlation between onset time and reaction time for each electrode location. Next, we calculated the correlation between this correlation value and the median onset time. The result of this analysis shows that the onset time is increasingly explained by reaction time, the closer the electrode location is to the frontal-lobe (r = 0.4, p<0.001).
In the second step of our analysis, we first determined the likelihood of cortical activity evocation for each location throughout the task. We calculated this likelihood as the portion of trials during which broadband gamma onset was detected. Fig. 3B shows the results of this analysis, specifically that the detection rate for hit trials was significantly higher than that for miss trials (78.8±15% > 51.9±21%; mean±std, p≪0.001, Wilcoxon rank-sum test). Further, Fig. 3C shows that hit trials are detected earlier than miss trials (Wilcoxon rank-sum test, p<0.01). In a control analysis, we ruled out that this difference in detection rate is related to the magnitude of the broadband gamma power response. Fig. 3D shows that hit and miss trials evoked the same peak broadband gamma response (Wilcoxon rank-sum test, p>0.05).
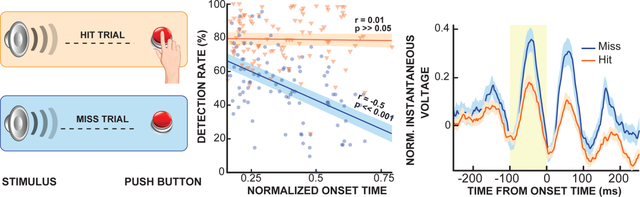
Next, we tested our first hypothesis, i.e., that the absence of a behavioral response to the stimulus is related to a disruption in the flow of cortical activity from sensory to motor cortex. To accomplish this, we determined the relationship between onset time and detection rate of cortical activity throughout the cortex for hit and miss trials. We first calculated the median onset time. While all subjects had electrodes placed over motor cortex, the extent of this coverage, and thus also the obtained maximum median onset time varied across subjects. Further, reaction-time also varied across subjects. We thus normalized the median onset time to the 90th percentile of each each subject’s reaction time to account for the effect of inter-subject variability in electrode coverage and reaction time. Then, we computed the correlation coefficient between the normalized median onset time and detection rate of all locations and all subjects. The results of our analysis shows that broadband gamma onset detection rate decreases from early activated to late activated electrodes for miss trials (Spearman’s r = −0.5, p≪0.001) but not for hit trials (Spearman’s r=0.01, p≫0.05) (Fig. 4 and Fig. S6). In other words, transmission of sensory activity from auditory to motor cortex is disrupted in miss trials but not in hit trials.
Figure 4. Propagation of cortical activity from auditory to motor cortex.

Cortical activity during miss trials is decreasingly less likely to occur as it traverses from early activated auditory to later activated motor cortex (blue trace, Spearman’s r = −0.5, p≪0.001). In contrast, the likelihood of cortical activity during hit trials remains stable throughout the cortex (red trace, Spearman’s r = 0.01, p≫0.05, across all subjects and electrodes, semi-transparent area indicates 95th percentile confidence interval).
Our results in Fig. 4 make the assumption that the onset time steadily increases from auditory to motor cortex. To verify that this is indeed the case, we performed a control analysis in which we substituted the median onset time with the correlation between onset and reaction time. It is known that this correlation is small in auditory cortex, and large in motor cortex (Coon et al., 2016, Brumberg et al., 2016, Chang et al., 2011, Leuthardt et al., 2012). The results of this analysis confirm that the likelihood of cortical activity decreases from auditory to motor cortex in miss trials (r=−0.34, p<0.001) but not in hit trials (r=0.14, p>0.05).
To rule out the possibility that our results in Fig. 4 are due to chance, we performed a permutation test. In this, we performed our entire analysis 1000 times on randomly assigned hit and miss trials. This yielded two distributions of r-values, one for hit and one for miss trials. We determined the significance of our true r-values in Fig. 4, by scoring them against these distributions. The correlation coefficient calculated for miss trials was significantly smaller (p<0.01) and correlation coefficient of hit trials was significantly larger than chance (p<0.001). The results of this control analysis unequivocally confirm that our results in Fig. 4 are significant and, thus, that cortical activity evocation decreases from auditory to motor cortex in miss trials but not in hit trials.
3.3. Variations in cortical excitability can explain the disruption in transmission of sensory activity
In our next analysis, we tested our second hypothesis, i.e., that the disruption in the flow of cortical activity from sensory to motor cortex is related to variations in cortical excitability.
Specifically, we tested whether the instantaneous voltage (i.e., a measure of cortical excitability) in the 100-ms long information arrival window (i.e., one cycle of alpha oscillation at 10 Hz) before cortical onset is a predictor of whether a trial will be responded to or not (i.e., hit/miss).
For this, we first established that instantaneous voltage is indeed a good predictor of cortical excitability. The results in Fig. S7 demonstrate that instantaneous voltage is a better predictor of cortical excitability than alpha power (0.88 > 0.7, Spearman’s r2, p≪0.001). Next, we determined whether cortical excitability in the 100ms-long information arrival window is a predictor of whether a trial will be responded to or not. The results in Fig. 5A show the normalized instantaneous voltage for all locations, and all subjects time-locked to the cortical activity onset for hit and miss trials. (Schalk et al. 2017, Schalk 2015, see section Signal processing for details of the method). The results in Fig. 5B shows that the normalized instantaneous voltage in the 100ms-long information arrival window is significantly higher for miss trials than for hit trials (0.13±0.22 > 0.05±0.16, mean±std, Wilcoxon rank-sum, p<0.01). This suggests that instantaneous voltage and thus cortical excitability is a predictor of whether a trial will be responded to or not. Next, we were interested in determining whether this is localized to the temporal or frontal-parietal lobe. For this, we calculated the normalized instantaneous voltage for temporal and frontal-parietal electrodes separately. The results in Fig. 6 show that pre-onset instantaneous voltage within the frontal-parietal lobe is significantly higher during miss trials compared to hit trials (0.11±0.19 > −0.008±0.12, mean±std, Wilcoxon rank-sum, p<0.001). In contrast, pre-onset instantaneous voltage within the temporal lobe is comparable during hit and miss trials (0.11±0.13 ≈ 0.12±0.2, mean±std, Wilcoxon rank-sum, p>0.05). This implies that insufficient cortical excitability in frontal-parietal lobe is, in part, responsible for the absence of a behavioral response.
Figure 5. Cortical excitability at the time of cortical activity onset.

(A) Instantaneous voltage (as a marker of neural population excitability) for hit (orange) and miss (blue) trials with a detectable cortical activity onset, time-locked to the cortical activity onset time of each trial, and averaged across all subjects and electrodes. Yellow area depicts the estimated 100ms-long information arrival window (i.e., one cycle of alpha oscillation at 10 Hz) before cortical activity onset. (B) Within this window, instantaneous voltage is smaller for hit (orange bar) trials than for miss trials (blue bar). Thus, cortical excitability before cortical activity onset is higher for hit trials than for miss trials (**: p<0.01, Wilcoxon rank-sum).
Figure 6.

Average instantaneous voltage, time-locked to cortical activity onset, during hit and miss trials with a detectable cortical activity onset for electrodes within (A) temporal lobe and (B) frontal-parietal lobe. (C) Average instantaneous voltage throughout the 100ms-long window preceding cortical activity onset (i.e., yellow area in A and B). Instantaneous voltage preceding cortical onset during hit trials is significantly lower within frontal-parietal cortex (***: p<0.001), but not within temporal cortex (p>0.05, Wilcoxon rank-sum test).
To rule out the possibility that our result in Fig. 5B is due to chance, we performed a permutation test. In this, we performed our entire analysis 1000 times on randomly assigned hit and miss trials. This yielded a distribution of p-values. We determined the significance of our true p-value in Fig. 5B, by scoring it against this distribution. The results of this control analysis unequivocally confirm that our result in Fig. 5B is significant and, thus, that cortical excitability is a predictor of whether a trial will result in a behavioral response (p<0.05).
In a control analysis, we verified that our findings generalize to alpha power, i.e., an established measure of cortical excitability (Pfurtscheller et al., 1996, Foxe et al., 1998, Jensen and Mazaheri, 2010, de Pesters et al., 2016). The result of this control analysis shows that alpha power in the 100-ms prior to cortical onset is higher for miss trials than for hit trials (0.17±47 > 0.01±0.37, paired t-test, p<0.01; Fig. S8). Further analysis revealed that this finding is specific to the frontal-parietal lobe (p<0.01, paired t-test; Fig. S16). Thus, this control analysis further supports our finding that cortical excitability is a predictor of whether a trial results in a behavioral response.
4. Discussion
In this study, we explored the cortical physiology that governs the behavioral variability in the response to external stimuli. Specifically, we investigated the role of oscillations in the propagation of cortical activity from auditory to motor cortex. For this purpose, we recorded electrocorticographic signals from six human subjects while they performed an auditory reaction-time task. The auditory stimuli in this task were calibrated to be around the perceptual-level and thus resulted in the expected behavioral variability, i.e., hit and miss trials. The analysis of the electrocorticographic signals revealed that: 1) the transmission of perceptual-level sensory activity throughout the cortex is disrupted in miss trials but not in hit trials; and 2) cortical excitability, quantified by instantaneous voltage, directly governs the likelihood of this disruption. This implies that neural consequences of spontaneous fluctuations in neuronal excitability cause loss of behavioral reaction to the perceptual-level sound. The following sections discuss these findings in the context of the preexisting literature.
Previous studies that investigated behavioral variability in the response to external stimuli focused on the role of phase synchronization on information transfer throughout the cortex. Phase synchronization is considered to be a facilitator of information transfer throughout the cortex (Fries, 2005), and its absence might inhibit information transfer and thus result in a miss trial. Indeed, these studies have shown that gamma phase synchronization and connectivity across distant cortical sites are stronger during hit trials than during miss trials (Melloni et al., 2007, Gaillard et al., 2009). Our results expand on this by showing that cortical activity is less likely to be evoked during miss trials compared to hit trials, and that the likelihood of cortical evocation steadily decreases throughout the cortex for miss trials.
Previous studies that measured brain activity using EEG, ECoG, fMRI, MEG, and single-unit recording, all have shown that a cortical activity evoked during hit trials is larger than that during miss trials (Palmer et al., 2007, Melloni et al., 2007, Quiroga et al., 2008, Sadaghiani et al., 2009, Fisch et al., 2009, Gaillard et al., 2009). This is in agreement with our findings (Wilcoxon signed rank-sum test, p≪0.001).
The effect of cortical excitability on the probability of detecting perceptual-level stimuli has not been fully resolved. Several studies found that cortical excitability (as indexed by the power and phase of ongoing low-frequency oscillations) during the pre-stimulus period modulates the probability of detecting perceptual-level stimuli (Hesselmann et al., 2008, Monto et al., 2008, Busch et al., 2009, Ruhnau et al., 2014, Gutnisky et al., 2017, Kyriakatos et al., 2017, Rickard et al., 2018). However, reproducing these results has proven to be difficult, and no consensus has been reached on the role of pre-stimulus cortical excitability in the probability of detecting perceptual-level stimuli (Gross et al., 2004, De Lafuente and Romo, 2005, Dehaene and Changeux, 2011, Zoefel and Heil, 2013, Sachidhanandam et al., 2013, Yang et al., 2016, Sederberg et al., 2019).
We also attempted to reproduce these results. Fig. S9 shows the alpha oscillations in the temporal and frontal-parietal lobes for hit and miss trials during the estimated 100 ms-long information arrival window (i.e., one cycle of alpha oscillation at 10 Hz). This figure shows that hit and miss trials exhibit similar alpha amplitudes for temporal and frontal-parietal locations (Wilcoxon rank-sum, p>0.05); however, hit and miss trials exhibit similar phase only within the frontal-parietal but not the temporal locations (circular Kruskal-Wallis test, p<0.01, p>0.05, see Berens 2009 for details). While a previous EEG-study showed that auditory perception is not phase-dependent (Zoefel and Heil, 2013), our study suggests that this might vary between temporal and frontal-parietal lobe.
The difficulty in reproducing these results may be related to the definition of the pre-stimulus time period. Previous studies defined the pre-stimulus period as the 500 ms period preceding the stimulus onset. This is problematic as this does not consider the variability in the cortical activity onset that steadily increases from auditory to motor cortex (see Fig. 2). In our study, we tested this hypothesis. Specifically, we determined the effect of cortical excitability (as indexed by instantaneous voltage and alpha power) on the subject’s ability to detect the perceptual-level stimuli during the 500 ms period preceding the stimulus onset, and during the 100 ms period preceding the cortical activity onset. This analysis unequivocally confirmed that the period preceding the cortical activity onset is predictive of the subject’s ability to detect the perceptual-level stimuli (see Fig. 5), while the period preceding the stimulus onset is not (Wilcoxon rank-sum test, p>0.05).
4.1. Control analyses
4.1.1. Choice of task and baseline periods
We had some concerns that our choice of task and baseline periods, as well as the range for the optimal electrode-specific threshold, might have affected our results. To reject this possibility, we performed two control analyses.
In our first control analysis, we increased the task and baseline periods to 1 sec. The results of our first control analysis, i.e., the likelihood that cortical activation decreases from auditory to motor cortex, was in substantial agreement with that of our main analysis (miss trials: Spearman’s r=−0.49, p≪0.001; hit trials: Spearman’s r=−0.07, p>0.05). Moreover, cortical excitability as measured by instantaneous voltage (Paired t-test, p<0.01) and alpha power (Paired t-test, p<0.001) was significantly lower during miss trials than during hit trials.
In our second control analysis, we limited the range for the optimal electrode-specific threshold to 1 to 15 z-scores above baseline broadband gamma power. The results of our second control analysis, i.e., the likelihood that cortical activation decreases from auditory to motor cortex, was in substantial agreement with that of our main analysis (miss trials: Spearman’s r=−0.35, p≪0.001; hit trials: Spearman’s r=−0.1, p>0.05). Moreover, cortical excitability as measured by instantaneous voltage (Paired t-test, p<0.01) and alpha power (Paired t-test, p<0.05) was significantly lower during miss trials than during hit trials.
In summary, the results of our two control analyses unequivocally reject the possibility that the choice of task and baseline periods, as well as the range for the optimal electrode-specific threshold, has affected our results.
4.1.2. Choice of frequency bands
We had some concerns that our choice of 8–12 Hz for alpha oscillations as a measure for cortical excitability, and the 70–170 Hz for broadband gamma as a measure of population-level activity might have affected our results. To reject this possibility, we performed three control analyses.
In our first control analysis, we calculated the power spectral density for electrodes within the temporal and frontal-parietal lobe. After removal of the 1/f component, the results of this analysis in Fig. S12 demonstrate a spectral power peak within the 8–12 Hz band that we chose for this study.
In our second control analysis, we calculated time-frequency maps for the cortical activity for the 500 ms periods prior and after stimulus-onset for hit and miss trials. The results of this analysis in Fig. S14 demonstrate significant broadband gamma activity increases within the 70–170 Hz band that we chose for this study. This also confirms the results shown in Fig. 4, which shows that cortical activity during miss trials is decreasingly less likely to occur as it traverses from early activated temporal lobe to later activated frontal-parietal lobe. In line with this finding, the results in Fig. S14 show that temporal locations exhibit equal broadband gamma power activity (i.e., power increase in the 70–170 Hz band) for both hit and miss trials, while frontal locations exhibit higher broadband gamma activity in hit trials when compared to miss trials.
In our third control analysis, we determined whether our finding that cortical excitability prior to activity onset is higher during hit than during miss trials (see Fig. 6) is specific to the 8–12 Hz alpha-band. For this purpose, we performed a control analysis in which we used a 4–8 Hz theta-band filter of the same order to calculate the instantaneous voltage and theta power. The results of this analysis in Fig. S12, confirm our primary results in Fig. 6. However, within frontal-parietal lobe these results also show that the 8–12 Hz alpha-band yields a more significant difference in cortical excitability than the 4–8 Hz theta-band. This is in line with the literature that suggests that alpha-band power within the frontal-parietal lobe is related to behavioral variability in perception-threshold tasks (Hanslmayr et al., 2007, Sauseng et al., 2009, Busch et al., 2009).
4.1.3. Choice of narrow-band filtering parameters
To reject the possibility that our results may be contaminated by post-stimulus activity that is smeared back in time by the 8–12 Hz narrow-band filtering, we repeated the analyses presented in our manuscript using a 4–40 Hz wide-band filter of the same order. The use of a wide-band filter has the intrinsic advantage that it preserves the frequency and amplitude information of the original signal, which makes it less susceptible to smearing information back in time (see Fig. S17). The results of this control analysis are shown in Fig. S11 and confirm those of our primary analysis, i.e., that instantaneous voltage preceding cortical onset during hit trials is significantly lower within frontal-parietal cortex (p<0.001), but not within temporal cortex (p>0.05, Wilcoxon rank-sum test); and that low-frequency power preceding cortical onset during hit trials is significantly lower within frontal-parietal cortex (p<0.001), but not within temporal cortex (p>0.05, Wilcoxon rank-sum test).
4.2. Simplified model of information transmission
There are currently three main models that attempt to explain the role of cortical oscillations on information transmission across neuronal populations: 1) gating-by-inhibition (GBI, Jensen and Mazaheri 2010); 2) communication-through-coherence (CTC, Fries 2005); and 3) function-through-biased-oscillations (FBO, Schalk 2015). These models are based on different features of the underlying brain signals, e.g., power for GBI, phase for CTC; and instantaneous voltage for FBO. There is evidence that GBI and CTC are merely different sides of the same coin and that FBO is a more accurate predictor of cortical information transfer (see Schalk et al. 2017, Schalk 2015; and Fig. S7). The FBO hypothesis suggests that the biased instantaneous voltage of cortical oscillations reflects neuronal excitability and that it gates the flow of information throughout the cortex. Prior to this study, the effect of the biased instantaneous voltage on the flow of information throughout the cortex was not fully understood. The results of this study thus contribute to the validation of the FBO hypothesis and expand our understanding of how FBO can explain behavioral variability. We summarized this expanded understanding of FBO in a simplified model of instantaneous voltage gating cortical activity. In this model, high-intensity stimuli evoke cortical activity irrespective of the instantaneous voltage, while low-intensity stimuli evoke cortical activity only if the instantaneous voltage is low but not if it is high (see Fig. 7).
Figure 7. Simplified model of instantaneous voltage gating cortical activity.

Panels (A-D) present cortical activity gated by low (left) and high (right) instantaneous voltage for high (top) and low (bottom) intensity stimuli. (A,B) High intensity stimuli evoke cortical activity irrespective of the instantaneous voltage. (C) Low-intensity stimuli evoke cortical activity only if the instantaneous voltage is low, (D) but not if it is high. Red arrow represents the time of stimulus onset or information arrival.
In our simplified model, low-intensity stimuli evoke cortical activity only when instantaneous voltage is low, and therefore cortical excitability is high. This is based on our results in Fig. 5B, which shows that the cortical excitability before cortical activity onset is a predictor of whether perceptual-level stimuli will be attended to or not. In concordance with Schalk (2015), this suggests that predictive variations in asymmetric slow oscillations provide a simple and general model for information routing that can help to explain brain function.
4.3. Where does sensory information get lost?
We were interested in understanding where on its path from the cochlear to motor cortex, the response to perceptual-level stimuli is interrupted. Specifically, we were interested in determining whether the subjects did not perceive the perceptual-level stimuli, or whether its transmission from auditory to motor cortex was interrupted. For this purpose, we performed two analyses in which we compared cortical excitability and activation between temporal and frontal-parietal lobe in hit and miss trials.
In our first analysis, we compared the likelihood of cortical activation (i.e., detection rate) between temporal and frontal-parietal lobe, and between hit and miss trials in response to perceptual-level stimuli. The results of the comparison between hit and miss trials show that while miss trials exhibit a significant reduction in the likelihood of cortical activation within the temporal lobe, the majority of trials still evoked a cortical activity (miss: 58±17% < hit: 78±14%, mean±std, Wilcoxon rank-sum test, p<0.001).
For trials in which cortical activity is evoked, hit and miss trials evoked the same peak amplitude (p>0.05, Wilcoxon rank-sum test, across all subjects and electrodes, time-locked to activity onset). However, broadband gamma power was significantly higher for hit trials immediately before and following the detected cortical activity onset (see Fig. S15, Wilcoxon rank-sum test, p>0.05, Bonferroni corrected for multiple comparisons). The observed increased cortical activity for hit trials immediately following the detected cortical activity onset might be related to processes in supragranular layers of the cortex (Leszczyński et al., 2020). Lack of such activity in supragranular layers of the cortex may further inhibit the progression of cortical activity downstream and thus the observed loss of information transfer during miss trials. Similarly, the observed increase in broadband gamma activity immediately prior to the detected onset may reflect information transfer from the previous processing node (see Fig. S15).
This reduction is much more prominent in the frontal-parietal lobe (miss: 45±21% < hit: 80±15%, mean±std, Wilcoxon rank-sum test, p≪0.001). The results of the comparison between temporal and frontal-parietal lobe shows that the likelihood of cortical evocation for hit trials did not decrease from temporal to frontal-parietal lobe (temporal: 78±14% ≈ frontal-parietal: 80±15%, mean±std, Wilcoxon rank-sum test, p>0.05). In contrast, the likelihood for miss trials significantly decreased from temporal to frontal-parietal lobe (temporal: 58±17% < frontal-parietal: 45±21%, mean±std, Wilcoxon rank-sum test, p<0.01, Fig. S6). In summary, this analysis suggests that the temporal lobe is activated in the majority of the miss and hit trials, however that this activation is not transmitted to the motor cortex during miss trials.
In our second analysis, we compared the cortical excitability between temporal and frontal-parietal lobe, and between hit and miss trials in response to perceptual-level stimuli. For this purpose, we calculated the average of the instantaneous voltage during the 100 ms period preceding the cortical activation for hit and miss trials, and for temporal and frontal-parietal lobes. The result of this comparison shows that hit and miss trials exhibit comparable cortical excitability within the temporal lobe (hit: 0.11±0.13 ≈ miss: 0.12±0.2, mean±std, Wilcoxon rank-sum test, p>0.05). In contrast, cortical excitability is markedly smaller in miss trials than in hit trials (i.e., a higher average of the average instantaneous voltage) within the frontal-parietal lobes (miss: 0.11±0.19 > hit: −0.008±0.12, mean±std, Wilcoxon rank-sum test, p<0.01, Fig. 6). The results of the comparison between temporal and frontal-parietal lobe shows that hit trials exhibit a significantly increased excitability (temporal: 0.11±0.13 > frontal-parietal: −0.008±0.12, mean±std, i.e., a lower average of the average instantaneous voltage) in the frontal-parietal lobe when compared to the temporal lobe (Wilcoxon rank-sum test, p≪0.001). In contrast, miss trials exhibit a comparable cortical excitability within the frontal-parietal and the temporal lobe (temporal: 0.12±0.2 ≈ frontal-parietal: 0.11±0.19, mean±std, Wilcoxon rank-sum test, p>0.05, Fig. 6).
In summary, these two analyses show that within the temporal lobe, most hit and miss trials evoke a cortical response, while within the frontal-parietal lobe, most hit and only a few miss trials evoke such a response. These analyses also show that cortical excitability is increased in the frontal-parietal lobe during hit trials but not during miss trials. In other words, auditory cortex generates a response to perceptual-level stimuli, but for miss trials, this response is interrupted on its path from auditory to motor cortex. This path from auditory to motor cortex can be direct via anatomical projections from auditory cortex to motor cortex (Scheich et al., 2007, Huang et al., 2019), or indirect, via cortical association areas (Lima et al., 2016). For both of these pathways, this interruption may be related to insufficient cortical excitability within the frontal-parietal lobe during miss trials.
4.4. Alternative approaches
4.4.1. Gamma phase synchronization
Gamma phase synchronization is an alternative approach to investigating behavioral variance (Melloni et al., 2007, Gaillard et al., 2009). However, in our study we specifically focused on investigating the causes of the disruption in information flow. To accomplish this, we needed to estimate the neural information arrival time for each location, and thus determine cortical activity onset in single trials. Hence, using broadband gamma onset detections for single trials allowed us to not only determine the presence of a disruption in information flow, but also to determine that this disruption is in part caused by insufficient cortical excitability. In contrast, if we had used gamma synchronization in our investigation, we could only show that information transmission during miss trials is weaker compared to hit trials.
4.4.2. Effect of cortical excitability on reaction-time
While many studies have investigated the role of cortical oscillations preceding auditory or visual stimuli on behavioral variance, (Gunduz et al., 2011, 2012, Nourski et al., 2021), these studies did either not investigate or did not find a significant relationship between cortical excitability and reaction-time. In line with these studies, we neither found a significant effect of pre-stimulus alpha power (Spearman’s r=−0.04, p>0.05) nor of pre-stimulus instantaneous voltage on reaction time (Spearman’s r = −0.06, p>0.05). The results of a recent intracranial study that used similar single-trial methods to investigate the relationship between cortical excitability and cortical activity may explain the difficulty in demonstrating such a relationship (Paraskevopoulou et al., 2021). This study shows that reaction time variance may primarily be due to the latencies in specific brain regions and demonstrates that reaction-time variance is accumulated across the whole task-related cortical network. The results of this study show that population-level neural activity monotonically increases prior to movement execution, and that trial-by-trial changes in that increase are accounted for by inhibitory activity indexed by low-frequency oscillations. These results suggest that investigation of the effect of cortical excitability on reaction-time variances requires single-trial analysis.
4.5. Limitations of the study
4.5.1. Task design
The task presented in this study could be considered as a variant of a recognition reaction-time task, more commonly known as go/no-go task. In a go/no-go task, subjects respond to a particular stimulus (“go”) and withhold response to the other stimuli (“no go”). Our study used the subjects’ performances during this task to investigate variability in human behavioral response. On the other hand, as our study presented stimuli at the perception threshold, our task could also be considered as a perceptual task. In a perceptual task, trials vary by whether a stimulus is presented or not. In our experiment, similar to perceptual tasks, there were trials during which no stimulus was presented (“catch trials”). However, due to the limited number of catch trials (i.e., 15% of all trials), our study is unable to investigate perceptual decision-making mechanisms. Future studies could build upon our results to determine whether the effect on hit rate reflects sensitivity or criterion in decision-making, i.e., a topic has been a subject of recent debate (Samaha et al., 2020).
4.5.2. Electrode Coverage
While all patients in this study had electrodes placed within the vicinity of their auditory and motor cortex (see Fig. S1), grid placement was solely determined by clinical need. As a consequence, cortical coverage varied in location and density across subjects. Grid placement was further limited to the lateral surface of the temporal and frontal-parietal lobes that is accessible to grids. Because of that, we could not observe early auditory activity within the core auditory cortex. This limitation constrained our ability to observe the early disruption in information transfer. This is further amplified by our task design, which presents auditory stimuli at the perception level. It is thus conceivable that for some of the miss trials the information transfer was interrupted before we could observe this from the electrodes placed on the lateral surface of the temporal lobe. It should be noted though, that we detected cortical onsets in the temporal lobe for almost 60% of the miss trials (see Fig. S6).
5. Conclusion
Our study demonstrates that moment-by-moment fluctuations in cortical excitability govern the flow of sensory information from sensory to motor cortex. Thus, these fluctuations directly determine whether population-level cortical responses to sensory stimulation are transmitted to motor cortex to produce a behavioral response.
We expect that the findings of this work will help improve our understanding of the cortical mechanism underlying variability in performance of healthy people, as well as in people affected by neurological disorders. Studies have shown that intra-individual performance variability is higher in certain patient populations (e.g., patients afflicted by attention-deficit/hyperactivity disorder (ADHD)). These studies suggest inefficient and inconsistent neuronal transmission of information (Russell et al., 2006) as the underlying mechanism for this performance variability. Future studies may apply our methods to confirm these findings and better understand the flow of sensory information in people affected by neurological disorders such as ADHD. A better understanding of the underlying neural mechanism in the variability of performance may provide the basis for improving the diagnosis and treatment of these kinds of neurological disorders.
Supplementary Material
ECoG electrode locations for all 6 subjects. (A-F) ECoG electrode locations (black circles) projected onto the right hemisphere of the MNI template brain, demonstrate temporal, frontal and parietal lobe coverage in subjects A-F.
Experiment design. (A) Auditory reaction time task. (B) Psychometric function (orange) for intensity (triangles) of auditory stimulus in subject D. Dashed line represents the stimulus intensity at perception threshold, i.e., at 50% response rate. (C) Example of determining the stimulus intensity at perception threshold using the iterative Parameter Estimation by Sequential Testing (PEST) procedure (Taylor and Creelman, 1967). Intensity settings used for this subject are indicated by triangles in panel B.
Psychometric function of response rate to normalized auditory stimulus intensity across all subjects. Each dot represents the response rate to one stimulus intensity for one subject during the PEST calibration procedure (on average 16±2.1 (mean±sem) repetitions, individual subjects, normalized to perception threshold). The data conforms to a sigmoid function which validates the underlying psychometric function and thus the behavioral performance of our subjects (goodness of fit, r2 = 0.84, p ≪ 0.001).
Characteristics of detected cortical activity evoked by high and low-intensity stimulus in electrodes located within temporal and non-temporal lobes. (A) Task-related electrodes located within temporal and parietal-frontal lobes are depicted as white and gray circles, respectively. (B,C) Low-intensity stimuli elicit smaller and later onsets of broadband gamma power than high intensity stimuli. (D) Low-intensity stimuli elicit broadband gamma responses that are more variable in their onset time.
Spread of cortical activity in response to high (A) and low-intensity (B) stimuli. The color of each circle represents the normalized median onset time of the cortical activity evoked by the auditory stimulus at this location. Cortical activity spreads from early auditory cortex (dark blue) across superior temporal gyrus (light blue) to eventually reach motor cortex (red). This spread characteristic is the same in response to high as it is in response to low-intensity stimuli.
Detection rate of cortical activity evoked by low-intensity stimuli in electrodes located within and outside of the temporal lobe for hit and miss trials. Cortical activity during hit trials is equally likely to be evoked within and outside of the temporal lobe (Wilcoxon rank-sum test, p>0.05). In contrast, cortical activity during miss trials is less likely to be evoked on overall, and also much less likely to be evoked outside of the temporal lobe (Wilcoxon rank-sum test, ***: p<0.001).
Relationship between cortical excitability and population-level activity. (A) Instantaneous voltage (blue) is derived from the alpha oscillation (pink) by subtracting the alpha amplitude bias. (B,C) Relationship between alpha power, instantaneous voltage, and broadband power. Each dot represents the average normalized broadband power within one of 50 equally spaced bins of the alpha power and instantaneous voltage range, respectively. The correlation coefficient indicates that instantaneous voltage (panel C, blue line, Spearman’s r2 = 0.88, p≪0.001) is a better predictor of broadband power and thus of cortical activity than alpha power (panel B, pink line, Spearman’s r2 = 0.70, p≪0.001).
Average alpha power, time-locked to cortical activity onset, during hit and miss trials with a detectable cortical activity onset for electrodes within temporal and frontal-parietal lobes. (A) Alpha power (as an index of neural population excitability) for hit (orange) and miss (blue) trials, time-locked to the cortical activity onset time of each trial, and averaged across all subjects and electrodes. Yellow area depicts the estimated 100ms-long information arrival window (i.e., one cycle of alpha oscillation at 10 Hz) before cortical activity onset. (B) Within this window, alpha power is smaller for hit (orange bar) trials than for miss trials (blue bar). Thus, cortical excitability before cortical activity onset is higher for hit trials than for miss trials (***: p<0.001, paired t-test).
Alpha amplitude and phase for hit and miss trials with a detectable cortical activity onset shown for electrodes within temporal and frontal-parietal lobe. (A–B) Alpha oscillations for hit (orange) and miss (blue) trials, time-locked to the cortical activity onset time of each trial, and averaged across all subjects. (A) Shown for temporal, and (B) frontal-parietal lobe. Yellow area depicts the estimated 100 ms-long information arrival window (i.e., one cycle of alpha oscillation at 10 Hz) before cortical activity onset. (C) During this information arrival window, hit and miss trials exhibit similar alpha amplitude within the temporal and the frontal-parietal lobe (Wilcoxon rank-sum, p>0.05). (D) In contrast, within the same information arrival window, hit and miss trials exhibit a similar phase distribution only within the frontal-parietal but not the temporal lobe (Circular Kruskal-Wallis test, **p<0.01, p>0.05, see Berens 2009 for details).
Calculating the instantaneous voltage signal. The summation of the bias (Offsetbias, dashed yellow line) and negative amplitude envelope (SAE, red line) of the alpha oscillation (SAA, black line) comprise the instantaneous voltage signal (S’AA, cyan line).
Average instantaneous voltage and low-frequency power, time-locked to cortical activity onset, during hit and miss trials with a detectable cortical activity onset for electrodes within temporal and frontal-parietal lobe for wide-band filtered signals. To rule out the possibility that our finding that cortical excitability prior to activity onset is higher during hit than during miss trials (see Fig. 6) is a direct result of the 8–12 Hz narrow-band filtering, we performed a control analysis in which we used a 4–40 Hz wide-band filter of the same order to calculate the instantaneous voltage and alpha power. (A–B) Normalized instantaneous voltage of the 4–40 Hz wide-band-filtered signal during hit and miss trials for (A) temporal lobe and (B) frontal-parietal lobe electrodes. (C) Instantaneous voltage throughout the 100ms-long window preceding cortical activity onset (i.e., yellow area in A and B). Instantaneous voltage preceding cortical onset during hit trials is significantly lower within the frontal-parietal lobe (***: p<0.001), but not within the temporal lobe (p>0.05, Wilcoxon rank-sum test). (D–E) Normalized alpha power during hit and miss trials for (D) temporal lobe and (E) frontal-parietal lobe electrodes. (F) Low-frequency (4–40 Hz) power throughout the 100ms-long window preceding cortical activity onset (i.e., yellow area in D and E). Low-frequency power preceding cortical onset during hit trials is significantly lower within the frontal-parietal lobe (***: p<0.001), but not within the temporal lobe (p>0.05, Wilcoxon rank-sum test).
Average instantaneous voltage and low-frequency power, time-locked to cortical activity onset, during hit and miss trials with a detectable cortical activity onset for electrodes within temporal and frontal-parietal lobe for theta-band filtered signals. To determine whether our finding that cortical excitability prior to activity onset is higher during hit than during miss trials (see Fig. 6) is specific to the 8–12 Hz alpha-band, we performed a control analysis in which we used a 4–8 Hz theta-band filter of the same order to calculate the instantaneous voltage and theta power. (A–B) Normalized instantaneous voltage of the theta-band filtered signal during hit and miss trials for (A) temporal lobe and (B) frontal-parietal lobe electrodes. (C) Instantaneous voltage throughout the 167ms-long window preceding cortical activity onset (i.e., yellow area in A and B; one oscillation cycle at 6 Hz). Instantaneous voltage preceding cortical onset during hit trials is significantly lower within the frontal-parietal lobe (**: p<0.01), but not within the temporal lobe (p>0.05, Wilcoxon rank-sum test). (D–E) Normalized theta power during hit and miss trials for (D) temporal lobe and (E) frontal-parietal lobe electrodes. (F) Low-frequency (4–8 Hz) power throughout the 100ms-long window preceding cortical activity onset (i.e., yellow area in D and E). Low-frequency power preceding cortical onset during hit trials is significantly lower within the frontal-parietal lobe (*: p<0.05), but not within the temporal lobe (p>0.05, Wilcoxon rank-sum test).
Power spectral density with and without 1/f component for electrodes in temporal (left) and frontal-parietal lobe (right). (A–B) For each electrode location, and averaged across all trials, we calculated the power spectral density for the 1-second long period prior to stimulus onset (Welch PSD, see Welch 1967 for details). (C–D) Power spectral density with 1/f component removed using the FOOOF method described in Donoghue et al. 2020. (E–F) Power spectral density for hit (red) and miss (blue) trials (shaded area denote standard error).
Time-frequency maps for temporal (top) and frontal-parietal lobe (bottom). (A–B) We used the newtimef function in EEGLAB (Delorme and Makeig, 2004) to determine time-frequency maps for hit and miss trials in two representative electrode locations. Red and blue areas depict spectral power increases and decreases, respectively. White areas did not pass a significance threshold of p<0.01. Results are shown for the 500 ms periods prior and after stimulus-onset for hit (left) and miss trials (center). The right panel shows the difference between hit and miss trials. (A) Temporal locations show equal broadband gamma power activity (i.e., power increase in the 70–170 Hz band) for both hit and miss trials. (B) Frontal locations show higher broadband gamma activity in hit trials when compared to miss trials.
Normalized broadband gamma power throughout hit and miss trials. For trials in which cortical activity is evoked, hit (orange) and miss (blue) trials evoked the same peak amplitude (p>0.05, Wilcoxon rank-sum test, across all subjects and electrodes, time-locked to activity onset). However, broadband gamma power was significantly higher for hit trials immediately before and following the detected cortical activity onset (red curve, 50 ms sliding window, Wilcoxon rank-sum test, p>0.05, Bonferroni corrected for multiple comparisons).
Alpha power for hit and miss trials with a detectable cortical activity onset shown for electrodes within temporal and frontal-parietal lobe. (A–B) Alpha power for hit (orange) and miss (blue) trials, time-locked to the cortical activity onset time of each trial, and averaged across all subjects. (A) Shown for temporal, and (B) frontal-parietal lobe. Yellow area depicts the estimated 100 ms-long information arrival window (i.e., one cycle of alpha oscillation at 10 Hz) before cortical activity onset. (C) During this information arrival window, hit and miss trials exhibit similar alpha power within the temporal lobe (Wilcoxon rank-sum, p>0.05), but significantly higher alpha power for miss trials within the frontal-parietal lobe (**: p<0.01, paired t-test).
Effect of filter bandwidth on temporal smearing. We simulated the effect of an 8–12 Hz narrow-band (A) and a 4–40 Hz wide-band (B) filter on smearing the onset of a synthetic 10 Hz alpha-band oscillation. The results of this simulation confirm that wide-band filtering overcomes the temporal smearing exhibited by narrow-band filters (A) and yields a power onset that truthfully follows that of the underlying oscillation (200 trials, 10 Hz oscillation with random phase offset and additive white noise, Hilbert transform).
Highlights.
Cortical information traverses from auditory to motor cortex
Perception-level stimuli evoke a small and slower cortical response
Transmission of cortical information is disrupted for missed perception-level stimuli
Cortical disruption is related to insufficient cortical excitability
Acknowledgments
This work was supported by the NIH (R01-EB026439, U24-NS109103, U01-NS108916, P50-MH109429, P41-EB018783), the US Army Research Office (W911NF-14-1-0440) and Fondazione Neurone.
Footnotes
Competing Interests
The authors declare that they have no competing interests.
Code Availability
The MATLAB scripts and the data necessary to reproduce the results presented in this manuscript will be made available without restrictions on the National Center for Adaptive Neurotechnologies GitHub repository.
All authors read and approved the final version of the manuscript.
Data Availability
Comprehensive data-sets may be provided to interested researchers upon reasonable request to the corresponding author and approval of a data-sharing agreement by the Institutional Review Board of Albany Medical College.
References
- Baria AT, Maniscalco B, He BJ, 2017. Initial-state-dependent, robust, transient neural dynamics encode conscious visual perception. PLoS Comput. Biol. 13, e1005806. doi: 10.1371/journal.pcbi.1005806. [DOI] [PMC free article] [PubMed] [Google Scholar]
- Berens P, 2009. CircStat: A MATLAB Toolbox for Circular Statistics. J. Stat. Softw. 31, 1–21. doi: 10.18637/jss.v031.i10. [DOI] [Google Scholar]
- Berger H, 1929. Über das Elektrenkephalogramm des Menschen. Arch. Psychiatr. Nervenkr. 87, 527–570. doi: 10.1007/BF01797193. [DOI] [Google Scholar]
- Bishop GH, 1932. Cyclic changes in excitability of the optic pathway of the rabbit. Am. Physiol. Soc. 103, 213–224. doi: 10.1152/ajplegacy.1932.103.1.213. [DOI] [Google Scholar]
- Brovelli A, Ding M, Ledberg A, Chen Y, Nakamura R, Bressler SL, 2004. Beta oscillations in a large-scale sensorimotor cortical network: Directional influences revealed by Granger causality. Proc. Natl. Acad. Sci. U.S.A. 101, 9849–9854. doi: 10.1073/pnas.0308538101. [DOI] [PMC free article] [PubMed] [Google Scholar]
- Brumberg JS, Krusienski DJ, Chakrabarti S, Gunduz A, Brunner P, Ritaccio AL, Schalk G, 2016. Spatio-temporal progression of cortical activity related to continuous overt and covert speech production in a reading task. PLoS One 11, 1–21. doi: 10.1371/journal.pone.0166872. [DOI] [PMC free article] [PubMed] [Google Scholar]
- Bruneau N, Roux S, Guérin P, Garreau B, Lelord G, 1993. Auditory stimulus intensity responses and frontal midline theta rhythm. Electroencephalogr. Clin. Neurophysiol. 86, 213–216. doi: 10.1016/0013-4694(93)90010-S. [DOI] [PubMed] [Google Scholar]
- Brunner P, Ritaccio AL, Lynch TM, Emrich JF, Adam J, Williams JC, Aarnoutse EJ, Ramsey NF, Leuthardt EC, 2009. A practical procedure for real-time functional mapping of eloquent cortex using electrocorticographic signals in humans. Epilepsy Behav. 15, 278–286. doi: 10.1016/j.yebeh.2009.04.001. [DOI] [PMC free article] [PubMed] [Google Scholar]
- Buran BN, von Trapp G, Sanes DH, 2014. Behaviorally gated reduction of spontaneous discharge can improve detection thresholds in auditory cortex. J. Neurosci. 34, 4076–4081. doi: 10.1523/jneurosci.4825-13.2014. [DOI] [PMC free article] [PubMed] [Google Scholar]
- Busch NA, Debener S, Kranczioch C, Engel AK, Herrmann CS, 2004. Size matters: effects of stimulus size, duration and eccentricity on the visual gamma-band response. Clin. Neurophysiol. 115, 1810–1820. doi: 10.1016/j.clinph.2004.03.015. [DOI] [PubMed] [Google Scholar]
- Busch NA, Dubois J, VanRullen R, 2009. The phase of ongoing EEG oscillations predicts visual perception. J. Neurosci. 29, 7869–7876. doi: 10.1523/JNEUROSCI.0113-09.2009. [DOI] [PMC free article] [PubMed] [Google Scholar]
- Buzsaki G, 2006. Rhythms of the Brain. Oxford University Press. doi: 10.1093/acprof:oso/9780195301069.001.0001. [DOI] [Google Scholar]
- Buzsaki G, Draguhn A, 2004. Neuronal oscillations in cortical networks. Science 304, 1926–1929. doi: 10.1126/science.1099745. [DOI] [PubMed] [Google Scholar]
- Chang EF, Edwards E, Nagarajan SS, Fogelson N, Dalal SS, Canolty RT, Kirsch HE, Barbaro NM, Knight RT, 2011. Cortical spatio-temporal dynamics underlying phonological target detection in humans. J. Cogn. Neurosci. 23, 1437–1446. doi: 10.1162/jocn.2010.21466. [DOI] [PMC free article] [PubMed] [Google Scholar]
- Coon WG, Gunduz A, Brunner P, Ritaccio AL, Pesaran B, Schalk G, 2016. Oscillatory phase modulates the timing of neuronal activations and resulting behavior. NeuroImage 133, 294–301. doi: 10.1016/j.neuroimage.2016.02.080. [DOI] [PMC free article] [PubMed] [Google Scholar]
- Coon WG, Schalk G, 2016. A method to establish the spatiotemporal evolution of task-related cortical activity from electrocorticographic signals in single trials. J. Neurosci. Methods. 271, 76–85. doi: 10.1016/j.jneumeth.2016.06.024. [DOI] [PMC free article] [PubMed] [Google Scholar]
- De Lafuente V, Romo R, 2005. Neuronal correlates of subjective sensory experience. Nat. Neurosci. 8, 1698–1703. doi: 10.1038/nn1587. [DOI] [PubMed] [Google Scholar]
- Dehaene S, Changeux JP, 2011. Experimental and theoretical approaches to conscious processing. Neuron 70, 200–227. doi: 10.1016/j.neuron.2011.03.018. [DOI] [PubMed] [Google Scholar]
- Dehaene S, Naccache L, Cohen L, Bihan DL, Mangin JF, Poline JB, Rivière D, 2001. Cerebral mechanisms of word masking and unconscious repetition priming. Nat. Neurosci. 4, 752–758. doi: 10.1038/89551. [DOI] [PubMed] [Google Scholar]
- Delorme A, Makeig S, 2004. EEGLAB: an open source toolbox for analysis of single-trial EEG dynamics including independent component analysis. J. Neurosci. Methods. 134, 9–21. doi: 10.1016/j.jneumeth.2003.10.009. [DOI] [PubMed] [Google Scholar]
- Donoghue T, Haller M, Peterson EJ, Varma P, Sebastian P, Gao R, Noto T, Lara AH, Wallis JD, Knight RT, Shestyuk A, Voytek B, 2020. Parameterizing neural power spectra into periodic and aperiodic components. Nat. Neurosci. 23, 1655–1665. doi: 10.1038/s41593-020-00744-x. [DOI] [PMC free article] [PubMed] [Google Scholar]
- Fechner GT, 1860. Elemente der Psychophysik. Leipzig: Breitkopf & Härtel. [Google Scholar]
- Fisch L, Privman E, Ramot M, Harel M, Nir Y, Kipervasser S, Andelman F, Neufeld MY, Kramer U, Fried I, Malach R, 2009. Neural “ignition”: Enhanced activation linked to perceptual awareness in human ventral stream visual cortex. Neuron 64, 562–574. doi: 10.1016/j.neuron.2009.11.001. [DOI] [PMC free article] [PubMed] [Google Scholar]
- Foxe JJ, Simpson GV, Ahlfors SP, 1998. Parieto-occipital approximately 10 Hz activity reflects anticipatory state of visual attention mechanisms. Neuroreport 9, 3929–3933. doi: 10.1097/00001756-199812010-00030. [DOI] [PubMed] [Google Scholar]
- Fries P, 2005. A mechanism for cognitive dynamics: Neuronal communication through neuronal coherence. Trends Cogn. Sci. 9, 474–80. doi: 10.1016/j.tics.2005.08.011. [DOI] [PubMed] [Google Scholar]
- Gaillard R, Dehaene S, Adam C, Clemenceau S, Hasboun D, Baulac M, Cohen L, Naccache L, 2009. Converging intracranial markers of conscious access. PLoS Biol. 7, e61. doi: 10.1371/journal.pbio.1000061. [DOI] [PMC free article] [PubMed] [Google Scholar]
- Garner WR, Miller GA, 1947. The masked threshold of pure tones as a function of duration. J. Exp. Psychol. 37, 293–303. doi: 10.1037/h0055734. [DOI] [PubMed] [Google Scholar]
- Gross J, Schmitz F, Schnitzler I, Kessler K, Shapiro K, Hommel B, Schnitzler A, 2004. Modulation of long-range neural synchrony reflects temporal limitations of visual attention in humans. Proc. Natl. Acad. Sci. U.S.A. 101, 13050–13055. doi: 10.1073/pnas.0404944101. [DOI] [PMC free article] [PubMed] [Google Scholar]
- Gunduz A, Brunner P, Daitch A, Leuthardt EC, Ritaccio AL, Pesaran B, Schalk G, 2011. Neural correlates of visual-spatial attention in electrocorticographic signals in humans. Front. Hum. Neurosci. 5, 89. doi: 10.3389/fnhum.2011.00089. [DOI] [PMC free article] [PubMed] [Google Scholar]
- Gunduz A, Brunner P, Daitch A, Leuthardt EC, Ritaccio AL, Pesaran B, Schalk G, 2012. Decoding covert spatial attention using electrocorticographic (ECoG) signals in humans. NeuroImage 60, 2285–2293. doi: 10.1016/j.neuroimage.2012.02.017. [DOI] [PMC free article] [PubMed] [Google Scholar]
- Gutnisky DA, Beaman CB, Lew SE, Dragoi V, 2017. Spontaneous fluctuations in visual cortical responses influence population coding accuracy. Cereb. Cortex 27, 1409–1427. doi: 10.1093/cercor/bhv312. [DOI] [PMC free article] [PubMed] [Google Scholar]
- Haegens S, Nacher V, Luna R, Romo R, Jensen O, 2011. α-Oscillations in the monkey sensorimotor network influence discrimination performance by rhythmical inhibition of neuronal spiking. Proc. Natl. Acad. Sci. U.S.A. 108, 19377–19382. doi: 10.1073/pnas.1117190108. [DOI] [PMC free article] [PubMed] [Google Scholar]
- Hanslmayr S, Aslan A, Staudigl T, Klimesch W, Herrmann CS, Bäuml KH, 2007. Prestimulus oscillations predict visual perception performance between and within subjects. NeuroImage 37, 1465–1473. doi: 10.1016/j.neuroimage.2007.07.011. [DOI] [PubMed] [Google Scholar]
- Heil P, Neubauer H, Tiefenau A, von Specht H, 2006. Comparison of absolute thresholds derived from an adaptive forced-choice procedure and from reaction probabilities and reaction times in a simple reaction time paradigm. J. Assoc. Res. Otolaryngol. 7, 279–298. doi: 10.1007/s10162-006-0042-y. [DOI] [PMC free article] [PubMed] [Google Scholar]
- Hesselmann G, Kell CA, Eger E, Kleinschmidt A, 2008. Spontaneous local variations in ongoing neural activity bias perceptual decisions. Proc. Natl. Acad. Sci. U.S.A. 105, 10984–10989. doi: 10.1073/pnas.0712043105. [DOI] [PMC free article] [PubMed] [Google Scholar]
- Hirase H, Czurko A, Csicsvari J, Buzsaki G, 1999. Firing rate and theta-phase coding by hippocampal pyramidal neurons during ‘space clamping’. Eur. J. Neurosci. 11, 4373–4380. doi: 10.1046/j.1460-9568.1999.00853.x. [DOI] [PubMed] [Google Scholar]
- Huang Y, Heil P, Brosch M, 2019. Associations between sounds and actions in early auditory cortex of nonhuman primates. eLife 8, 1–22. doi: 10.7554/elife.43281. [DOI] [PMC free article] [PubMed] [Google Scholar]
- Humes LE, Ahlstrom JB, 2014. Relation between Reaction Time and Loudness. J Speech Hear Res 27, 306–310. doi: 10.1044/jshr.2702.306. [DOI] [PubMed] [Google Scholar]
- Hwi Park Y, Shin SH, Wan Byun S, Yeon Kim J, 2016. Age and gender related mean hearing threshold in a highly screened population: The Korean national health and nutrition examination survey 2010–2012. PLoS One 11, e0150783. doi: 10.1371/journal.pone.0150783. [DOI] [PMC free article] [PubMed] [Google Scholar]
- Iemi L, Busch NA, 2018. Moment-to-moment fluctuations in neuronal excitability bias subjective perception rather than strategic decision-making. eNeuro 5, 1–13. doi: 10.1523/ENEURO.0430-17.2018. [DOI] [PMC free article] [PubMed] [Google Scholar]
- Iemi L, Chaumon M, Crouzet SM, Busch NA, 2017. Spontaneous neural oscillations bias perception by modulating baseline excitability. J. Neurosci. 37, 807–819. doi: 10.1523/JNEUROSCI.1432-16.2016. [DOI] [PMC free article] [PubMed] [Google Scholar]
- Iglewicz B, Hoaglin D, 1993. Volume 16: How to detect and handle outliers, in: Mykytka EF (Ed.), The ASQC Basic References in Quality Control: Statistical Techniques. ASQC Quality Press. [Google Scholar]
- Jensen O, Mazaheri A, 2010. Shaping functional architecture by oscillatory alpha activity: Gating by inhibition. Front. Hum. Neurosci. 4, 1–8. doi: 10.3389/fnhum.2010.00186. [DOI] [PMC free article] [PubMed] [Google Scholar]
- Killion MC, 1978. Revised estimate of minimum audible pressure: where is the “missing 6 dB”? J. Acoust. Soc. Am. 63, 1501–1508. doi: 10.1121/1.381844. [DOI] [PubMed] [Google Scholar]
- Klimesch W, Sauseng P, Hanslmayr S, 2007. EEG alpha oscillations: The inhibition–timing hypothesis. Brain Res Rev 53, 63–88. doi: 10.1016/j.brainresrev.2006.06.003. [DOI] [PubMed] [Google Scholar]
- Kohfeld DL, 1971. Simple reaction time as a function of stimulus intensity in decibels of light and sound. J. Exp. Psychol. 88, 251–257. doi: 10.1037/h0030891. [DOI] [PubMed] [Google Scholar]
- Kubanek J, Schalk G, 2015. NeuralAct: A tool to visualize electrocortical (ECoG) activity on a three-dimensional model of the cortex. Neuroinformatics 13, 167–174. doi: 10.1007/s12021-014-9252-3. [DOI] [PMC free article] [PubMed] [Google Scholar]
- Kurylo DD, Chung C, Yeturo S, Lanza J, Gorskaya A, Bukhari F, 2015. Effects of contrast, spatial frequency, and stimulus duration on reaction time in rats. Vision Res. 106, 20–26. doi: 10.1016/j.visres.2014.10.031. [DOI] [PubMed] [Google Scholar]
- Kyriakatos A, Petersen CCH, Kyriakatos A, Sadashivaiah V, Zhang Y, Motta A, Auffret M, Carl C, Kyriakatos A, Sadashivaiah V, Zhang Y, Motta A, Auffret M, 2017. Voltage-sensitive dye imaging of mouse neocortex during a whisker detection task. Neurophotonics 4, 031204. doi: 10.1117/1.NPh.4.3.031204. [DOI] [PMC free article] [PubMed] [Google Scholar]
- Lange J, Oostenveld R, Fries P, 2013. Reduced occipital alpha power indexes enhanced excitability rather than improved visual perception. J. Neurosci. 33, 3212–3220. doi: 10.1523/JNEUROSCI.3755-12.2013. [DOI] [PMC free article] [PubMed] [Google Scholar]
- Leek MR, 2001. Adaptive procedures in psychophysical research. Percept. Psychophys. 63, 1279–1292. doi: 10.3758/bf03194543. [DOI] [PubMed] [Google Scholar]
- Leszczyński M, Barczak A, Kajikawa Y, Ulbert I, Falchier AY, Tal I, Haegens S, Melloni L, Knight RT, Schroeder CE, 2020. Dissociation of broadband high-frequency activity and neuronal firing in the neocortex. Sci Adv 6, eabb0977. doi: 10.1126/sciadv.abb0977. [DOI] [PMC free article] [PubMed] [Google Scholar]
- Leuthardt EC, Pei XM, Breshears J, Gaona C, Sharma M, Freudenberg Z, Barbour D, Schalk G, 2012. Temporal evolution of gamma activity in human cortex during an overt and covert word repetition task. Front. Hum. Neurosci. 6, 167–174. doi: 10.3389/fnhum.2012.00099. [DOI] [PMC free article] [PubMed] [Google Scholar]
- Lewis JH, Matteson HH, Dunlap WP, 1977. Effects of stimulus duration on perceptual latency in the fovea. Bull. Psychon. Soc. 9, 176–178. doi: 10.3758/BF03336965. [DOI] [Google Scholar]
- Lima CF, Krishnan S, Scott SK, 2016. Roles of supplementary motor areas in auditory processing and auditory imagery. Trends Neurosci. 39, 527–542. doi: 10.1016/j.tins.2016.06.003. [DOI] [PMC free article] [PubMed] [Google Scholar]
- Mäkinen V, May P, Tiitinen H, 2004. Transient brain responses predict the temporal dynamics of sound detection in humans. NeuroImage 21, 701–706. doi: 10.1016/j.neuroimage.2003.10.009. [DOI] [PubMed] [Google Scholar]
- Mazaheri A, Jensen O, 2008. Asymmetric Amplitude Modulations of Brain Oscillations Generate Slow Evoked Responses. J. Neurosci. 28, 7781–7787. doi: 10.1523/JNEUROSCI.1631-08.2008. [DOI] [PMC free article] [PubMed] [Google Scholar]
- Mazaheri A, Jensen O, 2010. Rhythmic pulsing: Linking ongoing brain activity with evoked responses. Front. Hum. Neurosci. 4, 177. doi: 10.3389/fnhum.2010.00177. [DOI] [PMC free article] [PubMed] [Google Scholar]
- Meddis R, Lecluyse W, 2011. The psychophysics of absolute threshold and signal duration: A probabilistic approach. J. Acoust. Soc. Am. 129, 3153–3165. doi: 10.1007/s10995-017-2402-0. [DOI] [PubMed] [Google Scholar]
- Melloni L, Molina C, Pena M, Torres D, Singer W, Rodriguez E, 2007. Synchronization of neural activity across cortical areas correlates with conscious perception. J. Neurosci. 27, 2858–2865. doi: 10.1523/jneurosci.4623-06.2007. [DOI] [PMC free article] [PubMed] [Google Scholar]
- Monto S, Palva S, Voipio J, Palva JM, 2008. Very slow EEG fluctuations predict the dynamics of stimulus detection and oscillation amplitudes in humans. J. Neurosci. 28, 8268–8272. doi: 10.1523/JNEUROSCI.1910-08.2008. [DOI] [PMC free article] [PubMed] [Google Scholar]
- Moore BCJ, 1989. An introduction to the psychology of hearing, 3rd ed. Academic Press, San Diego, CA, US. [Google Scholar]
- Muniak MA, Ray S, Hsiao SS, Dammann JF, Bensmaia SJ, 2007. The neural coding of stimulus intensity: Linking the population response of mechanoreceptive afferents with psychophysical behavior. J. Neurosci. 27, 11687–11699. doi: 10.1523/JNEUROSCI.1486-07.2007. [DOI] [PMC free article] [PubMed] [Google Scholar]
- Neubauer H, Heil P, 2004. Towards a unifying basis of auditory thresholds: The effects of hearing loss on temporal integration reconsidered. J. Assoc. Res. Otolaryngol. 5, 436–458. doi: 10.1007/s10162-004-5031-4. [DOI] [PMC free article] [PubMed] [Google Scholar]
- Nikulin VV, Linkenkaer-Hansen K, Nolte G, Curio G, 2010. Non-zero mean and asymmetry of neuronal oscillations have different implications for evoked responses. Clin. Neurophysiol. 121, 186–193. doi: 10.1016/j.clinph.2009.09.028. [DOI] [PubMed] [Google Scholar]
- Nourski KV, Steinschneider M, Rhone AE, Krause BM, Kawasaki H, Banks MI, 2021. Cortical responses to auditory novelty across task conditions: An intracranial electrophysiology study. Hear. Res. 399, 107911. doi: 10.1038/s41467-020-17729-w. [DOI] [PMC free article] [PubMed] [Google Scholar]
- Oxenham AJ, 2016. Predicting the perceptual consequences of hidden hearing loss. Trends Hear 20, 2331216516686768. doi: 10.1177/2331216516686768. [DOI] [PMC free article] [PubMed] [Google Scholar]
- Palmer C, Cheng SY, Seidemann E, 2007. Linking neuronal and behavioral performance in a reaction-time visual detection task. J. Neurosci. 27, 8122–8137. doi: 10.1523/JNEUROSCI.1940-07.2007. [DOI] [PMC free article] [PubMed] [Google Scholar]
- Paraskevopoulou SE, Coon WG, Brunner P, Miller KJ, Schalk G, 2021. Within-subject reaction time variability: Role of cortical networks and underlying neurophysiological mechanisms. NeuroImage in revision. [DOI] [PMC free article] [PubMed] [Google Scholar]
- de Pesters A, Coon WG, Brunner P, Gunduz A, Ritaccio AL, Brunet NM, de Weerd P, Roberts MJ, Oostenveld R, Fries P, Schalk G, 2016. Alpha power indexes task-related networks on large and small scales: A multimodal ECoG study in humans and a non-human primate. NeuroImage 134, 122–131. doi: 10.1016/j.neuroimage.2016.03.074. [DOI] [PMC free article] [PubMed] [Google Scholar]
- Pfurtscheller G, Stancák A, Neuper C, 1996. Event-related synchronization (ERS) in the alpha band – An electrophysiological correlate of cortical idling: A review. Int. J. Psychophysiol. 24, 39–46. doi: 10.1016/S0167-8760(96)00066-9. [DOI] [PubMed] [Google Scholar]
- Quiroga RQ, Mukamel R, Isham EA, Malach R, Fried I, 2008. Human single-neuron responses at the threshold of conscious recognition. Proc. Natl. Acad. Sci. U.S.A. 105, 3599–3604. doi: 10.1073/pnas.0707043105. [DOI] [PMC free article] [PubMed] [Google Scholar]
- Raab D, Fehrer E, 1962. Supplementary report: The effect of stimulus and luminance on visual reaction time. J Exp Psychol 64, 326–327. doi: 10.1037/h0040255. [DOI] [PubMed] [Google Scholar]
- Raab DH, 1962. Effect of stimulus duration on auditory reaction time. Am. J. Psychol. 75, 298–301. [PubMed] [Google Scholar]
- Reuter M, Schmansky NJ, Rosas HD, Fischl B, 2012. Within-subject template estimation for unbiased longitudinal image analysis. NeuroImage 61, 1402–1418. doi: 10.1016/j.neuroimage.2012.02.084. [DOI] [PMC free article] [PubMed] [Google Scholar]
- Reznik D, Mukamel R, 2019. Motor output, neural states and auditory perception. Neurosci. Biobehav. Rev. 96, 116–126. doi: 10.1016/j.neubiorev.2018.10.021. [DOI] [PubMed] [Google Scholar]
- Rickard RE, Young AMJ, Gerdjikov TV, 2018. Cortical local field potential power is associated with behavioral detection of near-threshold stimuli in the rat whisker system: Dissociation between orbitofrontal and somatosensory cortices. J. Cogn. Neurosci. 30, 42–49. doi: 10.1162/jocn_a_01187. [DOI] [PubMed] [Google Scholar]
- Romei V, Rihs T, Brodbeck V, Thut G, 2008. Resting electroencephalogram alpha-power over posterior sites indexes baseline visual cortex excitability. Neuroreport 19, 203–208. doi: 10.1097/WNR.0b013e3282f454c4. [DOI] [PubMed] [Google Scholar]
- Rose JE, Hind JE, Anderson DJ, Brugge JF, 1971. Some effects of stimulus intensity on response of auditory nerve fibers in the squirrel monkey. J Neurophysiol 34, 685–699. doi: 10.1152/jn.1971.34.4.685. [DOI] [PubMed] [Google Scholar]
- Ruhnau P, Hauswald A, Weisz N, 2014. Investigating ongoing brain oscillations and their influence on conscious perception - network states and the window to consciousness. Front Psychol 5, 1230. doi: 10.3389/fpsyg.2014.01230. [DOI] [PMC free article] [PubMed] [Google Scholar]
- Russell VA, Oades RD, Tannock R, Killeen PR, Auerbach JG, Johansen EB, Sagvolden T, 2006. Response variability in Attention-Deficit/Hyperactivity Disorder: A neuronal and glial energetics hypothesis. Behav. Brain Funct. 2, 1–25. doi: 10.1186/1744-9081-2-30. [DOI] [PMC free article] [PubMed] [Google Scholar]
- Sachidhanandam S, Sreenivasan V, Kyriakatos A, Kremer Y, Petersen CCH, 2013. Membrane potential correlates of sensory perception in mouse barrel cortex. Nat. Neurosci. 16, 1671–1677. doi: 10.1038/nn.3532. [DOI] [PubMed] [Google Scholar]
- Sadaghiani S, Hesselmann G, Kleinschmidt A, 2009. Distributed and antagonistic contributions of ongoing activity fluctuations to auditory stimulus detection. J. Neurosci. 29, 13410–13417. doi: 10.1523/JNEUROSCI.2592-09.2009. [DOI] [PMC free article] [PubMed] [Google Scholar]
- Samaha J, Iemi L, Haegens S, Busch NA, 2020. Spontaneous Brain Oscillations and Perceptual Decision-Making. Trends Cogn. Sci. 24, 639–653. doi: 10.1016/j.tics.2020.05.004. [DOI] [PubMed] [Google Scholar]
- Sauseng P, Klimesch W, Gerloff C, Hummel FC, 2009. Spontaneous locally restricted eeg alpha activity determines cortical excitability in the motor cortex. Neuropsychologia 47, 284–288. doi: 10.1016/j.neuropsychologia.2008.07.021. [DOI] [PubMed] [Google Scholar]
- Schadow J, Lenz D, Thaerig S, Busch NA, Fründ I, Herrmann CS, 2007. Stimulus intensity affects early sensory processing: Sound intensity modulates auditory evoked gamma-band activity in human EEG. Int. J. Psychophysiol. 65, 152–161. doi: 10.1016/j.ijpsycho.2007.04.006. [DOI] [PubMed] [Google Scholar]
- Schalk G, 2015. A general framework for dynamic cortical function: the function-through-biased-oscillations (FBO) hypothesis. Front. Hum. Neurosci. 9, 352. doi: 10.3389/fnhum.2015.00352. [DOI] [PMC free article] [PubMed] [Google Scholar]
- Schalk G, Brunner P, Gerhardt LA, Bischof H, Wolpaw JR, 2008a. Brain-computer interfaces (BCIs): detection instead of classification. J. Neurosci. Methods 167, 51–62. doi: 10.1016/j.jneumeth.2007.08.010. [DOI] [PubMed] [Google Scholar]
- Schalk G, Leuthardt EC, Brunner P, Ojemann JG, Gerhardt LA, Wolpaw JR, 2008b. Real-time detection of event-related brain activity. NeuroImage 43, 245–249. doi: 10.1016/j.neuroimage.2008.07.037. [DOI] [PMC free article] [PubMed] [Google Scholar]
- Schalk G, Marple J, Knight RT, Coon WG, 2017. Instantaneous voltage as an alternative to power- and phase-based interpretation of oscillatory brain activity. NeuroImage 157, 545–554. doi: 10.1016/j.neuroimage.2017.06.014. [DOI] [PMC free article] [PubMed] [Google Scholar]
- Schalk G, McFarland DJ, Hinterberger T, Birbaumer N, Wolpaw JR, 2004. BCI2000: a general-purpose brain-computer interface (BCI) system. IEEE Trans Biomed Eng 51, 1034–1043. doi: 10.1109/TBME.2004.827072. [DOI] [PubMed] [Google Scholar]
- Schalk G, Mellinger J, 2010. A practical guide to brain-computer interfacing with BCI2000. (London: Springer; ). doi: 10.1007/978-1-84996-092-2. [DOI] [Google Scholar]
- Scheich H, Brechmann A, Brosch M, Budinger E, Ohl FW, 2007. The cognitive auditory cortex: task-specificity of stimulus representations. Hear. Res. 229, 213–224. doi: 10.1016/j.heares.2007.01.025. [DOI] [PubMed] [Google Scholar]
- Schlittenlacher J, Ellermeier W, 2015. Simple reaction time to the onset of time-varying sounds. Attention, Perception, Psychophys. 77, 2424–2437. doi: 10.3758/s13414-015-0940-3. [DOI] [PubMed] [Google Scholar]
- Schnitzler A, Gross J, 2005. Normal and pathological oscillatory communication in the brain. Nat. Rev. Neurosci. 6, 285–296. doi: 10.1038/nrn1650. [DOI] [PubMed] [Google Scholar]
- Sederberg AJ, Pala A, Zheng HJV, He BJ, Stanley GB, 2019. State-aware detection of sensory stimuli in the cortex of the awake mouse. PLoS Comput. Biol. 15, e1006716. doi: 10.1371/journal.pcbi.1006716. [DOI] [PMC free article] [PubMed] [Google Scholar]
- Smith CUM, 2008. Biology of Sensory Systems. John Wiley & Sons. [Google Scholar]
- Taylor MM, Creelman CD, 1967. PEST: Efficient estimates on probability functions. J. Acoust. Soc. Am. 41, 782–787. doi: 10.1121/1.1910407. [DOI] [Google Scholar]
- Ulrich R, Rinkenauer G, Miller J, 1998. Effects of stimulus duration and intensity on simple reaction time and response force. J. Exp. Psychol. Hum. Percept. Perform. 24, 915–928. doi: 10.1037/0096-1523.24.3.915. [DOI] [PubMed] [Google Scholar]
- Ward LM, 2003. Synchronous neural oscillations and cognitive processes. Trends Cogn. Sci. 7, 553–559. doi: 10.1016/j.tics.2003.10.012. [DOI] [PubMed] [Google Scholar]
- Weiskrantz L, 1999. Consciousness Lost and Found: A Neuropsychological Exploration. Oxford University Press, Oxford. doi: 10.1093/acprof:oso/9780198524588.001.0001. [DOI] [Google Scholar]
- Welch P, 1967. The use of fast fourier transform for the estimation of power spectra: A method based on time averaging over short, modified periodograms. IEEE Trans. Audio. Electroacoust. 15, 70–73. doi: 10.1109/TAU.1967.1161901. [DOI] [Google Scholar]
- Wiley TL, Chappell R, Carmichael L, Nondahl DM, Cruickshanks KJ, 2008. Changes in hearing thresholds over 10 years in older adults. J. Am. Acad. Audiol. 19, 281–371. doi: 10.3766/jaaa.19.4.2. [DOI] [PMC free article] [PubMed] [Google Scholar]
- Yang H, Kwon SE, Severson KS, O’Connor DH, 2016. Origins of choice related activity in mouse somatosensory cortex. Nat. Neurosci. 19, 127–134. doi: 10.1038/nn.4183. [DOI] [PMC free article] [PubMed] [Google Scholar]
- Zhang H, Watrous AJ, Patel A, Jacobs J, 2018. Theta and alpha oscillations are traveling waves in the human neocortex. Neuron 98, 1269–1281. doi: 10.1016/j.neuron.2018.05.019. [DOI] [PMC free article] [PubMed] [Google Scholar]
- Zoefel B, Heil P, 2013. Detection of near-threshold sounds is independent of EEG phase in common frequency bands. Front. Psychol. 4, 262. doi: 10.3389/fpsyg.2013.00262. [DOI] [PMC free article] [PubMed] [Google Scholar]
Associated Data
This section collects any data citations, data availability statements, or supplementary materials included in this article.
Supplementary Materials
ECoG electrode locations for all 6 subjects. (A-F) ECoG electrode locations (black circles) projected onto the right hemisphere of the MNI template brain, demonstrate temporal, frontal and parietal lobe coverage in subjects A-F.
Experiment design. (A) Auditory reaction time task. (B) Psychometric function (orange) for intensity (triangles) of auditory stimulus in subject D. Dashed line represents the stimulus intensity at perception threshold, i.e., at 50% response rate. (C) Example of determining the stimulus intensity at perception threshold using the iterative Parameter Estimation by Sequential Testing (PEST) procedure (Taylor and Creelman, 1967). Intensity settings used for this subject are indicated by triangles in panel B.
Psychometric function of response rate to normalized auditory stimulus intensity across all subjects. Each dot represents the response rate to one stimulus intensity for one subject during the PEST calibration procedure (on average 16±2.1 (mean±sem) repetitions, individual subjects, normalized to perception threshold). The data conforms to a sigmoid function which validates the underlying psychometric function and thus the behavioral performance of our subjects (goodness of fit, r2 = 0.84, p ≪ 0.001).
Characteristics of detected cortical activity evoked by high and low-intensity stimulus in electrodes located within temporal and non-temporal lobes. (A) Task-related electrodes located within temporal and parietal-frontal lobes are depicted as white and gray circles, respectively. (B,C) Low-intensity stimuli elicit smaller and later onsets of broadband gamma power than high intensity stimuli. (D) Low-intensity stimuli elicit broadband gamma responses that are more variable in their onset time.
Spread of cortical activity in response to high (A) and low-intensity (B) stimuli. The color of each circle represents the normalized median onset time of the cortical activity evoked by the auditory stimulus at this location. Cortical activity spreads from early auditory cortex (dark blue) across superior temporal gyrus (light blue) to eventually reach motor cortex (red). This spread characteristic is the same in response to high as it is in response to low-intensity stimuli.
Detection rate of cortical activity evoked by low-intensity stimuli in electrodes located within and outside of the temporal lobe for hit and miss trials. Cortical activity during hit trials is equally likely to be evoked within and outside of the temporal lobe (Wilcoxon rank-sum test, p>0.05). In contrast, cortical activity during miss trials is less likely to be evoked on overall, and also much less likely to be evoked outside of the temporal lobe (Wilcoxon rank-sum test, ***: p<0.001).
Relationship between cortical excitability and population-level activity. (A) Instantaneous voltage (blue) is derived from the alpha oscillation (pink) by subtracting the alpha amplitude bias. (B,C) Relationship between alpha power, instantaneous voltage, and broadband power. Each dot represents the average normalized broadband power within one of 50 equally spaced bins of the alpha power and instantaneous voltage range, respectively. The correlation coefficient indicates that instantaneous voltage (panel C, blue line, Spearman’s r2 = 0.88, p≪0.001) is a better predictor of broadband power and thus of cortical activity than alpha power (panel B, pink line, Spearman’s r2 = 0.70, p≪0.001).
Average alpha power, time-locked to cortical activity onset, during hit and miss trials with a detectable cortical activity onset for electrodes within temporal and frontal-parietal lobes. (A) Alpha power (as an index of neural population excitability) for hit (orange) and miss (blue) trials, time-locked to the cortical activity onset time of each trial, and averaged across all subjects and electrodes. Yellow area depicts the estimated 100ms-long information arrival window (i.e., one cycle of alpha oscillation at 10 Hz) before cortical activity onset. (B) Within this window, alpha power is smaller for hit (orange bar) trials than for miss trials (blue bar). Thus, cortical excitability before cortical activity onset is higher for hit trials than for miss trials (***: p<0.001, paired t-test).
Alpha amplitude and phase for hit and miss trials with a detectable cortical activity onset shown for electrodes within temporal and frontal-parietal lobe. (A–B) Alpha oscillations for hit (orange) and miss (blue) trials, time-locked to the cortical activity onset time of each trial, and averaged across all subjects. (A) Shown for temporal, and (B) frontal-parietal lobe. Yellow area depicts the estimated 100 ms-long information arrival window (i.e., one cycle of alpha oscillation at 10 Hz) before cortical activity onset. (C) During this information arrival window, hit and miss trials exhibit similar alpha amplitude within the temporal and the frontal-parietal lobe (Wilcoxon rank-sum, p>0.05). (D) In contrast, within the same information arrival window, hit and miss trials exhibit a similar phase distribution only within the frontal-parietal but not the temporal lobe (Circular Kruskal-Wallis test, **p<0.01, p>0.05, see Berens 2009 for details).
Calculating the instantaneous voltage signal. The summation of the bias (Offsetbias, dashed yellow line) and negative amplitude envelope (SAE, red line) of the alpha oscillation (SAA, black line) comprise the instantaneous voltage signal (S’AA, cyan line).
Average instantaneous voltage and low-frequency power, time-locked to cortical activity onset, during hit and miss trials with a detectable cortical activity onset for electrodes within temporal and frontal-parietal lobe for wide-band filtered signals. To rule out the possibility that our finding that cortical excitability prior to activity onset is higher during hit than during miss trials (see Fig. 6) is a direct result of the 8–12 Hz narrow-band filtering, we performed a control analysis in which we used a 4–40 Hz wide-band filter of the same order to calculate the instantaneous voltage and alpha power. (A–B) Normalized instantaneous voltage of the 4–40 Hz wide-band-filtered signal during hit and miss trials for (A) temporal lobe and (B) frontal-parietal lobe electrodes. (C) Instantaneous voltage throughout the 100ms-long window preceding cortical activity onset (i.e., yellow area in A and B). Instantaneous voltage preceding cortical onset during hit trials is significantly lower within the frontal-parietal lobe (***: p<0.001), but not within the temporal lobe (p>0.05, Wilcoxon rank-sum test). (D–E) Normalized alpha power during hit and miss trials for (D) temporal lobe and (E) frontal-parietal lobe electrodes. (F) Low-frequency (4–40 Hz) power throughout the 100ms-long window preceding cortical activity onset (i.e., yellow area in D and E). Low-frequency power preceding cortical onset during hit trials is significantly lower within the frontal-parietal lobe (***: p<0.001), but not within the temporal lobe (p>0.05, Wilcoxon rank-sum test).
Average instantaneous voltage and low-frequency power, time-locked to cortical activity onset, during hit and miss trials with a detectable cortical activity onset for electrodes within temporal and frontal-parietal lobe for theta-band filtered signals. To determine whether our finding that cortical excitability prior to activity onset is higher during hit than during miss trials (see Fig. 6) is specific to the 8–12 Hz alpha-band, we performed a control analysis in which we used a 4–8 Hz theta-band filter of the same order to calculate the instantaneous voltage and theta power. (A–B) Normalized instantaneous voltage of the theta-band filtered signal during hit and miss trials for (A) temporal lobe and (B) frontal-parietal lobe electrodes. (C) Instantaneous voltage throughout the 167ms-long window preceding cortical activity onset (i.e., yellow area in A and B; one oscillation cycle at 6 Hz). Instantaneous voltage preceding cortical onset during hit trials is significantly lower within the frontal-parietal lobe (**: p<0.01), but not within the temporal lobe (p>0.05, Wilcoxon rank-sum test). (D–E) Normalized theta power during hit and miss trials for (D) temporal lobe and (E) frontal-parietal lobe electrodes. (F) Low-frequency (4–8 Hz) power throughout the 100ms-long window preceding cortical activity onset (i.e., yellow area in D and E). Low-frequency power preceding cortical onset during hit trials is significantly lower within the frontal-parietal lobe (*: p<0.05), but not within the temporal lobe (p>0.05, Wilcoxon rank-sum test).
Power spectral density with and without 1/f component for electrodes in temporal (left) and frontal-parietal lobe (right). (A–B) For each electrode location, and averaged across all trials, we calculated the power spectral density for the 1-second long period prior to stimulus onset (Welch PSD, see Welch 1967 for details). (C–D) Power spectral density with 1/f component removed using the FOOOF method described in Donoghue et al. 2020. (E–F) Power spectral density for hit (red) and miss (blue) trials (shaded area denote standard error).
Time-frequency maps for temporal (top) and frontal-parietal lobe (bottom). (A–B) We used the newtimef function in EEGLAB (Delorme and Makeig, 2004) to determine time-frequency maps for hit and miss trials in two representative electrode locations. Red and blue areas depict spectral power increases and decreases, respectively. White areas did not pass a significance threshold of p<0.01. Results are shown for the 500 ms periods prior and after stimulus-onset for hit (left) and miss trials (center). The right panel shows the difference between hit and miss trials. (A) Temporal locations show equal broadband gamma power activity (i.e., power increase in the 70–170 Hz band) for both hit and miss trials. (B) Frontal locations show higher broadband gamma activity in hit trials when compared to miss trials.
Normalized broadband gamma power throughout hit and miss trials. For trials in which cortical activity is evoked, hit (orange) and miss (blue) trials evoked the same peak amplitude (p>0.05, Wilcoxon rank-sum test, across all subjects and electrodes, time-locked to activity onset). However, broadband gamma power was significantly higher for hit trials immediately before and following the detected cortical activity onset (red curve, 50 ms sliding window, Wilcoxon rank-sum test, p>0.05, Bonferroni corrected for multiple comparisons).
Alpha power for hit and miss trials with a detectable cortical activity onset shown for electrodes within temporal and frontal-parietal lobe. (A–B) Alpha power for hit (orange) and miss (blue) trials, time-locked to the cortical activity onset time of each trial, and averaged across all subjects. (A) Shown for temporal, and (B) frontal-parietal lobe. Yellow area depicts the estimated 100 ms-long information arrival window (i.e., one cycle of alpha oscillation at 10 Hz) before cortical activity onset. (C) During this information arrival window, hit and miss trials exhibit similar alpha power within the temporal lobe (Wilcoxon rank-sum, p>0.05), but significantly higher alpha power for miss trials within the frontal-parietal lobe (**: p<0.01, paired t-test).
Effect of filter bandwidth on temporal smearing. We simulated the effect of an 8–12 Hz narrow-band (A) and a 4–40 Hz wide-band (B) filter on smearing the onset of a synthetic 10 Hz alpha-band oscillation. The results of this simulation confirm that wide-band filtering overcomes the temporal smearing exhibited by narrow-band filters (A) and yields a power onset that truthfully follows that of the underlying oscillation (200 trials, 10 Hz oscillation with random phase offset and additive white noise, Hilbert transform).
Data Availability Statement
Comprehensive data-sets may be provided to interested researchers upon reasonable request to the corresponding author and approval of a data-sharing agreement by the Institutional Review Board of Albany Medical College.