

Abstract
Background:
Prenatal and early life air pollution exposure may impair healthy neurodevelopment, increasing risk of childhood behavioral disorders, but epidemiological evidence is inconsistent. Little is known about factors that determine susceptibility.
Methods:
Participants were mother-child dyads from the CANDLE study, an ECHO PATHWAYS Consortium birth cohort set in the mid-South United States, who completed a preschool visit. We estimated prenatal and childhood exposures to nitrogen dioxide (NO2) and particulate matter less than 10 μm (PM10) at participants’ residences using a national annual average universal kriging model (land-use regression with spatial smoothing). Distance to nearest major roadway was used as a proxy for traffic-related pollution. Primary outcomes were children’s internalizing and externalizing behavior problems. Regression models were adjusted for individual- and neighborhood-level socioeconomic measures, maternal IQ, and multiple other potential confounders. We tested for effect modification by select maternal and child characteristics.
Results:
The analytic sample (N = 975 of 1503 enrolled) was 64% African American and 53% had a household annual income below $35,000; child mean age was 4.3 years (SD: 0.4). Mean prenatal NO2 and PM10 exposures were 12.0 ppb (SD: 2.4) and 20.8 μg/m3 (SD: 2.0); postnatal exposures were lower. In fully adjusted models, 2 ppb higher prenatal NO2 was positively associated with externalizing behavior (6%; 95% CI: 1, 11%). Associations with postnatal exposure were stronger (8% per 2 ppb NO2; 95%CI: 0, 16%). Prenatal NO2 exposure was also associated with an increased odds of clinically significant internalizing and externalizing behaviors. We found suggestive evidence that socioeconomic adversity and African American race increases susceptibility. PM10 and road proximity were not associated with outcomes.
Conclusions:
Findings showed that air pollution exposure is positively associated with child behavior problems and that African American and low SES children may be more susceptible. Importantly, associations were observed at exposures below current air quality standards.
Keywords: Air pollution, Neurodevelopment, Pediatric health, Longitudinal cohort, Epidemiology
1. Introduction
While outdoor air pollution levels are decreasing in the United States, recent research has described adverse health impacts at low exposures, below current regulatory standards (Di et al., 2017; Schraufnagel et al., 2019). It is uncertain whether low levels of air pollution affect pediatric neurodevelopment, including increasing risk of adverse behavioral outcomes. In large epidemiological cohort studies, parent report is often used to measure child behavior; these measures generally assess two broad domains of behavior: internalizing behaviors (e.g. depression, anxiety, and social withdrawal) and externalizing behaviors (e.g. aggression, attention problems, impulsivity). Children exhibiting early-onset behavior problems are at increased risk for behavior problems in adolescence and delinquency, substance abuse, violent behavior, academic problems, and depression over the life course (Moffitt, 1993; Hofstra et al., 2000; Shaw et al., 2003; Petty et al., 2008; Althoff et al., 2010). Therefore, the identification of modifiable, environmental exposures associated with childhood behavior problems has important implications for public health prevention and intervention efforts.
The collective epidemiological evidence linking prenatal and early-life air pollution exposure to child behavior outcomes is growing, and toxicological research suggests several plausible mechanisms by which prenatal or early-life air pollution exposure could harm the developing brain, including by increased systematic and neuroinflammation, oxidative stress, and microglial activation (Block et al., 2012; Suades-Gonzales et al., 2015). However, there are some inconsistencies in epidemiological studies. Several studies have described adverse associations between prenatal or early childhood air pollution and externalizing behavior problems (Yorifuji et al., 2017; Newman et al., 2013; Perera et al., 2014; Alemany et al., 2018), self-regulation (Harris et al., 2016; Margolis et al., 2016), diagnosis of attention deficit/hyperactivity disorder (ADHD)1 (Siddique et al., 2011), and reduced performance on direct assessments of attention or working memory (Chiu et al., 2013, 2016; Sentís et al., 2017; Wang et al., 2009; Rivas et al., 2019; Forns et al., 2017), which are cognitive skills that underlie externalizing problems and ADHD. At the same time, recent longitudinal cohort studies provide compelling evidence of null associations between air pollution and risk of ADHD (Forns et al., 2018; Gong et al., 2014). Fewer studies have assessed associations between air pollution and pediatric internalizing behaviors or associated disorders such as depression or anxiety (Perera et al., 2012, 2014).
There are several possible explanations for inconsistencies across prior studies. Socioeconomic status (SES) is a strong determinant of pediatric neurodevelopmental outcomes as well as ambient air pollution exposure (Mikati et al., 2018; Clark et al., 2014; Hajat et al., 2015; Temam et al., 2017), and, when not adequately accounted for, may confound associations. There are notable differences with respect to adjustment for SES, with many studies including maternal education as the sole SES covariate. Further, it is difficult to disentangle direct effects of traffic-related air pollutants on neurodevelopment from those attributable to other co-exposures that are correlated with roadway proximity, such as noise, which can impact child sleep quality and, in turn, behavior (Basner and McGuire, 2018; Gregory et al., 2004; Zare Sakhvidi et al., 2018). Exposure measurement error affects all epidemiological studies of air pollution and can be a source of substantial bias. Analyses that utilize area-wide estimates of ambient pollutants or that rely on limited address history data (Yorifuji et al., 2016, 2017; Haynes et al., 2011; Min and Min, 2017; Midouhas et al., 2019) may be more susceptible to such biases. Furthermore, research suggests that certain factors increase susceptibility to neurotoxic effects of air pollution, such as child sex, SES and maternal nutrition, but existing evidence is inconclusive. Previous work has attempted to determine windows of susceptibility as well, but uncertainty persists as to timing of exposure most important for health effects.
In the current study, we examine the association between air pollution and child externalizing and internalizing behaviors in the Conditions Affecting Neurocognitive Development and Learning in Early Childhood (CANDLE) study, a longitudinal study of 1503 mother-child dyads in Shelby County, TN. We leverage CANDLE’s prospective design, large sample size, high retention rates, and rich characterization of address histories as well as participant characteristics to help overcome some limitations of some previous studies. We examine effect modification by child characteristics associated with greater vulnerability to chemical exposures in prior studies (child sex, race and SES), as well as by an objective biomarker of prenatal nutrition, maternal plasma folate, which we have found to modify air pollution-neurodevelopment associations in prior studies of this cohort (Loftus et al., 2019). We hypothesized that higher exposure to ambient air pollution in the prenatal and/or postnatal period are associated with more behavioral problems in early childhood. We further aimed to determine whether prenatal or postnatal exposures are more strongly associated with neurodevelopmental outcomes.
2. Methods
2.1. The CANDLE study: cohort and data collection
The CANDLE study is a prospective pregnancy cohort study set in Shelby County, TN. The design, aims and data collection have been described previously (Sontag-Padilla et al., 2015; Loftus et al., 2019). Between 2006 and 2011, CANDLE recruited women based on the following criteria: age 16–40 years old, in the second trimester of a singleton pregnancy, intent to deliver at one of five health care settings in Shelby County, and with no pregnancy complications (e.g. diagnosis of gestational diabetes, high blood pressure or other condition). 5228 women were screened and 3320 were determined to be eligible; of these, 1503 enrolled in CANDLE (Sontag-Padilla et al., 2015). Longitudinal data collection included two prenatal clinic visits, several childhood visits attended by children and mothers, as well as two home visits in early childhood. Mothers were contacted by phone one or more times per year for purposes of cohort engagement and survey-based data. All participants provided informed consent. Research activities were approved by the University of Tennessee Health Sciences Center Institutional Review Board (IRB). The current analyses were conducted as part of the PATHWAYS Consortium, a cohort award of the Environmental Influences on Child Health Outcomes (ECHO) initiative, and were approved by the IRB of the University of Washington, Seattle.
2.2. Neurodevelopmental outcomes
Outcomes were assessed at a preschool-age study visit. Mothers completed the Child Behavior Checklist (CBCL; ages 1.5–5 years of age), a well-researched instrument demonstrating high reliability (Achenbach and Rescorla, 2000; Achenbach and Ruffle, 2000; Achenbach, 2009). In brief, the CBCL is a parent reported measure of the frequency (never, sometimes, always) of 99 problem behaviors in the past two weeks. Responses are summed to create eight syndrome and DSM-oriented scales as well as two broadband domains of behavior: externalizing and internalizing, which are the focus of this investigation.
Two primary outcome measures were selected a priori: raw scores for both the CBCL externalizing and internalizing broadband scales. Secondary outcomes were externalizing and internalizing scores exceeding clinical thresholds (t-scores of 63 or higher).
2.3. Air pollution exposure
CANDLE collected maternal residential addresses at enrollment and updated contact information at every subsequent point of contact, including study visits and phone calls. Addresses were geocoded using Census TIGER line files in ArcGIS, Texas A&M geocoder, or manual matching. When a move date was not available, it was estimated as halfway between the ascertainment dates of the two different addresses.
To estimate ambient NO2 and PM10 at every residential location, we applied validated universal kriging models (land-use regression with spatial smoothing) for the contiguous US; details in Sampson et al. (2013) and Young et al. (2016). These models predict annual average pollutant concentrations based on air quality monitoring data from AQS and IMPROVE networks and modeling of over 300 geographic covariates. The NO2 model was also enhanced with satellite data (Young et al., 2016). The predictive capacity of models were assessed with cross-validation R2s, which ranged from 0.79 to 0.89 and 0.40 too 0.63 for NO2 and PM10, respectively. To leverage spatial contrasts in air pollution and avoid temporal confounding or bias due to year-specific modeling errors, we used a “fixed year” of the model to determine participant exposures within each exposure window: specifically, we estimated prenatal exposures using annual averages predicted using the 2006 model, and all postnatal estimates were derived from the 2011 model. We accounted for changes of address during the prenatal and postnatal periods: for participants who moved during an exposure period (i.e., prenatal or postnatal period), we calculated time-weighted exposure averages across all locations during that window.
As a proxy measure of air pollution associated with road traffic, we estimated distance between each residential address and nearest major roadway. We defined “near road” as living within 150 m of an A1, A2 or A3 road (US Census Feature Class Codes) for our primary metric. If a participant lived at multiple address addresses during the exposure period, we assigned road proximity based on the single location at which the mother lived the longest.
2.4. Other variables
Covariates included in statistical models as potential confounders, precision variables, and effect modifiers were collected by a variety of methods. Baseline socio-demographics, health behaviors, pre-pregnancy body mass index (BMI), parity and breastfeeding were ascertained by maternal surveys. Reported household income was adjusted by the number of adults and children supported by the income (Hagenaars and de Vos andZaidi, 1994). Prenatal surveys included the Brief Symptom Inventory (BSI) (Derogatis, 1993) for assessment of maternal mental health and the Knowledge of Infant Development Inventory (KIDI; MacPhee, 1981). Child sleep quality was measured by maternal report on the Children’s Sleep Habits Questionnaire (CSHQ) at the age 4–6 year visit (Owens et al., 2000). Maternal IQ was assessed using the WASI short form (Axelrod, 2002). Maternal blood was collected during the second trimester of pregnancy, and plasma folate concentrations were measured as described previously (Roy et al., 2018). The Home Observation Measurement of the Environment (HOME) inventory, an in-person observational measure of the quality of care-taking environment (Frankenburg and Coons, 1986), was completed during a visit to CANDLE participants’ homes.
Finally, we used two domains of the Childhood Opportunity Index (COI) to approximate neighborhood-level resources and other local factors that influence child development: the educational opportunity subscale, calculated using adult educational attainment rate (college and above), school poverty rate, reading proficiency rate, math proficiency rate, preschool/nursery school attendance rate, high school graduation rate, proximity to accredited early education centers, and proximity to early childhood education centers of any type; and the social and economic opportunity subscale, calculated using neighborhood foreclosure rate, poverty rate, unemployment rate, public assistance rate, and proximity to employment. COI indices are estimated at the census tract level. Due to alignment with data collection years for the COI, we estimated the postnatal average COI subscales with time-weighted averaging over all postnatal addresses.
2.5. Statistical analyses
We completed descriptive analyses to characterize the study population overall, to compare characteristics between participants with high versus low prenatal air pollution exposures, and to compare characteristics of those included in analyses to all CANDLE live births. We estimated pairwise correlations between pollutant measures and continuous distances to each class of roadway.
Associations between each outcome and air pollution exposure metric were estimated in separate multivariate linear regression models. We assessed associations with prenatal as well as postnatal exposures for each pollutant separately. Because CBCL externalizing and internalizing raw scores are summed counts of behaviors, we used Poisson regression with robust standard errors to account for over-dispersion. Associations with dichotomous outcomes (i.e., externalizing or internalizing scores above a clinical threshold) were estimated using logistic regression. NO2 and PM10 risk estimates were scaled to a 2 unit increase in exposure, which approximated the IQR for both pollutants in pre- and postnatal windows in this study population.
We used a staged approach to address potential confounding. We first identified risk factors for pediatric behavioral problems in the research literature and used a directional acyclic diagram (DAG) to inspect possible pathways for confounding (Supplemental Fig. 1). Our primary results are based on the “full” model, which includes all covariates identified a priori as likely confounders as well as risk factors for poor behavioral outcomes that may be correlated with exposures in this population. The “minimal” and “minimal plus temporal splines” are included to provide insight into the importance of confounder adjustment in this analysis and to help in assessing whether including all of the covariates in the “full” model results in inflated confidence intervals. The “expanded” model is included to assess whether more robust adjustment for additional covariates might be necessary.
Minimal models were adjusted for child sex, age at assessment, and enrollment site; in “minimal plus temporal splines” models, we added child date of birth as cubic splines with four degrees of freedom per year. The full models included individual-level SES variables (maternal education at baseline [high school degree/GED or less, college degree or technical school, graduate or professional degree], and baseline household income adjusted for number of adults and children in household), neighborhood-level economic and educational opportunity (COI economic and educational subscale scores, as splines with three degrees of freedom), maternal demographics (maternal age [16–18, 19–21, 22–29, and 30 and over years] and maternal race [African American or other]), maternal health during pregnancy (reported smoking [any or none]), maternal prenatal depression (BSI t-score for depression above 60), maternal cognitive ability (full scale IQ score), birth order (first child or not), and early childhood nutrition and child health behaviors (breastfeeding [never, <6 months, ≥6 months], and sleep survey score at time of assessment). Sleep health was included as a covariate to block a possible association between air pollution exposure and neurodevelopment that may appear due to the effects of traffic noise on sleep and – in turn – child behavior. Our aims are to estimate associations with exposure to chemical air pollution and child behavior, not the effects of noise or other effects of living near roads. Expanded models included all covariates in the full models, plus additional variables to minimize the possibility of residual confounding: baseline insurance status (Medicaid/no insurance, or other), reported prenatal vitamin use (yes or no), maternal marital status at baseline, paternal education at baseline (same categories as maternal education, plus unknown), maternal pre-pregnancy body mass index (underweight, normal, overweight, obese), and total score on the KIDI survey. As noted above, we estimated effects of prenatal and postnatal separately as well as in mutually-adjusted models. We used the same models to evaluate both prenatal and postnatal exposure for ease of comparing results for different exposure windows.
We assessed evidence of effect modification in associations between air pollution and primary outcome measures (continuous CBCL scores) by child sex, individual-level SES, and maternal race. In separate analyses, we modeled individual SES 1) by adjusted household income, dichotomized at the median as well as a continuous value, and 2) by baseline insurance status: covered by private insurance (relatively high SES) vs. Medicaid/Medicare or no insurance (relatively low SES). We also evaluated effect modification by a biomarker of prenatal nutrition, plasma folate. Prenatal plasma folate was divided into quartiles based on the distribution among CANDLE mothers. We added interaction terms in all models used to assess effect modification, and p-values for interaction were estimated using Wald tests with robust standard errors.
We conducted sensitivity analyses to evaluate potential biases in the main findings: 1) To assess residual confounding by the home environment, we additionally controlled associations with primary outcomes, estimated in full models, for the HOME inventory. On account of substantial nondifferential missingness in this measure, we use multiple imputation to impute missing HOME scores in N = 10 datasets, which were combined in regression analyses using Rubin’s rules (Rubin, 2004). 2) To determine whether our findings about road proximity were influenced by the threshold chosen to define “near roadway,” we tested additional distance thresholds: 100, 200, 250, 300, 350, and 400 m. 3) As described above, we excluded participants who moved outside the study area during pregnancy in analyses of prenatal exposure and those who moved away between birth and time of assessment in analyses of postnatal exposure. In sensitivity analyses, we further repeated analyses of prenatal exposure with exclusion of the participants who moved out of the area in the postnatal period. 4) We repeated main analyses of each exposure with additional control for the two other exposures in the same time window, in attempt to assess whether associations with each were affected by confounding by another exposure. 5) Finally, we explored whether the exposure-response relationships for main models deviated from linearity by using generalized linear models (GAMs) with adjustment for all covariates in the full models. We inspected exposure-response curves and associated 95% CIs to determine whether there is statistically significant evidence of deviations from linearity.
All analyses were conducted in Stata version 15 (StataCorp LLC, College Station, Texas) or R 3.4.3 (R Foundation for Statistical Computing, Vienna, Austria). We considered 0.05 as a p-value threshold for statistical significance.
3. Results
3.1. Study population
The study population included N = 975 mother-child dyads who had prenatal address histories available for air pollution predictions and outcome data from the 4–6 year visit. Fig. 1 illustrates cohort retention from enrollment to the time of outcome assessments and exclusions from the current analysis. Compared to those who enrolled in CANDLE and had a live birth (N = 1452), our study population was similar in prenatal exposures as well as participant characteristics (Supplemental Table 1).
Fig. 1.
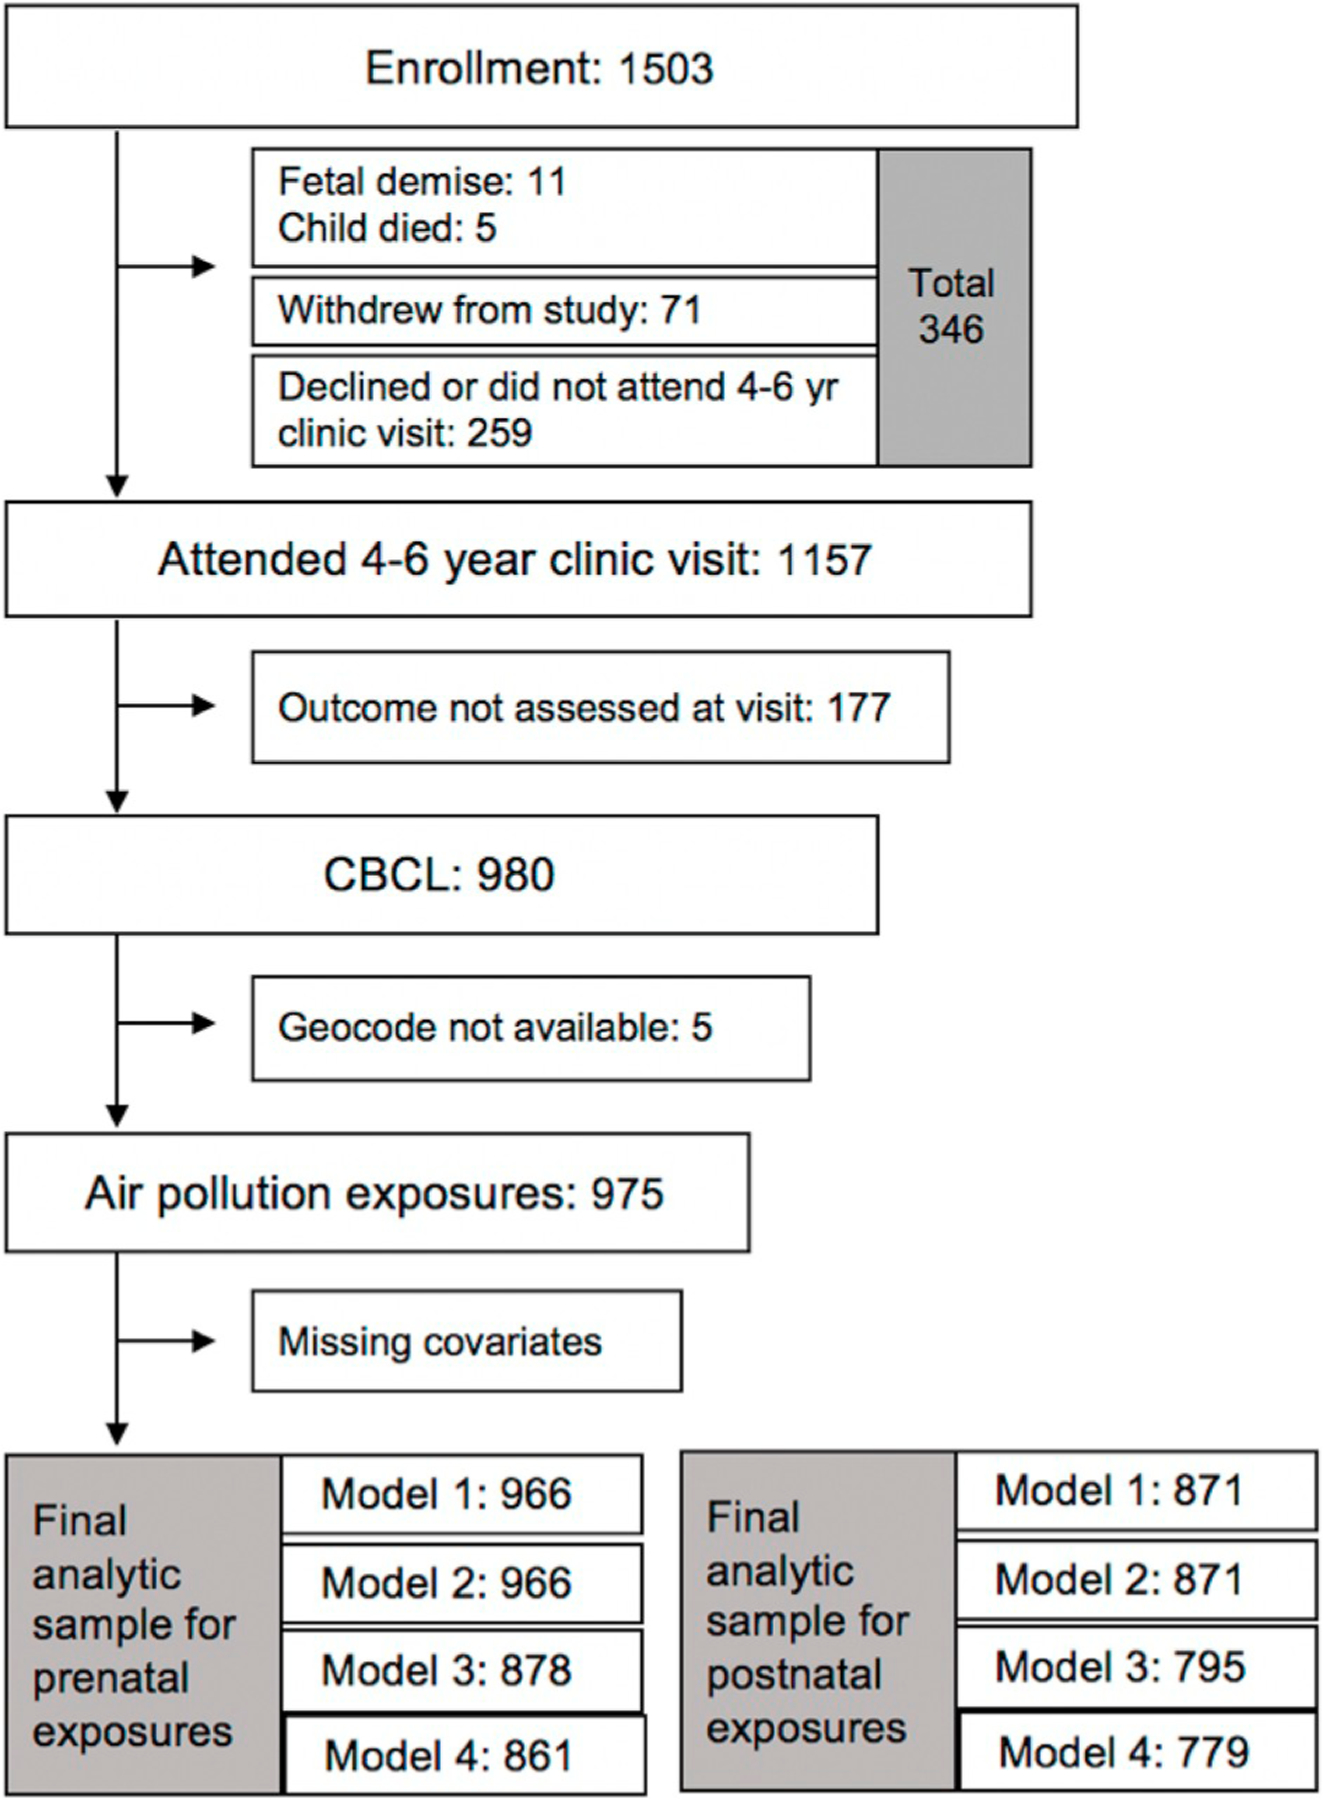
Enrollment in the CANDLE cohort and inclusion in analytic samples.
64% of mothers identified as African American and 29% as Caucasian. The majority were covered by Medicaid/Medicare or had no insurance (57%) and reported a high school education or less at time of enrollment (60%) (Table 1). 38% of mothers were married at enrollment. Few mothers reported prenatal smoking (9%), and the majority breastfed their children for less than 6 months or not at all (65%). The mean (SD) child age was 4.3 (0.4) years at the time of outcome assessment. Compared to those with lower levels of prenatal pollution exposure, mothers with higher exposure to at least one pollutant measure were more likely African American, were younger during pregnancy, had lower levels of educational attainment, were less likely to be married, were less likely covered by private insurance, had lower reported incomes at enrollment and lived in census tracts with lower COI educational and social and economic opportunity scores (Table 1).
Table 1.
Characteristics of study participants, overall and by exposure category.
| Total Population | Proximity to the nearest major roadway during pregnancy | Prenatal NO2 exposure | Prenatal PM10 exposure | ||||||||||||||
|---|---|---|---|---|---|---|---|---|---|---|---|---|---|---|---|---|---|
| (N = 975) | ≥ 150 m (N = 703) |
<150 m (N = 272) |
p-value | ≤ 11.9 ppb (N = 487) |
>11.9 ppb (N = 488) |
p-value | ≤ 20.7
μg/m3 (N = 487) |
>20.7
μg/m3 (N = 488) |
p-value | ||||||||
| Mean/N | SD/% | Mean/N | SD/% | Mean/N | SD/% | Mean/N | SD/% | Mean/N | SD/% | Mean/N | SD/% | Mean/N | SD/% | ||||
| Child age (yrs) | 4.3 | 0.4 | 4.3 | 0.4 | 4.4 | 0.4 | 0.02 | 4.3 | 0.3 | 4.3 | 0.4 | 0.03 | 4.3 | 0.4 | 4.3 | 0.4 | 0.45 |
| Child sex | |||||||||||||||||
| Male | 489 | 50.2% | 346 | 49.2% | 143 | 52.6% | 240 | 49.3% | 249 | 51.0% | 247 | 50.7% | 242 | 49.6% | |||
| Female | 486 | 49.9% | 357 | 50.8% | 129 | 47.4% | 0.35 | 247 | 50.7% | 239 | 49.0% | 0.59 | 240 | 49.3% | 246 | 50.4% | 0.73 |
| Maternal age at birth (years) | 26.6 | 5.5 | 26.7 | 5.5 | 26.3 | 5.6 | 0.28 | 27.1 | 5.7 | 26.2 | 5.4 | 0.01 | 26.6 | 5.5 | 26.7 | 5.6 | 0.71 |
| Maternal race | |||||||||||||||||
| African American | 626 | 64.2% | 432 | 61.5% | 194 | 71.3% | 274 | 56.3% | 352 | 72.1% | 299 | 61.4% | 327 | 67.0% | |||
| White | 286 | 29.3% | 222 | 31.6% | 64 | 23.5% | 182 | 37.4% | 104 | 21.3% | 150 | 30.8% | 136 | 27.9% | |||
| Asian | 9 | 0.9% | 7 | 1.0% | 2 | 0.7% | 6 | 1.2% | 3 | 0.6% | 6 | 1.2% | 3 | 0.6% | |||
| Others | 3 | 0.3% | 2 | 0.3% | 1 | 0.4% | 3 | 0.6% | 0 | 0.0% | 0 | 0.0% | 3 | 0.6% | |||
| Multiple | 51 | 5.2% | 40 | 5.7% | 11 | 4.0% | 0.07 | 22 | 4.5% | 29 | 5.9% | <0.001 | 32 | 6.6% | 19 | 3.9% | 0.06 |
| Maternal education a | |||||||||||||||||
| <HS | 110 | 11.3% | 80 | 11.4% | 30 | 11.0% | 44 | 9.0% | 66 | 13.5% | 67 | 13.8% | 43 | 8.8% | |||
| HS/GED | 471 | 48.3% | 319 | 45.4% | 152 | 55.9% | 211 | 43.3% | 260 | 53.3% | 228 | 46.8% | 243 | 49.8% | |||
| Technical school | 93 | 9.5% | 70 | 10.0% | 23 | 8.5% | 51 | 10.5% | 42 | 8.6% | 43 | 8.8% | 50 | 10.3% | |||
| College degree | 193 | 19.8% | 154 | 21.9% | 39 | 14.3% | 115 | 23.6% | 78 | 16.0% | 90 | 18.5% | 103 | 21.1% | |||
| Grad/Prof degree | 107 | 11.0% | 79 | 11.2% | 28 | 10.3% | 66 | 13.6% | 41 | 8.4% | 59 | 12.1% | 48 | 9.8% | |||
| missing | 1 | 0.1% | 1 | 0.1% | 0 | 0.0% | 0.03 | 0 | 0.0% | 1 | 0.2% | <0.001 | 0 | 0.0% | 1 | 0.2% | 0.08 |
| Maternal IQ score | 94.8 | 16.3 | 95.2 | 16.5 | 93.6 | 15.6 | 0.16 | 97.5 | 16.1 | 92.0 | 16.1 | <0.001 | 94.6 | 16.9 | 95.0 | 15.7 | 0.69 |
| Maternal marital status a | |||||||||||||||||
| Married | 369 | 37.9% | 288 | 41.0% | 81 | 29.8% | 231 | 47.4% | 138 | 28.3% | 185 | 38.0% | 184 | 37.7% | |||
| Widowed | 1 | 0.1% | 1 | 0.1% | 0 | 0.0% | 1 | 0.2% | 0 | 0.0% | 1 | 0.2% | 0 | 0.0% | |||
| Divorced | 19 | 2.0% | 12 | 1.7% | 7 | 2.6% | 9 | 1.9% | 10 | 2.1% | 8 | 1.6% | 11 | 2.3% | |||
| Separated | 8 | 0.8% | 4 | 0.6% | 4 | 1.5% | 3 | 0.6% | 5 | 1.0% | 3 | 0.6% | 5 | 1.0% | |||
| Never Married | 402 | 41.2% | 274 | 39.0% | 128 | 47.1% | 175 | 35.9% | 227 | 46.5% | 203 | 41.7% | 199 | 40.8% | |||
| Living with partner | 175 | 18.0% | 123 | 17.5% | 52 | 19.1% | 68 | 14.0% | 107 | 21.9% | 87 | 17.9% | 88 | 18.0% | |||
| Missing | 1 | 0.1% | 1 | 0.1% | 0 | 0.0% | 0.02 | 0 | 0.0% | 1 | 0.2% | <0.001 | 0 | 0.0% | 1 | 0.2% | 0.85 |
| Prenatal smoking | |||||||||||||||||
| No | 888 | 91.1% | 647 | 92.0% | 241 | 88.6% | 449 | 92.2% | 439 | 90.0% | 436 | 89.5% | 452 | 92.6% | |||
| Yes | 86 | 8.8% | 56 | 8.0% | 30 | 11.0% | 38 | 7.8% | 48 | 9.8% | 51 | 10.5% | 35 | 7.2% | |||
| Missing | 1 | 0.1% | 0 | 0.0% | 1 | 0.4% | 0.10 | 0 | 0.0% | 1 | 0.2% | 0.26 | 0 | 0.0% | 1 | 0.2% | 0.07 |
| Health insurance status a | |||||||||||||||||
| No insurance | 2 | 0.2% | 1 | 0.1% | 1 | 0.4% | 1 | 0.2% | 1 | 0.2% | 1 | 0.2% | 1 | 0.2% | |||
| Medicaid or Medicare only | 550 | 56.4% | 382 | 54.3% | 168 | 61.8% | 230 | 47.2% | 320 | 65.6% | 286 | 58.7% | 264 | 54.1% | |||
| Medicaid/Medicare and private insurance | 35 | 3.6% | 28 | 4.0% | 7 | 2.6% | 17 | 3.5% | 18 | 3.7% | 20 | 4.1% | 15 | 3.1% | |||
| Private insurance only | 388 | 39.8% | 292 | 41.5% | 96 | 35.3% | 0.14 | 239 | 49.1% | 149 | 30.5% | <0.001 | 180 | 37.0% | 208 | 42.6% | 0.31 |
| Prenatal depression (BSI Sub-scale T-score) | 48.3 | 7.8 | 48.1 | 7.6 | 48.8 | 8.3 | 0.65 | 48.0 | 7.8 | 48.6 | 7.9 | 0.56 | 48.2 | 7.7 | 48.3 | 8.0 | 0.98 |
| Breastfeeding | |||||||||||||||||
| Never | 347 | 35.6% | 243 | 34.6% | 104 | 38.2% | 150 | 30.8% | 197 | 40.4% | 159 | 32.7% | 188 | 38.5% | |||
| <6 months | 289 | 29.6% | 218 | 31.0% | 71 | 26.1% | 152 | 31.2% | 137 | 28.1% | 153 | 31.4% | 136 | 27.9% | |||
| ≥ 6 months | 331 | 34.0% | 236 | 33.6% | 95 | 34.9% | 179 | 36.8% | 152 | 31.2% | 169 | 34.7% | 162 | 33.2% | |||
| Missing | 8 | 0.8% | 6 | 0.9% | 2 | 0.7% | 0.30 | 6 | 1.2% | 2 | 0.4% | 0.01 | 6 | 1.2% | 2 | 0.4% | 0.17 |
| Household income aa | |||||||||||||||||
| 0–10 k | 194 | 19.9% | 130 | 18.5% | 64 | 23.5% | 70 | 14.4% | 124 | 25.4% | 97 | 19.9% | 97 | 19.9% | |||
| 10–20 k | 139 | 14.3% | 96 | 13.7% | 43 | 15.8% | 49 | 10.1% | 90 | 18.4% | 76 | 15.6% | 63 | 12.9% | |||
| 20–35 k | 185 | 19.0% | 120 | 17.1% | 65 | 23.9% | 86 | 17.7% | 99 | 20.3% | 88 | 18.1% | 97 | 19.9% | |||
| 35–55 k | 132 | 13.5% | 103 | 14.7% | 29 | 10.7% | 78 | 16.0% | 54 | 11.1% | 66 | 13.6% | 66 | 13.5% | |||
| 55–75 k | 109 | 11.2% | 86 | 12.2% | 23 | 8.5% | 78 | 16.0% | 31 | 6.4% | 51 | 10.5% | 58 | 11.9% | |||
| 75 k+ | 148 | 15.2% | 122 | 17.4% | 26 | 9.6% | 100 | 20.5% | 48 | 9.8% | 66 | 13.6% | 82 | 16.8% | |||
| missing | 68 | 7.0% | 46 | 6.5% | 22 | 8.1% | 0.001 | 26 | 5.3% | 42 | 8.6% | <0.001 | 43 | 8.8% | 25 | 5.1% | 0.63 |
| Maternal BMI category | |||||||||||||||||
| Underweight | 43 | 4.4% | 33 | 4.7% | 10 | 3.7% | 20 | 4.1% | 23 | 4.7% | 27 | 5.5% | 16 | 3.3% | |||
| Normal | 374 | 38.4% | 270 | 38.4% | 104 | 38.2% | 187 | 38.4% | 187 | 38.3% | 198 | 40.7% | 176 | 36.1% | |||
| Overweight | 231 | 23.7% | 171 | 24.3% | 60 | 22.1% | 124 | 25.5% | 107 | 21.9% | 111 | 22.8% | 120 | 24.6% | |||
| Obese | 324 | 33.2% | 228 | 32.4% | 96 | 35.3% | 156 | 32.0% | 168 | 34.4% | 149 | 30.6% | 175 | 35.9% | |||
| missing | 3 | 0.3% | 1 | 0.1% | 2 | 0.7% | 0.71 | 0 | 0.0% | 3 | 0.6% | 0.59 | 2 | 0.4% | 1 | 0.2% | 0.09 |
| Child birth order | |||||||||||||||||
| First-born | 590 | 60.5% | 419 | 59.6% | 171 | 62.9% | 0.35 | 285 | 58.5% | 305 | 62.5% | 302 | 62.0% | 288 | 59.0% | ||
| Not first-born | 385 | 39.5% | 284 | 40.4% | 101 | 37.1% | 202 | 41.5% | 183 | 37.5% | 0.20 | 185 | 38.0% | 200 | 41.0% | 0.33 | |
| Plasma folate levels | |||||||||||||||||
| Q1 (3.7–14.75 nmol/L) | 243 | 24.9% | 170 | 24.2% | 73 | 26.8% | 97 | 19.9% | 146 | 29.9% | 121 | 24.9% | 122 | 25.0% | |||
| Q2 (14.79–21.87 nmol/L) | 243 | 24.9% | 176 | 25.0% | 67 | 24.6% | 124 | 25.5% | 119 | 24.4% | 106 | 21.8% | 137 | 28.1% | |||
| Q3 (21.96–29.52 nmol/L) | 242 | 24.8% | 171 | 24.3% | 71 | 26.1% | 127 | 26.1% | 115 | 23.6% | 128 | 26.3% | 114 | 23.4% | |||
| Q4 (29.63–109.14 nmol/L) | 242 | 24.8% | 183 | 26.0% | 59 | 21.7% | 0.51 | 137 | 28.1% | 105 | 21.5% | 129 | 26.5% | 113 | 23.2% | ||
| missing | 5 | 0.5% | 3 | 0.4% | 2 | 0.7% | 2 | 0.4% | 3 | 0.6% | 0.002 | 3 | 0.6% | 2 | 0.4% | 0.12 | |
| Childhood opportunity index: educational index | 0.01 | 0.54 | 0.04 | 0.57 | −0.06 | 0.47 | 0.06 | 0.21 | 0.60 | −0.19 | 0.39 | <0.001 | −0.05 | 0.51 | 0.06 | 0.57 | <0.001 |
| Childhood opportunity index: economic index | −0.06 | 0.60 | −0.07 | 0.59 | −0.06 | 0.62 | 0.37 | 0.01 | 0.58 | −0.14 | 0.61 | <0.001 | −0.09 | 0.65 | −0.03 | 0.55 | <0.001 |
| Knowledge of infant development (KIDI) score, total | 0.65 | 0.15 | 0.66 | 0.15 | 0.65 | 0.13 | 0.39 | 0.67 | 0.14 | 0.63 | 0.14 | <0.001 | 0.65 | 0.15 | 0.66 | 0.14 | 0.20 |
Reported at enrollment.
3.2. Behavioral outcomes
Externalizing behavior raw scores ranged from 0 to 43; the mean (SD) was 9.3 (7.6). Internalizing behavior raw scores ranged from 0 to 44; the mean (SD) was 6.3 (6.2). 4.7% and 5.3% of children had t-scores above the clinical threshold of 63 for externalizing and internalizing problem behavior scores, respectively.
3.3. Modeled pollutant exposures and road proximity
Median prenatal exposures to PM10 and NO2 were 20.7 μg/m3 (IQR = 2.8) and 11.9 ppb (IQR = 3.8), respectively, and median postnatal exposures were 17.2 μg/m3 (IQR = 2.1) and 8.6 ppb (IQR = 2.5), respectively (Table 2). N = 272 (27.9%) and 262 (27.1%) of participants lived within 150 m of a busy road for the majority of their pregnancy and during childhood, respectively. NO2 and PM10 had low correlations in both the prenatal and postnatal windows of exposures (Pearson’s r = −0.057 and 0.049, respectively; Supplemental Table 2). NO2 concentrations and distance to roadways were correlated, as expected, while PM10 estimates were not related to roadway proximity. Postnatal NO2 and PM10 were strongly correlated with prenatal exposures (r = 0.79 and 0.71 for NO2 and PM10, respectively).
Table 2.
Air pollution exposures.
| Air pollutants | N | Mean | SD | 25th percentile | Median | 75th percentile | IQRw |
|---|---|---|---|---|---|---|---|
| Prenatal NO2 (ppb)a | 975 | 12.0 | 2.4 | 10.3 | 11.9 | 14.1 | 3.8 |
| Prenatal PM10 (ug/m3)a | 975 | 20.8 | 2.0 | 19.4 | 20.7 | 22.1 | 2.8 |
| Postnatal NO2 (ppb)b | 975 | 8.6 | 1.8 | 8.1 | 8.6 | 10.7 | 2.5 |
| Postnatal PM10 (ug/m3)b | 975 | 17.2 | 1.5 | 16.3 | 17.2 | 18.3 | 2.1 |
| Distance to A1 roadway (m) | 975 | 2556 | 1865 | 916 | 2095 | 3275 | 2359 |
| Distance to A2 roadway (m) | 975 | 2005 | 1656 | 286 | 1517 | 2749 | 2463 |
| Distance to A3 roadway (m) | 975 | 451 | 537 | 105 | 304 | 504 | 399 |
Prenatal NO2 and PM10 estimated using the 2006 model predictions, time-weighted by across all reported addresses during the prenatal period.
Postnatal NO2 and PM10 estimated using 2011 model predictions, time-weighted across all reported addresses between birth and Age 4.
Supplemental Fig. 2 displays predicted annual concentrations of NO2 and PM10 in the study region. Estimated NO2 levels were highest around major roadways and concentrated in the Memphis urban center, while regions of high PM10 were dispersed across the study region.
3.4. Air pollution and externalizing behavior
In fully-adjusted models, children exposed to 2 ppb higher prenatal NO2 on average had 6% higher externalizing behavior scores (95% CI: 1, 11%; Fig. 2). 2 ppb higher postnatal NO2 was associated with 8% higher externalizing scores (95% CI: 0, 16%). NO2 was also associated with a higher odds of meeting the threshold for clinically significant externalizing problems (ORprenatal = 1.57 [95%CI: 1.02, 2.40]; ORpostnatal = 1.96 [95%CI: 1.03, 3.71]) (Table 3). With additional control of HOME inventory score in imputed datasets, findings did not change (results not shown). Mutual adjustment of prenatal and postnatal NO2 in the same model resulted in attenuation and reduced precision of effect estimates associated with both exposure windows (4% increase [95%CI: −3, 11%] and 2% increase [95%CI: −9, 14%] for prenatal and postnatal, respectively, with mutual adjustment). We found no associations between prenatal or postnatal PM10 or road proximity and any externalizing outcome (Fig. 2; Table 3).
Fig. 2. Associations between prenatal and postnatal air pollution exposure and child behavior.
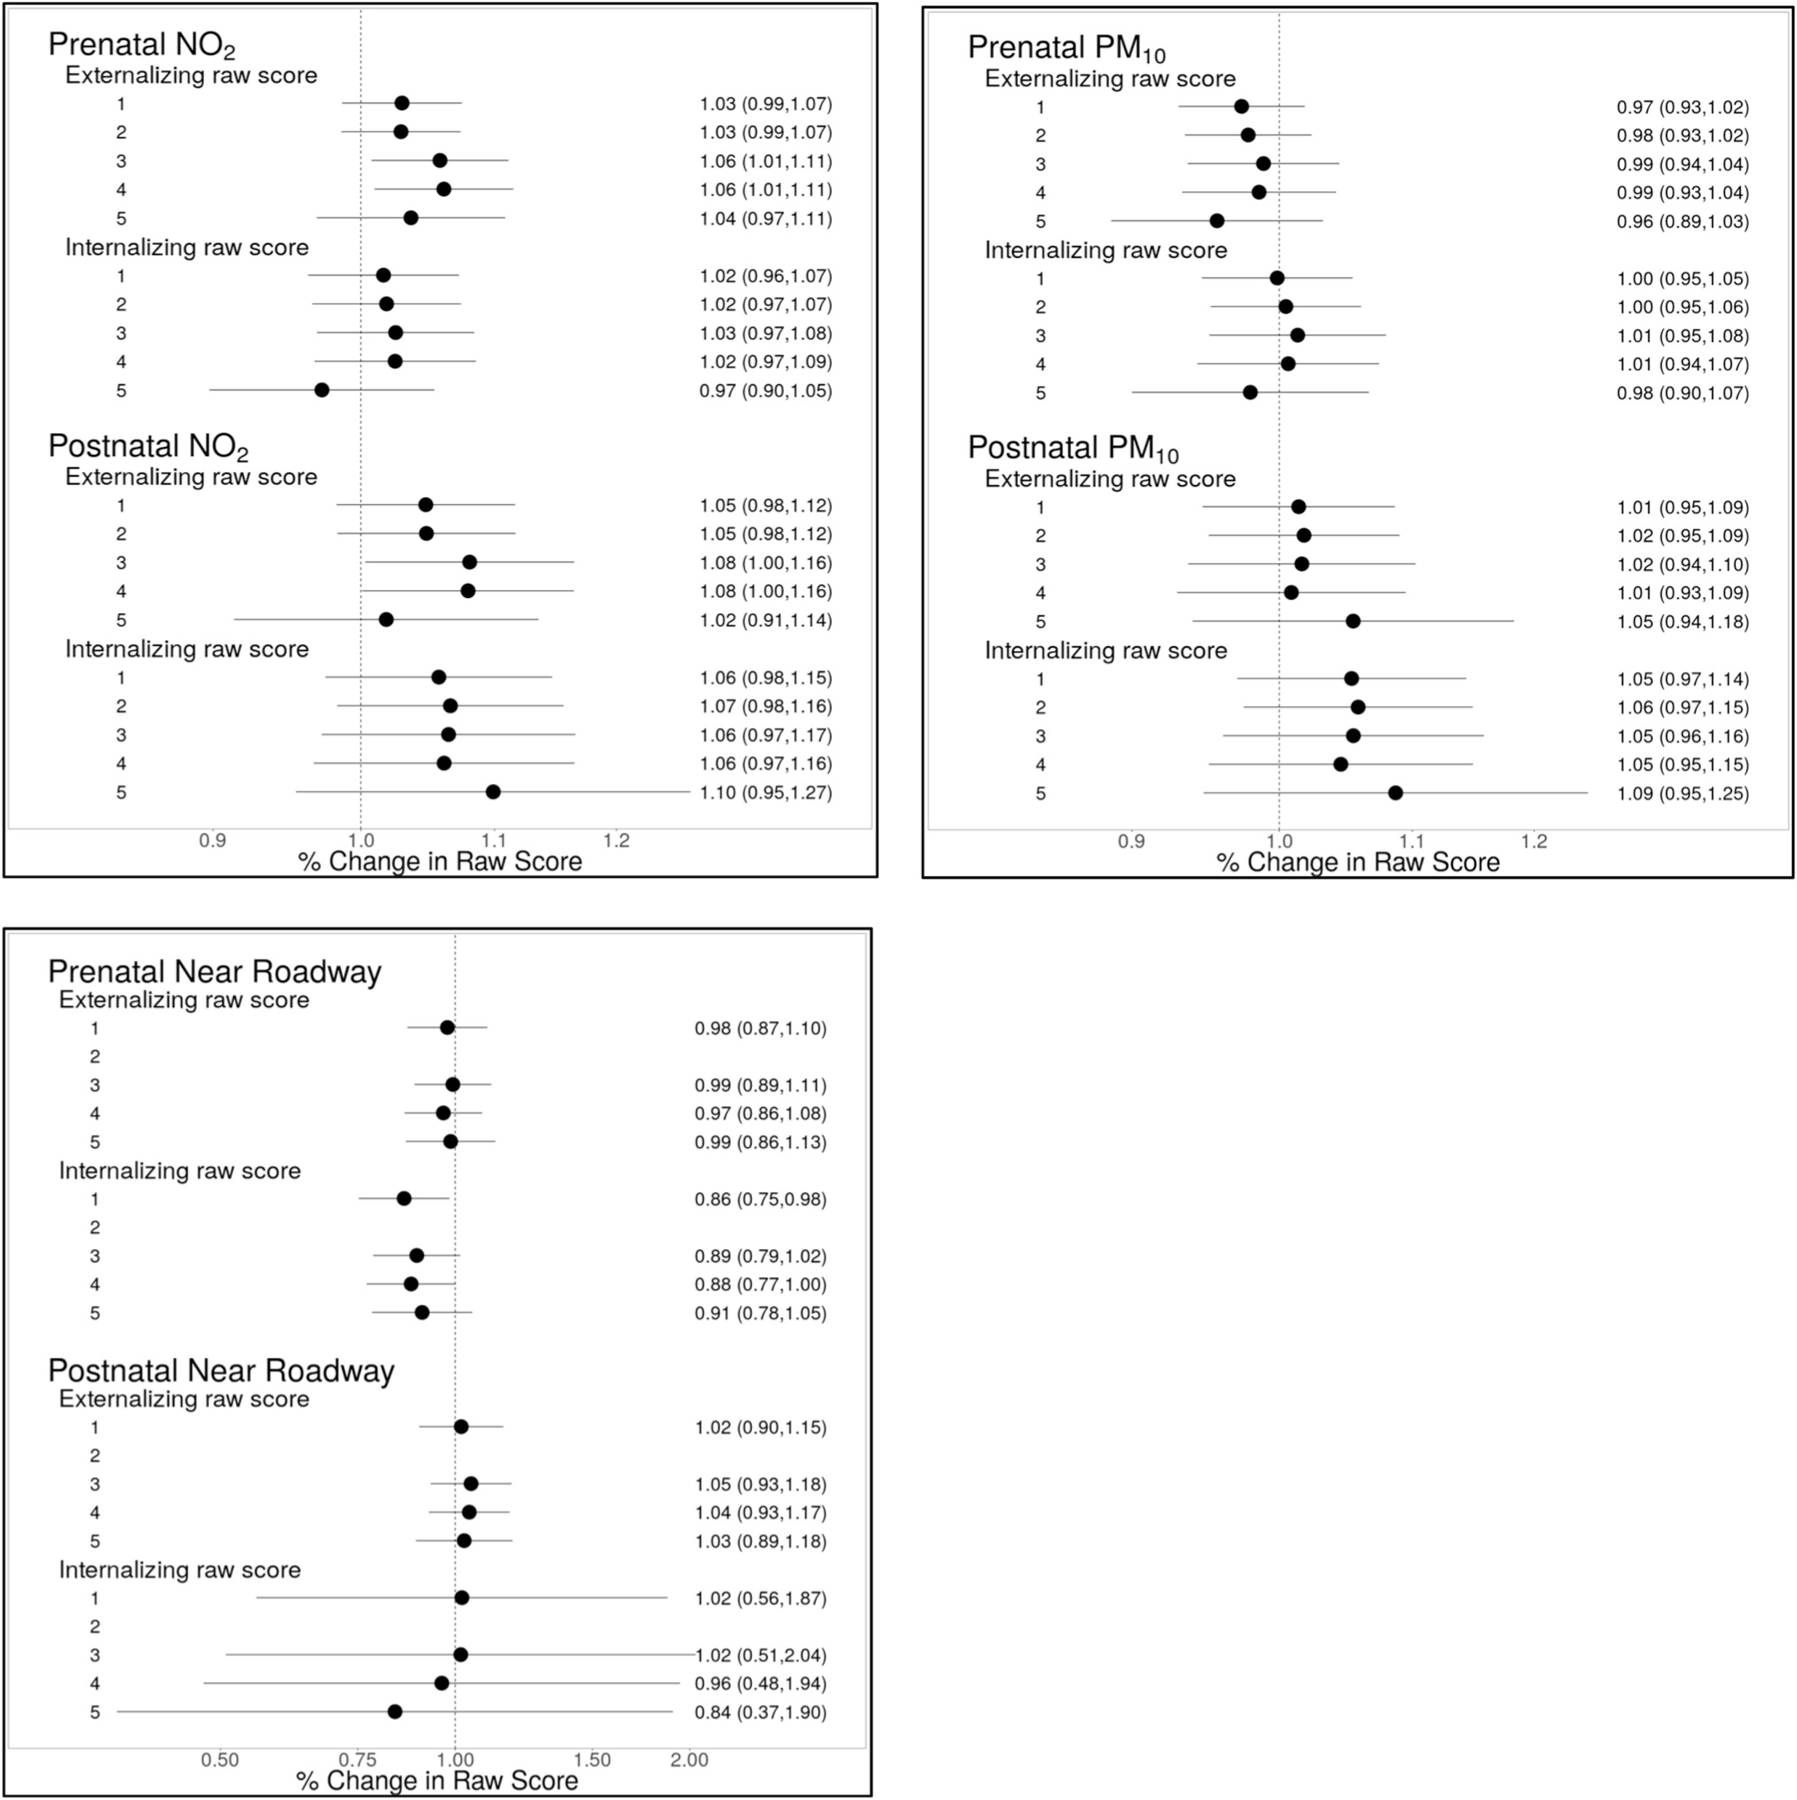
Effect sizes are scaled to a 2 unit increase in NO2 and PM10. For road proximity, effect size represents difference in outcome for women living within 150 m of a busy road compared to those living more than 150 m. Adjustment models for NO2 and PM10: Model 1: adjusted for child age, child sex and recruitment site. Model 2: Model 1 + temporal splines. Model 3: Model 2 + maternal characteristics (age, race, education, prenatal smoking, prenatal depression, IQ), breastfeeding, neighborhood COI (postnatal economics score & educational score), insurance status, adjusted household income, child sleep score at assessment and birth order. Model 4: Model 3 + paternal education, maternal BMI, prenatal vitamin use, marital status and KIDI score. Model 5: Model 3, with pre- and postnatal exposures mutually adjusted. Models for road proximity: Same as above, except Model 2 is not applicable, as distance to roadway is not modeled with time-varying covariates.
Table 3.
Analysis of behavior scores relative to clinical thresholds.
| Adjustment modela | Odds of externalizing t-score >63 with prenatal higher exposure | Odds of externalizing t-score >63 with higher postnatal exposure | ||||||||||||||||
|---|---|---|---|---|---|---|---|---|---|---|---|---|---|---|---|---|---|---|
| Prenatal NO2 | Prenatal PM10 | Prenatal Proximity to road | Postnatal NO2 | Postnatal PM10 | Postnatal proximity to road | |||||||||||||
| ORb | 95% CI | ORb | 95% CI | OR | 95% CI | ORb | 95% CI | ORb | 95% CI | OR | 95% CI | |||||||
| Model 1 | 1.35 | 1.06 | 1.72 | 0.88 | 0.71 | 1.09 | 1.24 | 0.65 | 2.35 | 1.55 | 1.03 | 2.32 | 1.04 | 0.74 | 1.48 | 0.90 | 0.78 | 1.04 |
| Model 2 | 1.40 | 1.09 | 1.80 | 0.89 | 0.71 | 1.11 | NA | NA | NA | 1.63 | 1.07 | 2.49 | 1.08 | 0.75 | 1.56 | NA | NA | NA |
| Model 3 | 1.57 | 1.02 | 2.40 | 0.76 | 0.50 | 1.17 | 1.31 | 0.62 | 2.78 | 1.96 | 1.03 | 3.71 | 0.87 | 0.46 | 1.64 | 0.96 | 0.84 | 1.10 |
| Model 4 | 1.67 | 1.02 | 2.74 | 0.79 | 0.49 | 1.26 | 1.14 | 0.52 | 2.51 | 1.55 | 0.82 | 2.96 | 0.70 | 0.33 | 1.50 | 0.94 | 0.82 | 1.08 |
| Model 5 (with adjustment for postnatal exposure) | 1.07 | 0.67 | 1.71 | 0.77 | 0.47 | 1.25 | 1.21 | 0.54 | 2.74 | 1.67 | 0.82 | 3.40 | 1.00 | 0.46 | 2.19 | 0.99 | 0.84 | 1.16 |
| Adjustment modela | Odds of internalizing t-score >63 with prenatal higher exposure | Odds of internalizing t-score >63 with higher postnatal exposure | ||||||||||||||||
| Prenatal NO2 | Prenatal PM10 | Prenatal Proximity to road | Postnatal NO2 | Postnatal PM10 | Postnatal proximity to road | |||||||||||||
| ORb | 95% CI | ORb | 95% CI | OR | 95% CI | ORb | 95% CI | ORb | 95% CI | OR | 95% CI | |||||||
|
| ||||||||||||||||||
| Model 1 | 1.02 | 0.96 | 1.07 | 1.00 | 0.95 | 1.05 | 0.86 | 0.75 | 0.98 | 1.06 | 0.70 | 1.59 | 0.95 | 0.65 | 1.39 | 0.61 | 0.30 | 1.22 |
| Model 2 | 1.02 | 0.97 | 1.07 | 1.00 | 0.95 | 1.06 | NA | NA | NA | 1.15 | 0.75 | 1.77 | 0.96 | 0.65 | 1.42 | NA | NA | NA |
| Model 3 | 1.03 | 0.97 | 1.08 | 1.01 | 0.95 | 1.08 | 0.89 | 0.79 | 1.02 | 1.21 | 0.66 | 2.22 | 0.70 | 0.39 | 1.27 | 0.74 | 0.35 | 1.57 |
| Model 4 | 1.02 | 0.97 | 1.09 | 1.01 | 0.94 | 1.07 | 0.88 | 0.77 | 1.00 | 1.04 | 0.58 | 1.88 | 0.64 | 0.35 | 1.19 | 0.66 | 0.29 | 1.46 |
| Model 5 (with adjustment for postnatal exposure) | 0.97 | 0.90 | 1.05 | 0.98 | 0.90 | 1.07 | 0.91 | 0.78 | 1.05 | 1.14 | 0.45 | 2.93 | 0.90 | 0.34 | 2.36 | 0.92 | 0.38 | 2.23 |
Model 1 is adjusted for child age and sex. Model 2 includes covariates in Model 1 plus temporal splines (NO2 and PM10 only). Model 3 includes covariates in Model 2 plus maternal characteristics (age, race, education, prenatal smoking, prenatal depression, IQ), breastfeeding, neighbourhood COI (postnatal economics score & educational score), insurance status, adjusted household income, child sleep score at assessment and birth order. Model 4 includes covariates in Model 3 plus paternal education, maternal BMI, prenatal vitamin use, marital status and KIDI score. Model 5 is adjusted for all covariates in Model 3 plus postnatal exposure for analyses of prenatal exposure and vice versa.
Odds ratios are scaled to a 2 unit increase in NO2 or PM10.
There is some evidence that SES modified the association between air pollution and externalizing behavior (Fig. 3). Associations between postnatal NO2 and externalizing behavior were stronger for those with Medicaid or no insurance at baseline compared to those with private insurance (12% increase [95%CI: 1, 24%] vs. 1% increase [95%CI: −10, 13%]; pinteraction = 0.09). Higher PM10 was associated with more externalizing behavioral problems in children from lower income families but not those with higher incomes (11% increase [95%CI: 0, 25%] vs. 10% decrease [95%CI: −1, 19%] per 2 g/m3, pinteraction = 0.01), respectively; findings were similar when income was modeled as a continuous interaction term (results not shown). For both pre- and postnatal NO2 and PM10, we observed suggestive trends of stronger associations with lower maternal folate during pregnancy, but tests of interaction did not achieve statistical significance (Fig. 3). There was no evidence of effect modification by child sex or maternal race (Fig. 3).
Fig. 3. Analysis of effect modification by participant characteristics.
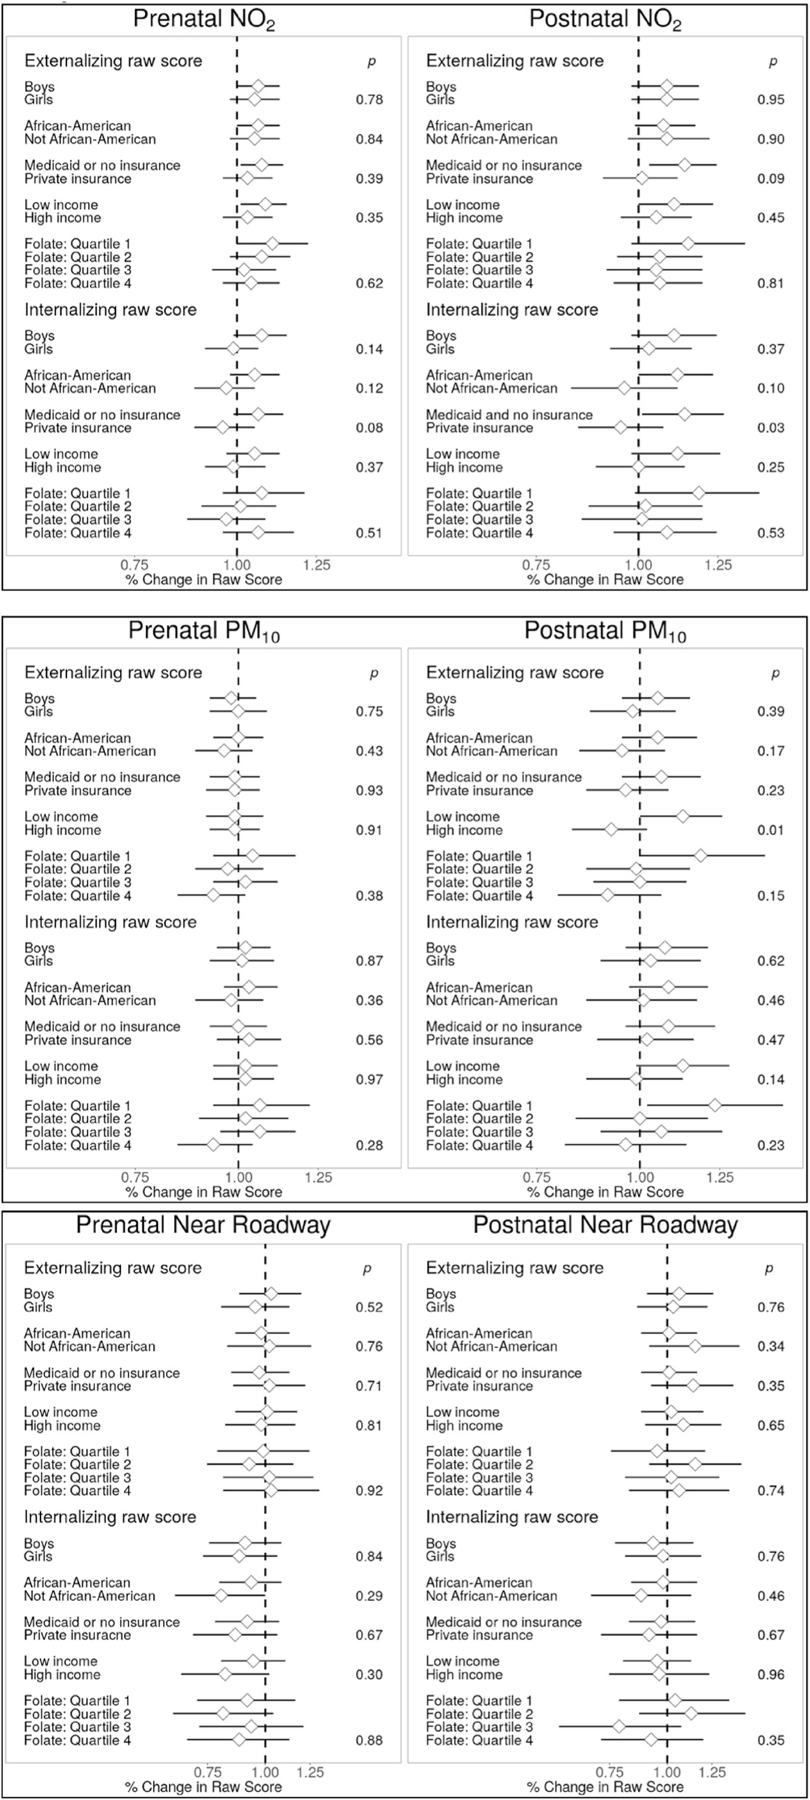
P-values are for interaction terms. All associations estimated using the “full” adjustment models, which include adjustment for child age and sex, temporal splines (for NO2 and PM10 models) maternal characteristics (age, race, education, prenatal smoking, prenatal depression, IQ), breastfeeding, neighborhood COI (postnatal economics score & educational score), insurance status, adjusted household income, child sleep score at assessment and birth order. Models assessing folate were additionally adjusted for folate quartile. Effect sizes for NO2 and PM10 are scaled to a 2 unit increase in pollutants.
3.5. Air pollution and internalizing behavior
Measures of pre- and postnatal air pollution were not associated with internalizing behaviors in the full population (Fig. 2). However, we did observe evidence of effect modification of postnatal NO2 exposure by participant characteristics for this outcome (Fig. 3). Children of African American mothers exhibited stronger positive associations between internalizing scores and postnatal NO2 compared to other races (11% higher [95% CI: 0, 24%] versus a difference of −3.9% [95% CI: −17, 12%] per 2 ppb increase; pinteraction = 0.10). For participants on Medicaid or with no insurance at enrollment, 2 ppb higher postnatal NO2 was associated with 13% higher (95% CI: 1, 27%) internalizing behavior scores, while there was no association among those with private insurance (a difference of −5% [95%CI: −16, 7%] per 2 ppb higher NO2; pinteraction = 0.027). There was little evidence that maternal race, child sex or prenatal folate status affected associations between air pollution and internalizing behavior.
3.6. Sensitivity analyses
In road proximity sensitivity analyses, externalizing scores were significantly higher when larger distance thresholds were used to define proximity to major roadways (300 m and above; Supplemental Table 3). For example, externalizing scores were 13% higher (95% CI: 2, 25%) with prenatal residential locations within 300 m of a busy road; postnatal associations were similar for this threshold (Supplemental Table 3).
Exclusions of participants that moved out of the study region in the postnatal period in the analyses of prenatal exposures did not affect any the findings (results not shown). We explored whether positive associations between NO2 and externalizing behavior observed in linear regression models exhibited signs of nonlinearity using GAM plots, but we detected no statistically significant deviations from linearity (results not shown). Finally, we repeated main models for each exposure with additional control for the other two exposures, and observed no meaningful difference in the findings (Supplemental Table 4).
4. Discussion
We found that prenatal and childhood exposure to higher levels of outdoor air pollution were associated with poorer behavioral outcomes in early childhood in the CANDLE cohort, a large, well-characterized, and diverse birth cohort in the southern US. The most consistent associations were between NO2, a marker of traffic-related pollutants, and maternal report of children’s externalizing behavior problems. Higher NO2 exposure was associated with greater levels of externalizing behaviors as well as increased odds of externalizing scores exceeding clinical thresholds. There was suggestive evidence that these associations were stronger for children in lower SES families. We did not observe any effects of air pollution on internalizing behaviors in the overall population but did find that lower SES and African American children may be more susceptible to pre- or postnatal air pollution exposure with respect to internalizing behaviors.
These findings add to a growing body of epidemiological evidence connecting externalizing behaviors or related disorders with pre- and postnatal exposure to air pollutants (Yorifuji et al., 2017; Perera et al., 2014; Newman et al., 2013; Forns et al., 2016; Alemany et al., 2018; Younan et al., 2018; Roberts et al., 2019; Siddique et al., 2011; Min and Min, 2017). Other work suggests that air pollution exposure may impair specific neurological functions underlying behavioral regulation (Chiu et al., 2016; Harris et al., 2016; Wang et al., 2009; Rivas et al., 2019; Sentís et al., 2017). At the same time, others have reported null or protective associations with externalizing behaviors or related disorders (Abid et al., 2014; Forns et al., 2018; Gong et al., 2014). Our study strengthens collective evidence for an effect of air pollution on behavioral development by addressing some limitations in previous work. CANDLE is a large, prospective prenatal cohort study with rich longitudinal data collection on predictors of pediatric neurodevelopment. Our exposure assessment included spatially-resolved air pollution exposures calculated using validated national models. The CANDLE study collected detailed address histories, including precise dates for most changes of address, which allowed us to estimate more accurate exposures than studies that did not track moves. This level of detail increased our ability to characterize pre-versus postnatal exposure and attempt to describe associations specific to different windows of exposure. Compared to other pregnancy cohorts, the CANDLE cohort has high longitudinal retention and, moreover, we observed little evidence of differential loss-to-follow-up.
Because individual and neighborhood SES are correlated with outdoor air pollution and predictors of child neurodevelopment and behavior, inadequate control for SES could bias associations with air pollution towards or away from the null. In our study and others set in the United States (Harris et al., 2016; Newman et al., 2013) lower SES predicts higher air pollution exposure, while in European studies (Forns et al., 2018; Temam et al., 2017) the opposite was true. Residual confounding by SES could therefore affect observed associations differentially between study regions and contribute to between-study inconsistencies. Many studies of air pollution and pediatric neurodevelopment adjusted for only a single measure of individual-level SES (Chiu et al., 2013, 2016; Perera et al., 2014; Alemany et al., 2018; Rivas et al., 2019; Sentís et al., 2017; Younan et al., 2018; Siddique et al., 2011), and several included individual-level SES variables but not area-level SES (Min and Min, 2017; Perera et al., 2014; Newman et al., 2013; Chiu et al., 2013, 2016; Abid et al., 2014; Midouhas et al., 2019; Sentís et al., 2017; Margolis et al., 2016; Wang et al., 2009), increasing the likelihood of residual confounding (Temam et al., 2017). We controlled for several SES variables at both the individual and neighborhood levels and used staged modeling to explore the robustness of our findings to covariate selection in order to minimize the potential impact of confounding by SES. A related strength of our analysis over some existing work is that missingness of key covariates was very low; we used multiple imputation to additionally control for the HOME score, an observed measure of the home environment and important predictor of child neurodevelopment with differential missingness in this sample.
Our work also expands upon the existing literature by describing associations in a relatively large and diverse cohort that is representative of Shelby County, the most populous county in Tennessee. Previous analyses of cohorts with high proportions of lower SES families and racial/ethnic minorities have been much smaller (Chiu et al., 2013, 2016; Perera et al., 2012, 2014). In addition, our findings are notable in that ambient air pollution exposures are relatively low. Existing studies have described associations in urban regions of Europe and the US with higher air pollution exposures. Median prenatal NO2 and PM10 exposures in the CANDLE study population were 11.9 ppb and 20.7 μg/m3, respectively. The current US air quality standards for NO2 annual averages is 53 ppb. There is no PM10 annual average for comparison, but Memphis has not exceeded the PM10 24-h standard for over 20 years. If causal, the associations measured in this study indicate that health effects are occurring below current regulatory standards.
Relatively few studies have explored susceptibility to air pollution exposure across prenatal and early life stages of development. Distinguishing effects associated with specific exposure windows in observational studies is challenged by the high correlation between exposure periods. Some studies assessed both prenatal and postnatal windows of exposure separately and compared the magnitude of associations across exposure windows (Harris et al., 2016; Sentís et al., 2017; Gong et al., 2014). Others modeled both exposures in regression models concurrently (Chiu et al., 2016; Vishnevetsky et al., 2015; Edwards et al., 2010; Rivas et al., 2019) or conducted sensitivity analyses with restriction by move status (Forns et al., 2018; Porta et al., 2016). In general, evidence from these studies is somewhat stronger for postnatal exposure but overall is inconclusive. We attempted to address this question in our large analytic sample, with excellent detail on participant locations and dates of moves. We found that point estimates for both prenatal and postnatal air pollution with behavior outcomes were similar in magnitude and precision in separate models; with mutual adjustment in the same model, both associations were attenuated and imprecise. Our results therefore are also inconclusive as to whether prenatal or postnatal exposures – or both – drive associations with neurobehavior.
We examined whether associations between prenatal air pollution and child behavior varied by child or maternal characteristics. Sex differences have been evaluated in animal models and epidemiologic studies, with several studies indicating that males are more susceptible to neurotoxic effects of air pollution (Bolton et al., 2017; Costa et al., 2017; Allen et al., 2013, 2014; Chiu et al., 2013; Wang et al., 2017; Rivas et al., 2019). Some epidemiologic studies indicated the opposite (Chiu et al., 2016; Sentís et al., 2017) or found no sex differences (Harris et al., 2016). There was no evidence of effect modification by child sex in this study population. We also assessed whether socio-demographic adversity may increase susceptibility and found that Medicaid insurance status at baseline was associated with significantly stronger associations between pre- or postnatal air pollution exposure and behavioral outcomes. These results were qualitatively similar when SES was modeled using baseline household income. Our findings are consistent with those from diverse cohorts with a large proportion of low-SES families (Vishnevetsky et al., 2015, Wang et al., 2017) and in line with hypotheses that sociodemographic adversity could convey increased susceptibility to air pollution health effects (Hooper and Kaufman, 2018). By contrast, two analyses in study populations with higher SES participants did not observe stronger adverse effects among lower SES participants (Harris et al., 2016; Newman et al., 2013), possibly due to lack of variability in SES.
We did not observe significant effect modification by maternal folate for any air pollution-behavior association, but findings were generally suggestive of a stronger association between both internalizing and externalizing problems with postnatal PM10 and NO2 exposure among those whose mothers were in the lowest quartile of plasma folate during pregnancy. In a prior study, we observed a stronger, negative association between prenatal PM10 exposure and child IQ among women in the lowest quartile of folate during pregnancy (Loftus et al., 2019). In this study population, women within the lowest folate quartile had levels defined as possibly deficient by the World Health Organization (WHO, 2012). While results in the current study were inconclusive, collectively these two papers begin to suggest that adequate folate intake may be an important source of resilience to the neurotoxic effects of air pollution exposure in both the pre and post-natal period. These associations need to be tested in other populations and are an important area for future research.
Toxicological research provides evidence of several potential mechanisms by which exposure to air pollution in early life may have a lasting impact on brain development and subsequent behavior. General mechanisms by which prenatal air pollution may interfere with healthy fetal neurodevelopment include by increased placental and fetal inflammation and oxidative stress (Block et al., 2012; Costa et al., 2017) or through altered epigenetic programming in the placenta or fetus (Peng et al., 2018). Exposure in the postnatal period may lead to deterioration of the blood-brain barrier, oxidative stress, neuroinflammation and microglial activation (Block et al., 2012; Suades-Gonzales et al., 2015). Some lines of evidence suggest that such effects increase risk of externalizing disorders specifically. Pediatric brain imaging suggests that the pre-frontal cortex, a region of the brain believed to be essential for development of behavioral regulation, may be particularly sensitive to the effects of air pollution on the developing central nervous system (Peterson et al., 2015; Pujol et al., 2016; Mortamais et al., 2017).
Our study has several strengths, as described above, but there are important limitations to note as well. The approach to exposure assessment provides limited information as to which components of air pollution drive associations with neurodevelopment, assuming that observed associations reflect a true causal effect. Associations were strongest for NO2, a marker for traffic-related air pollution, a complex mixture of numerous chemical species and particle sizes including several linked to neurotoxic effects, such as PAHs, fine and ultrafine particulates, lead, and volatile organic compounds (VOCs). Some of the most robust epidemiological evidence for developmental neurotoxicity of air pollution is linked to PAHs (Block et al., 2012; Costa et al., 2017; Vishnevetsky et al., 2015; Perera et al., 2009, 2014; Mortamais et al., 2017; Peterson et al., 2015; Margolis et al., 2016; Edwards et al., 2010), a combustion-related pollutant generated by traffic, particularly diesel vehicles, and industrial point sources in urban areas (Ravindra, 2008). The Memphis area is a major transportation hub in the mid-Atlantic region of the United States, with the busiest airport for cargo traffic, the third largest rail center, and one of the largest river ports in the country. In addition, several industries in Memphis release combustion by-products, including a coal-fired power plant and a refinery. Our future research activities will include analyses of PAH biomarkers in multiple trimesters of prenatal urine across the CANDLE cohort. We did not test associations with PM2.5 due to inadequate between-participant variability in this population; this is a key limitation in light of research indicating that small particulates may be drivers of the neurotoxic potential of PM. Another limitation is that noise associated with proximity to busy traffic could be a confounder in our main analyses, and we did not have any data on ambient noise in the study region, which would have allowed us to adjust for this factor. Note that we controlled for child sleep at the time of assessment in all models, which may be sufficient to block this potential pathway of confounding. Finally, we did not account for air quality in the indoor environment, which is a limitation in light of recent studies indicating that indoor exposures may have a substantial impact on short- and long-term neurodevelopment (Forns et al., 2017; Midouhas et al., 2019).
5. Conclusion
In a large and diverse cohort representative of an understudied US population, we observed associations between air pollution and children’s externalizing and internalizing behavior problems. Some associations were stronger among lower SES and African American families. These findings expand on existing evidence that air pollution impairs pediatric neurodevelopment; importantly, the results suggest that health effects may be occurring at exposures below current standards of the US Environmental Protection Agency (EPA). If confirmed, national standards should be revised lower to minimize adverse impacts of air pollution on children’s health and development.
Supplementary Material
Funding source
Environmental influences on Child Health Outcomes (ECHO) is a nationwide research program supported by the National Institutes of Health (NIH), Office of the Director, to enhance child health; ECHO PATHWAYS is one research center funded by this program (1UG3OD023271-01, 4UH3OD023271-03). The CANDLE study was funded by the Urban Child Institute and NIH (R01 HL109977). The air pollution models were developed under STAR research assistance agreements, No. RD831697 (MESA Air) and RD-83830001 (MESA Air Next Stage), awarded by the U.S. Environmental Protection Agency. This manuscript has not been formally reviewed by the EPA. The views expressed in this document are solely those of the authors and the EPA does not endorse any products or commercial services mentioned in this publication. This project was supported by funding from NIH P30ES007033 (PI: Joel Kaufman).
Footnotes
Declaration of competing interest
The authors report no conflicts of interest relevant to this article.
Appendix A. Supplementary data
Supplementary data to this article can be found online at https://doi.org/10.1016/j.envres.2019.109075.
ADHD – Attention Deficit Disorder; BSI – Brief Symptom Inventory; CANDLE - Conditions Affecting Neurocognitive Development and Learning in Early Childhood; CBCL – Child Behavior Checklist; CI – Confidence Intervals; COI – Childhood Opportunity Index; CSHQ – Children’s Sleep Habits Questionnaire; ECHO – Environmental Influences on Child Health Outcomes; EPA – Environmental Protection Agency; HOME – Home Observation Measurement of the Environment; IQ – Intelligence Quotient; IQR – Interquartile Range; IRB – Institutional Review Board; KIDI – Knowledge of Infant Development Inventory; NO2 – Nitrogen Dioxide; OR – Odds Ratio; PM – Particulate Matter; PM10 – Particulate Matter of 10 μm or Less in Aerodynamic Diameter; PM2.5 – Particulate Matter of 2.5 μm or Less in Aerodynamic Diameter; SD – Standard Deviation; SES – Socioeconomic Status; TN – Tennessee; US – United States; WASI – Weschler Abbreviated Scale of Intelligence.
References
- Abid Z, Roy A, Herbstman JB, Ettinger AS, 2014. Urinary polycyclic aromatic hydrocarbon metabolites and attention/deficit hyperactivity disorder, learning disability, and special education in U.S. children aged 6 to 15. J. Environ. Public Health 2014, 628508. 10.1155/2014/628508. Epub 2014 Jan 30. [DOI] [PMC free article] [PubMed] [Google Scholar]
- Achenbach TM, 2009. The Achenbach System of Empirically Based Assessment (ASEBA): Development, Findings, Theory, and Applications University of Vermont Research Center for Children, Youth, & Families, Burlington, VT. [Google Scholar]
- Achenbach TM, Rescorla LA, 2000. Manual for the ASEBA Preschool Forms & Profiles University of Vermont, Research Center for Children, Youth, & Families, Burlington, VT. [Google Scholar]
- Achenbach TM, Ruffle TM, 2000. The Child Behavior Checklist and related forms for assessing behavioral/emotional problems and competencies. Pediatr. Rev (8), 265–271 Aug;21. [DOI] [PubMed] [Google Scholar]
- Alemany S, Vilor-Tejedor N, García-Esteban R, Bustamante M, Dadvand P, Esnaola M, Mortamais M, Forns J, van Drooge BL, Álvarez-Pedrerol M, Grimalt JO, Rivas I, Querol X, Pujol J, Sunyer J, 2018. Aug 2. Traffic-related air pollution, APOEε4 status, and neurodevelopmental outcomes among school children enrolled in the BREATHE project (Catalonia, Spain). Environ. Health Perspect 126 (8), 087001. [DOI] [PMC free article] [PubMed] [Google Scholar]
- Allen JL, Conrad K, Oberdörster G, Johnston CJ, Sleezer B, Cory-Slechta DA, 2013. Jan. Developmental exposure to concentrated ambient particles and preference for immediate reward in mice. Environ. Health Perspect 121 (1), 32–38. [DOI] [PMC free article] [PubMed] [Google Scholar]
- Allen JL, Liu X, Weston D, et al. , 2014. Jul. Developmental exposure to concentrated ambient ultrafine particulate matter air pollution in mice results in persistent and sex-dependent behavioral neurotoxicity and glial activation. Toxicol. Sci 140 (1), 160–178. [DOI] [PMC free article] [PubMed] [Google Scholar]
- Althoff RR, Verhulst FC, Rettew DC, Hudziak JJ, van der Ende J, 2010. Nov. Adult outcomes of childhood dysregulation: a 14-year follow-up study. J. Am. Acad. Child Adolesc. Psychiatry 49 (11), 1105–1116. [DOI] [PMC free article] [PubMed] [Google Scholar]
- Axelrod BN, 2002. Mar. Validity of the Wechsler abbreviated scale of intelligence and other very short forms of estimating intellectual functioning. Assessment 9 (1), 17–23. [DOI] [PubMed] [Google Scholar]
- Basner M, McGuire S, 2018. Mar 14. WHO environmental noise guidelines for the European region: a systematic review on environmental noise and effects on sleep. Int. J. Environ. Res. Public Health (3), 15 pii: E519. [DOI] [PMC free article] [PubMed] [Google Scholar]
- Block ML, Elder A, Auten RL, Bilbo SD, Chen H, Chen JC, Cory-Slechta DA, Costa D, Diaz-Sanchez D, Dorman DC, Gold DR, Gray K, Jeng HA, Kaufman JD, Kleinman MT, Kirshner A, Lawler C, Miller DS, Nadadur SS, Ritz B, Semmens EO, Tonelli LH, Veronesi B, Wright RO, Wright RJ, 2012. Oct. The outdoor air pollution and brain health workshop. Neurotoxicology 33 (5), 972–984. [DOI] [PMC free article] [PubMed] [Google Scholar]
- Bolton JL, Marinero S, Hassanzadeh T, Natesan D, Le D, Belliveau C, Mason SN, Auten RL, Bilbo SD, 2017. May 31. Gestational exposure to air pollution alters cortical volume, microglial morphology, and microglia-neuron interactions in a sex-specific manner. Front. Synaptic Neurosci 9, 10. [DOI] [PMC free article] [PubMed] [Google Scholar]
- Chiu YH, Bellinger DC, Coull BA, Anderson S, Barber R, Wright RO, Wright RJ, 2013. Jul. Associations between traffic-related black carbon exposure and attention in a prospective birth cohort of urban children. Environ. Health Perspect 121 (7), 859–864. 10.1289/ehp.1205940. [DOI] [PMC free article] [PubMed] [Google Scholar]
- Chiu YH, Hsu HH, Coull BA, Bellinger DC, Kloog I, Schwartz J, Wright RO, Wright RJ, 2016. Feb. Prenatal particulate air pollution and neurodevelopment in urban children: examining sensitive windows and sex-specific associations. Environ. Int 87, 56–65. 10.1016/j.envint.2015.11.010. [DOI] [PMC free article] [PubMed] [Google Scholar]
- Clark LP, Millet DB, Marshall JD, 2014. National patterns in environmental injustice and inequity: outdoor NO2 air pollution in the United States. PLoS One 9, 8. [DOI] [PMC free article] [PubMed] [Google Scholar]
- Costa LG, Cole TB, Coburn J, Chang YC, Dao K, Roqué PJ, 2017. Mar. Neurotoxicity of traffic-related air pollution. Neurotoxicology 59, 133–139. [DOI] [PMC free article] [PubMed] [Google Scholar]
- Derogatis LR, 1993. BSI Brief Symptom Inventory: Administration, Scoring, and Procedure Manual, fourth ed. National Computer Systems, Minneapolis, MN. [Google Scholar]
- Di Q, Dai L, Wang Y, Zanobetti A, Choirat C, Schwartz JD, Dominici F, 2017. Dec 26. Association of short-term exposure to air pollution with mortality in older adults. J. Am. Med. Assoc 318 (24), 2446–2456. [DOI] [PMC free article] [PubMed] [Google Scholar]
- Edwards SC, Jedrychowski W, Butscher M, Camann D, Kieltyka A, Mroz E, Flak E, Li Z, Wang S, Rauh V, Perera F, 2010. Sep. Prenatal exposure to airborne polycyclic aromatic hydrocarbons and children’s intelligence at 5 years of age in a prospective cohort study in Poland. Environ. Health Perspect 118 (9), 1326–1331. 10.1289/ehp.0901070. [DOI] [PMC free article] [PubMed] [Google Scholar]
- Forns J, Dadvand P, Esnaola M, Alvarez-Pedrerol M, López-Vicente M, Garcia-Esteban R, Cirach M, Basagaña X, Guxens M, Sunyer J, 2017. Nov. Longitudinal association between air pollution exposure at school and cognitive development in school children over a period of 3.5 years. Environ. Res 159, 416–421. [DOI] [PubMed] [Google Scholar]
- Forns J, Dadvand P, Foraster M, Alvarez-Pedrerol M, Rivas I, López-Vicente M, Suades-Gonzalez E, Garcia-Esteban R, Esnaola M, Cirach M, Grellier J, Basagaña X, Querol X, Guxens M, Nieuwenhuijsen MJ, Sunyer J, 2016. Apr. Traffic-related air pollution, noise at school, and behavioral problems in Barcelona schoolchildren: a cross-sectional study. Environ. Health Perspect 124 (4), 529–535. 10.1289/ehp.1409449. [DOI] [PMC free article] [PubMed] [Google Scholar]
- Forns J, Sunyer J, Garcia-Esteban R, Porta D, Ghassabian A, Giorgis-Allemand L, Gong T, Gehring U, Sørensen M, Standl M, Sugiri D, Almqvist C, Andiarena A, Badaloní C, Beelen R, Berdel D, Cesaroni G, Charles MA, Eriksen KT, Estarlich M, Fernandez MF, Forhan A, Jaddoe VWV, Korek M, Lichtenstein P, Lertxundi A, Lopez-Espinosa MJ, Markevych I, de Nazelle A, Raaschou-Nielsen O, Nieuwenhuijsen M, Pérez-Lobato R, Philippat C, Slama R, Tiesler CMT, Verhulst FC, von Berg A, Vrijkotte T, Nybo Andersen AM, Heude B, Krämer U, Heinrich J, Tiemeier H, Forastiere F, Pershagen G, Brunekreef B, Guxens M, 2018. Sep. Air pollution exposure during pregnancy and symptoms of attention deficit and hyperactivity disorder in children in Europe. Epidemiology 29 (5), 618–626. 10.1097/EDE.0000000000000874. [DOI] [PubMed] [Google Scholar]
- Frankenburg WK, Coons CE, 1986. Apr. Home Screening Questionnaire: its validity in assessing home environment. J. Pediatr 108 (4), 624–626 [DOI] [PubMed] [Google Scholar]
- Gong T, Almqvist C, Bölte S, Lichtenstein P, Anckarsäter H, Lind T, Lundholm C, Pershagen G, 2014. Dec. Exposure to air pollution from traffic and neurodevelopmental disorders in Swedish twins. Twin Res. Hum. Genet 17 (6), 553–562. 10.1017/thg.2014.58. [DOI] [PubMed] [Google Scholar]
- Gregory AM, Eley TC, O’Connor TG, Plomin R, 2004. Jun. Etiologies of associations between childhood sleep and behavioral problems in a large twin sample. J. Am. Acad. Child Adolesc. Psychiatry 43 (6), 744–751. [DOI] [PubMed] [Google Scholar]
- Hagenaars A, de Vos andZaidi KMA, 1994. Poverty Statistics in the Late 1980s. Research Based on Micro-data, Office for Official Publications of the European Communities. Luxembourg. [Google Scholar]
- Hajat A, Hsia C, O’Neill MS, 2015. Dec. Socioeconomic disparities and air pollution exposure: a global review. Curr. Environ. Health Rep 2 (4), 440–450. 10.1007/s40572-015-0069-5. [DOI] [PMC free article] [PubMed] [Google Scholar]
- Harris MH, Gold DR, Rifas-Shiman SL, Melly SJ, Zanobetti A, Coull BA, Schwartz JD, Gryparis A, Kloog I, Koutrakis P, Bellinger DC, Belfort MB, Webster TF, White RF, Sagiv SK, Oken E, 2016. Sep - Oct. Prenatal and childhood traffic-related air pollution exposure and childhood executive function and behavior. Neurotoxicol. Teratol 57, 60–70. 10.1016/j.ntt.2016.06.008. [DOI] [PMC free article] [PubMed] [Google Scholar]
- Haynes EN, Chen A, Ryan P, Succop P, Wright J, Dietrich KN, 2011. Nov. Exposure to airborne metals and particulate matter and risk for youth adjudicated for criminal activity. Environ. Res 111 (8), 1243–1248. 10.1016/j.envres.2011.08.008. [DOI] [PMC free article] [PubMed] [Google Scholar]
- Hofstra MB, Van der Ende J, Verhulst FC, 2000. Jul. Continuity and change of psychopathology from childhood into adulthood: a 14-year follow-up study. J. Am. Acad. Child Adolesc. Psychiatry 39 (7), 850–858 [DOI] [PubMed] [Google Scholar]
- Hooper LG, Kaufman JD, 2018. Apr. Ambient air pollution and clinical implications for susceptible populations. Ann. Am. Thorac. Soc 15 (Suppl. 2), S64–S68. [DOI] [PMC free article] [PubMed] [Google Scholar]
- Loftus CT, Hazlehurst MF, Szpiro AA, Ni Y, Tylavsky FA, Bush NR, Sathyanarayana S, Carroll KN, Karr CJ, LeWinn KZ, 2019. Sep. Prenatal air pollution and childhood IQ: preliminary evidence of effect modification by folate. Environ. Res 176, 108505. [DOI] [PMC free article] [PubMed] [Google Scholar]
- MacPhee David, 1981. “Knowledge of Infant Development Inventory (KIDI),” Chapel Hill University of North Carolina, Department of Psychology, N.C. [Google Scholar]
- Margolis AE, Herbstman JB, Davis KS, Thomas VK, Tang D, Wang Y, Wang S, Perera FP, Peterson BS, Rauh VA, 2016. Jul. Longitudinal effects of prenatal exposure to air pollutants on self-regulatory capacities and social competence. JCPP (J. Child Psychol. Psychiatry) 57 (7), 851–860. 10.1111/jcpp.12548. [DOI] [PMC free article] [PubMed] [Google Scholar]
- Midouhas E, Kokosi T, Flouri E, 2019. Apr 15. The quality of air outside and inside the home: associations with emotional and behavioural problem scores in early childhood. BMC Public Health 19 (1), 406. 10.1186/s12889-019-6733-1. [DOI] [PMC free article] [PubMed] [Google Scholar]
- Mikati I, Benson AF, Luben TJ, Sacks JD, Richmond-Bryant J, 2018. Apr. Disparities in distribution of particulate matter emission sources by race and poverty status. Am. J. Public Health 108 (4), 480–485. 10.2105/AJPH.2017.304297. [DOI] [PMC free article] [PubMed] [Google Scholar]
- Min JY, Min KB, 2017. Feb. Exposure to ambient PM(10) and NO(2) and the incidence of attention-deficit hyperactivity disorder in childhood. Environ. Int 99, 221–227. 10.1016/j.envint.2016.11.022. Epub 2016 Dec 7. [DOI] [PubMed] [Google Scholar]
- Moffitt TE, 1993. Oct. Adolescence-limited and life-course-persistent antisocial behavior: a developmental taxonomy. Psychol. Rev 100 (4), 674–701 Review. [PubMed] [Google Scholar]
- Mortamais M, Pujol J, van Drooge BL, Macià D, Martínez-Vilavella G, Reynes C, Sabatier R, Rivas I, Grimalt J, Forns J, Alvarez-Pedrerol M, Querol X, Sunyer J, 2017. Aug. Effect of exposure to polycyclic aromatic hydrocarbons on basal ganglia and attention-deficit hyperactivity disorder symptoms in primary school children. Environ. Int 105, 12–19. [DOI] [PubMed] [Google Scholar]
- Newman NC, Ryan P, Lemasters G, Levin L, Bernstein D, Hershey GK, Lockey JE, Villareal M, Reponen T, Grinshpun S, Sucharew H, Dietrich KN, 2013. Jun. Traffic-related air pollution exposure in the first year of life and behavioral scores at 7 years of age. Environ. Health Perspect 121 (6), 731–736. [DOI] [PMC free article] [PubMed] [Google Scholar]
- Owens JA, Spirito A, McGuinn M, 2000. Dec 15. The Children’s Sleep Habits Questionnaire (CSHQ): psychometric properties of a survey instrument for school-aged children. Sleep 23 (8), 1043–1051 [PubMed] [Google Scholar]
- Peng C, den Dekker M, Cardenas A, et al. , 2018. Sep. Residential proximity to major roadways at birth, DNA methylation at birth and midchildhood, and childhood cognitive test scores: Project viva(Massachusetts, USA). Environ. Health Perspect 126 (9), 97006. [DOI] [PMC free article] [PubMed] [Google Scholar]
- Perera FP, Chang HW, Tang D, et al. , 2014. Nov 5. Early-life exposure to polycyclic aromatic hydrocarbons and ADHD behavior problems. PLoS One 9 (11), e111670. [DOI] [PMC free article] [PubMed] [Google Scholar]
- Perera FP, Li Z, Whyatt R, et al. , 2009. Aug. Prenatal airborne polycyclic aromatic hydrocarbon exposure and child IQ at age 5 years. Pediatrics 124 (2), e195–202. [DOI] [PMC free article] [PubMed] [Google Scholar]
- Perera FP, Tang D, Wang S, Vishnevetsky J, Zhang B, Diaz D, Camann D, Rauh V, 2012. Jun. Prenatal polycyclic aromatic hydrocarbon (PAH) exposure and child behavior at age 6–7 years. Environ. Health Perspect 120 (6), 921–926. [DOI] [PMC free article] [PubMed] [Google Scholar]
- Peterson BS, Rauh VA, Bansal R, et al. , 2015. Effects of prenatal exposure to air pollutants (polycyclic aromatic hydrocarbons) on the development of brain white matter, cognition, and behavior in later childhood. JAMA Psychiatry 72 (6), 531–540. 10.1001/jamapsychiatry.2015.57. [DOI] [PMC free article] [PubMed] [Google Scholar]
- Petty CR, Rosenbaum JF, Hirshfeld-Becker DR, Henin A, Hubley S, LaCasse S, Faraone SV, Biederman J, 2008. The child behavior checklist broad-band scales predict subsequent psychopathology: a 5-year follow-up. J. Anxiety Disord 22 (3), 532–539. 10.1016/j.janxdis.2007.04.003. Epub 2007 Apr 21. [DOI] [PMC free article] [PubMed] [Google Scholar]
- Porta D, Narduzzi S, Badaloni C, et al. , 2016. Mar. Air pollution and cognitive development at age 7 in a prospective Italian birth cohort. Epidemiology 27 (2), 228–236. [DOI] [PubMed] [Google Scholar]
- Pujol J, Fenoll R, Macià D, Martínez-Vilavella G, Alvarez-Pedrerol M, Rivas I, Forns J, Deus J, Blanco-Hinojo L, Querol X, Sunyer J, 2016. Apr 22. Airborne copper exposure in school environments associated with poorer motor performance and altered basal ganglia. Brain Behav 6 (6), e00467. [DOI] [PMC free article] [PubMed] [Google Scholar]
- Ravindra, 2008. Atmospheric polycyclic aromatic hydrocarbons: Source attribution, emission factors and regulation. Atmos. Environ [Google Scholar]
- Rivas I, Basagaña X, Cirach M, López-Vicente M, Suades-González E, Garcia-Esteban R, Álvarez-Pedrerol M, Dadvand P, Sunyer J, 2019. May. Association between early life exposure to air pollution and working memory and attention. Environ. Health Perspect 127 (5), 57002. 10.1289/EHP3169. [DOI] [PMC free article] [PubMed] [Google Scholar]
- Roberts S, Arseneault L, Barratt B, Beevers S, Danese A, Odgers CL, Moffitt TE, Reuben A, Kelly FJ, Fisher HL, 2019. Feb. Exploration of NO(2) and PM(2.5) air pollution and mental health problems using high-resolution data in London-based children from a UK longitudinal cohort study. Psychiatry Res 272, 8–17. 10.1016/j.psychres.2018.12.050. [DOI] [PMC free article] [PubMed] [Google Scholar]
- Roy A, Kocak M, Hartman TJ, Vereen S, Adgent M, Piyathilake C, Tylavsky FA, Carroll KN, 2018. Mar. Association of prenatal folate status with early childhood wheeze and atopic dermatitis. Pediatr. Allergy Immunol 29 (2), 144–150. 10.1111/pai.12834. Epub 2017 Dec 19. [DOI] [PMC free article] [PubMed] [Google Scholar]
- Rubin DB, 2004. Multiple Imputation for Nonresponse in Surveys John Wiley and Sons, New York. [Google Scholar]
- Sampson PD, Richards M, Szpiro AA, et al. , 2013. Aug 1. A regionalized national universal kriging model using Partial Least Squares regression for estimating annual PM(2.5) concentrations in epidemiology. Atmos. Environ 75, 383–392. [DOI] [PMC free article] [PubMed] [Google Scholar]
- Schraufnagel DE, Balmes JR, Cowl CT, De Matteis S, Jung SH, Mortimer K, Perez-Padilla R, Rice MB, Riojas-Rodriguez H, Sood A, Thurston GD, To T, Vanker A, Wuebbles DJ, 2019. Feb. Air pollution and noncommunicable diseases: a review by the forum of international respiratory societies’ environmental committee, Part 1: the damaging effects of air pollution. Chest 155 (2), 409–416. [DOI] [PMC free article] [PubMed] [Google Scholar]
- Sentís A, Sunyer J, Dalmau-Bueno A, Andiarena A, Ballester F, Cirach M, Estarlich M, Fernández-Somoano A, Ibarluzea J, Íñiguez C, Lertxundi A, Tardón A, Nieuwenhuijsen M, Vrijheid M, Guxens M, INMA Project, 2017. Sep. Prenatal and postnatal exposure to NO(2) and child attentional function at 4–5years of age. Environ. Int 106, 170–177. 10.1016/j.envint.2017.05.021. Epub 2017 Jul 6. [DOI] [PubMed] [Google Scholar]
- Shaw DS, Gilliom M, Ingoldsby EM, Nagin DS, 2003. Mar. Trajectories leading to school-age conduct problems. Dev. Psychol 39 (2), 189–200 [DOI] [PubMed] [Google Scholar]
- Siddique S, Banerjee M, Ray MR, Lahiri T, 2011. Jul. Attention-deficit hyperactivity disorder in children chronically exposed to high level of vehicular pollution. Eur. J. Pediatr 170 (7), 923–929. 10.1007/s00431-010-1379-0. [DOI] [PubMed] [Google Scholar]
- Sontag-Padilla LM, Burns RM, Shih RA, et al. , 2015. The Urban Child Institute CANDLE Study: Methodological Overview and Baseline Sample Description RAND Corporation, Santa Monica, CA. [Google Scholar]
- Suades-González E, Gascon M, Guxens M, Sunyer J, 2015. Oct. Air pollution and neuropsychological development: a review of the latest evidence. Endocrinology 156 (10), 3473–3482. 10.1210/en.2015-1403. Epub 2015 Aug 4. [DOI] [PMC free article] [PubMed] [Google Scholar]
- Temam S, Burte E, Adam M, Antó JM, Basagaña X, Bousquet J, Carsin AE, Galobardes B, Keidel D, Künzli N, Le Moual N, Sanchez M, Sunyer J, Bono R, Brunekreef B, Heinrich J, de Hoogh K, Jarvis D, Marcon A, Modig L, Nadif R, Nieuwenhuijsen M, Pin I, Siroux V, Stempfelet M, Tsai MY, Probst-Hensch N, Jacquemin B, 2017. Apr. Socioeconomic position and outdoor nitrogen dioxide (NO (2)) exposure in Western Europe: a multi-city analysis. Environ. Int 101, 117–124. [DOI] [PubMed] [Google Scholar]
- Vishnevetsky J, Tang D, Chang HW, Roen EL, Wang Y, Rauh V, Wang S, Miller RL, Herbstman J, Perera FP, 2015. May-Jun. Combined effects of prenatal polycyclic aromatic hydrocarbons and material hardship on child IQ. Neurotoxicol. Teratol 49, 74–80. 10.1016/j.ntt.2015.04.002. Epub 2015 Apr 23. [DOI] [PMC free article] [PubMed] [Google Scholar]
- Wang, et al. , 2017. Socioeconomic disparities and sexual dimorphism in neurotoxic effects of ambient fine particles on youth IQ: A longitudinal analysis. PLoS One [DOI] [PMC free article] [PubMed] [Google Scholar]
- Wang S, Zhang J, Zeng X, Zeng Y, Wang S, Chen S, 2009. Oct. Association of traffic-related air pollution with children’s neurobehavioral functions in Quanzhou, China. Environ. Health Perspect 117 (10), 1612–1618. 10.1289/ehp.0800023. Epub 2009 May 11. [DOI] [PMC free article] [PubMed] [Google Scholar]
- WHO, 2012. Serum and Red Blood Cell Folate Concentrations for Assessing Folate Status in Populations. Vitamin and Mineral Nutrition Information System World Health Organization, Geneva. http://apps.who.int/iris/bitstream/10665/75584/1/WHO_NMH_NHD_EPG_12.1_eng.pdf, Accessed date: 9 September 2019. [Google Scholar]
- Yorifuji T, Kashima S, Diez MH, Kado Y, Sanada S, Doi H, 2017. Feb. Prenatal exposure to outdoor air pollution and child behavioral problems at school age in Japan. Environ. Int 99, 192–198. 10.1016/j.envint.2016.11.016. Epub 2016 Nov 24. [DOI] [PubMed] [Google Scholar]
- Yorifuji T, Kashima S, Higa Diez M, Kado Y, Sanada S, Doi H, 2016. Jan. Prenatal exposure to traffic-related air pollution and child behavioral development milestone delays in Japan. Epidemiology 27 (1), 57–65. 10.1097/EDE.0000000000000361. [DOI] [PubMed] [Google Scholar]
- Younan D, Tuvblad C, Franklin M, Lurmann F, Li L, Wu J, Berhane K, Baker LA, Chen JC, 2018. Aug. Longitudinal analysis of particulate air pollutants and adolescent delinquent behavior in southern California. J. Abnorm. Child Psychol 46 (6), 1283–1293. 10.1007/s10802-017-0367-5. [DOI] [PMC free article] [PubMed] [Google Scholar]
- Young MT, Bechle MJ, Sampson PD, Szpiro AA, Marshall JD, Sheppard L, Kaufman JD, 2016. Apr 5. Satellite-based NO2 and model validation in a national prediction model based on universal kriging and land-use regression. Environ. Sci. Technol 50 (7), 3686–3694. 10.1021/acs.est.5b05099. Epub 2016 Mar 21. [DOI] [PMC free article] [PubMed] [Google Scholar]
- Zare Sakhvidi F, Zare Sakhvidi MJ, Mehrparvar AH, Dzhambov AM, 2018. Sep. Environmental noise exposure and neurodevelopmental and mental health problems in children: a systematic review. Curr. Environ. Health Rep 5 (3), 365–374. [DOI] [PubMed] [Google Scholar]
Associated Data
This section collects any data citations, data availability statements, or supplementary materials included in this article.