

Abstract
No research has considered a range of physician practice capabilities for managing patient care when examining practice-level influences on quality of care, utilization, and spending. Using data from the 2017 National Survey of Healthcare Organizations and Systems (n = 1,772 practices) linked to 2017 Medicare fee-for-service claims data from attributed beneficiaries (n = 1,511,938), the association of practice-level capabilities with process measures of quality, utilization, and spending was examined. In propensity score–weighted mixed effects regression analyses, physician practice locations with “robust” capabilities had lower total spending compared with practice locations with “mixed” or “limited” capabilities. Quality and utilization, however, did not differ by practice-level capabilities. Physician practice locations with robust capabilities deliver comparable quality to Medicare fee-for-service beneficiaries with lower spending. Reforms beyond those targeting practice capabilities, including multipayer alignment and payment reform, may be needed to support larger performance advantages for practices with robust capabilities.
Delivering high-quality health care has become increasingly complex as organizations transition to coordinating patient-centered longitudinal care to address the complex needs of patients with multiple chronic illnesses. Given high and escalating health care costs in the United States and evidence of considerable waste and poor patient outcomes,1 value-based payment models are being disseminated throughout the industry to control costs while meeting predetermined quality targets.2 To achieve these goals, physician organizations and health care systems are being encouraged to invest in developing physician practice capabilities such as robust technology and innovation capacity, management and team cultures, and a strong orientation to delivering patient-centered care.3,4
No national evidence exists about whether physician practices with a range of capabilities for managing care achieve better quality and cost performance. An exception is the work of William Weeks and colleagues,5 which examined large multispecialty groups that were members of the Council of Accountable Physician Practices and were hypothesized to have a robust set of care management capabilities but did not actually assess practice-level characteristics or capabilities. Weeks and colleagues found that medical groups affiliated with the council had better performance on claims-based process measures of quality, at a 3.6 percent lower annual cost ($272 lower cost per Medicare fee-for-service beneficiary). These findings provide important historical information about the potential benefits of capabilities commonly developed by multispecialty practices. Recent national evidence indicates that clinical and financial integration are associated with lower spending,6 but no research has examined whether physician practices achieve better quality or lower total cost of care if they possess a range of capabilities that enable clinical integration, including evidence-based guidelines,7 electronic health record (EHR)-based decision support,8 complex care management,9 and innovative approaches to deliver patient-centered care.10 These practice-level capabilities may better explain quality, utilization, and spending than financial integration or affiliations with professional organizations.
We directly address these evidence gaps using a nationally representative set of physician practices linked to claims-derived process measures of quality, utilization, and spending for Medicare fee-for-service beneficiaries. We hypothesize that beneficiaries attributed to physician practice locations with “robust” capabilities will consistently receive process measures of quality and have lower utilization and spending compared with patients attributed to physician practice locations with relatively limited capabilities.
Study Data Methods
Data
Data were from the practice version of the 2017–18 National Survey of Healthcare Organizations and Systems, a nationally representative sample of physician practice locations with three or more physicians in the 2016 IQVIA OneKey database of primary care and multispecialty medical practices. Stratified-cluster sampling was used to select physician practice locations operating under different organizational structures. The National Survey of Healthcare Organizations and Systems physician practice survey had 4,972 outgoing surveys and 2,333 responses returned, yielding a 47 percent response rate. After excluding practice responses with missing data on key study variables, the survey sample included 2,190 practices. Online appendix exhibit A1 compares practice characteristics for respondent and nonrespondent practices with data from the National Survey of Healthcare Organizations and Systems practice survey.11
These National Survey of Healthcare Organizations and Systems responses were linked to 2017 claims data from Medicare fee-for-service beneficiaries, using physician taxpayer identification numbers. We attributed patients to practice locations using methods that the Centers for Medicare and Medicaid Services (CMS) uses as part of their Medicare Shared Savings Program, which is a well-documented and widely accepted method.12 This method favors assignment of patients to primary care clinicians over specialists and is based on where patients receive the plurality of their primary care.13 We used the 2017 Medicare Part A and Part B fee-for-service claims data to determine diagnoses and process measures of quality, utilization, and spending and the Master Beneficiary Summary File to capture patient demographics and date of death. The claims database also integrated data from the census to determine the median annual household income within each beneficiary’s five-digit ZIP code and whether the beneficiary resided in a census track with high poverty (≥20 percent of residents earning at or below 100 percent of the federal poverty level).
The beneficiary sample was restricted to attributed beneficiaries ages sixty-six or older because of the clinical heterogeneity of young, disabled Medicare beneficiaries and their concentration in specialized care settings. Patients diagnosed with end-stage renal disease were excluded (n = 9,081) because of different coverage and specialization considerations. The final analytic sample included 1,511,938 Medicare fee-for-service beneficiaries attributed to 1,772 physician practice locations with National Survey of Healthcare Organizations and Systems responses.
Physician Practice Location Capabilities
The main independent variable is a categorical variable reflecting each physician practice location’s capabilities (“robust” versus “mixed” versus “limited”). Given the lack of a gold standard to measure practice capabilities, a measure was developed using cluster analysis coupled with a modified Delphi expert panel process,14 where participants discussed and iteratively ranked ten practice capabilities across three domains: technology and innovation capacity, management and culture, and patient-centered care focus. Ten practice capabilities were prioritized. Four were technology and innovation capacity measures, which assessed practice adoption and implementation of care management programs for complex patients (six items), use of evidence-based guidelines for specific clinical areas (eight items), EHR decision support functions (eight items), and use of disease registries for seven conditions (eight items). Three measures assessed management and culture capacity and included learning and team culture (nine items), capacity for innovation (six items), and depression care management (six items) because effective depression care requires high practice orientation to learning and teamwork.15 Three composite measures of the patient-centered care focus of each practice location included patient engagement activities (twenty items), organizational processes for patient responsiveness (five items), and patient-reported outcomes (ten items). All scales were transformed to be bounded by 0 and 1 for ease of comparison. Appendix exhibit A2 details the specific physician practice capabilities assessed.11 The cluster solution that best fit the data and satisfied the selection criteria was a three-cluster solution that included all ten composite measures, classified as physician practices locations with robust (n = 585), mixed (n = 485), or limited (n = 702) capabilities. Appendix exhibit A3 includes details about the Delphi expert panel process.11
Outcome Measures
Seven outcome measures that could be derived from Medicare claims data were examined. The three process measures of quality include patient-level dichotomous measures of mammography for women ages 65–74, low-density lipoprotein cholesterol screening for beneficiaries with diabetes, and HbA1c measurement for beneficiaries with diabetes.16 The three dichotomous utilization measures are thirty-day all-cause hospital readmission,17 hospitalization for ambulatory care–sensitive conditions,18 and unnecessary emergency department visit, as defined by the New York University Emergency Department Algorithm.19 Utilization measure definitions are detailed in appendix exhibit A3.11
The spending outcome measure is total spending.20 Spending accounts for geographic differences in Medicare prices and includes both hospital inpatient utilization (using diagnosis-related group-based standardized payment rates) and outpatient services (using relative value units). Spending from attributed patients accrues from both practice providers and nonpractice providers. To elucidate sources of potential spending differences, we also examine components of total spending as outcome variables, including total allowed payments and relevant component payments for outpatient spending, durable medical equipment, imaging, evaluation and management, procedures, testing, facilities, acute care and critical access hospitals, complex postacute care skilled nursing facilities, skilled nursing and rehabilitation, home health, complex postacute care home health, hospice, and other spending. For the mixed effects regression analyses, these continuous spending outcomes were log-transformed.
Control Variables
Our regression analyses control for practice-level and patient-level covariates potentially associated with practice capabilities and performance. Practice size has been associated with greater provision of preventive care,21–23 quality improvement, and patient-centered medical home processes.24,25 Patients of smaller-sized practices also have lower hospitalization rates for ambulatory care–sensitive conditions,18 so practice size was included as a covariate. We also control for specialty mix of practices, as measured by practices’ specialist-to-primary care physician ratios. Physician practice locations without specialists were categorized into one group and practice locations with specialists were categorized on the basis of terciles of the distribution of the ratio, resulting in four categories: no specialists (0 percent specialists; n = 308), low specialists (<61 percent specialists; n = 513), moderate specialists (61–68 percent specialists; n = 485), and high specialists (>68 percent specialists; n = 466).
Practice ownership (group or system owned versus independent) was controlled for in regression analyses because previous research highlights important differences in the capabilities of independent and system- or group-owned practices.10 There was strong consensus among expert panel participants to control for practice ownership as a dichotomous variable (independent physician practice versus medical group–owned or health system–owned practice) rather than a categorical variable, given the heterogeneous and dynamic organizational arrangements between medical groups and health systems. We controlled for the number of advanced practice clinicians for each practice location because these clinicians are associated with having robust practice capabilities and can affect spending. We also controlled for the ratio of employed primary care physicians to total primary care physicians as a measure of managerial influence on the development of physician practice capabilities.
Patient-level control variables included patient age, race and ethnicity, sex, Hierarchical Condition Categories risk adjustment factor score (derived using 2017 claims data to account for patient morbidity), individual dummy variables for diagnoses of mental illness, frailty,6,26 and dual eligibility for Medicare and Medicaid insurance coverage. We also controlled for patient residence in a high-poverty ZIP code and the median household income of beneficiary’s ZIP code. The spending models also control for deceased beneficiaries during 2017 with a binary indicator.
Statistical Analyses
Patient characteristics were compared by the three-level categorical physician practice capability measure (robust versus mixed versus limited). We then compared the ten composite physician practice capabilities across the three levels and compared the unadjusted study outcome values across the three practice capability groups. T-tests with robust standard errors were used for continuous variables and chi-square tests with robust standard errors were used for categorical variables for these unadjusted analyses.
To examine the association of physician practice capabilities with process measures of quality, utilization, and spending for Medicare fee-for-service beneficiaries, we estimated separate multilevel regression models for each of the seven outcome measures, controlling for patient and practice covariates. Mixed-effects logistic regression models were estimated for the three quality and three utilization measures, using the MELOGIT procedure in Stata. These mixed-effects logistic regression models use physician practice random effects and assume that the residuals follow a Bernoulli distribution. Mixed-effects linear regression models for total spending and components of spending were estimated using the XTMIXED procedure, using log-transformed spending and physician random effects, and assume that the residuals follow a Gaussian distribution. For all models, the omitted reference group for the three-level practice capability variable was robust physician practice locations. Inverse propensity of treatment weights were used to account for potential selection effects.27,28 Additional information about the regression models is detailed in appendix exhibit A4.11
To calculate annual (2017) Medicare fee-for-service savings associated with robust practice capabilities, predicted probabilities of the final spending regression models were estimated. The coefficients for mixed and limited practices were converted from log-transformed values to dollar values. Mean annual total spending differences between robust and practices with mixed and limited capabilities were separately calculated. These dollar amounts were multiplied by the total number of Medicare fee-for-service beneficiaries in 2017 (thirty-eight million) and then separately multiplied by the percentage of patients attributed to practice locations with limited capabilities and the percentage of patients attributed to practices with mixed capabilities. The resulting total dollar values for mixed and limited practice locations were summed to generate a total annual cost savings estimate.
Limitations
The study has some limitations that should be considered. First, the quality-of-care measures were limited to Medicare fee-for-service claims-based measures of quality, utilization, and spending that could be reliably assessed using a single year. Our results may not generalize to populations not covered by Medicare or quality-of-care measures not examined in the study. Practice capabilities may be more strongly associated with intermediate outcomes of care—for example, HbA1c and blood pressure control, which require laboratory or EHR data. These measures, along with patient-reported measures29 from multiple payers, should be analyzed in future research when appropriate national data are available. Second, the claims data include facility fees for hospital-based outpatient care, but our analyses do not consider differences in reimbursement levels for these visits, which could alter the findings. Third, the National Survey of Healthcare Organizations and Systems excludes practice locations with fewer than three primary care physicians, so the results may not generalize well to small practice locations. For example, our saving estimates are based on an assumption that small practices caring for Medicare fee-for-service beneficiaries had a similar distribution of capabilities as the analytic sample, when past research indicates that they have more limited capabilities compared with larger practice locations.30 As a result, the savings estimates are conservative. Fourth, because of collinearity concerns with modest practice and beneficiary sample sizes for some study outcomes, we did not include geographic measures of access to care in regression models. Finally, although we used propensity score methods to account for potential selection effects, these methods cannot account for unmeasured factors that might affect the study results.28
Study Results
Exhibit 1 compares the characteristics of beneficiaries attributed to robust versus mixed versus limited practice locations. These unadjusted analyses highlight that physician practice locations with robust organizational capabilities care for more clinically complex patients—for example, frail elders, those with higher CMS Hierarchical Condition Category risk adjustment factor scores, and those with diagnosed mental illness (p < 0.001 for all comparisons: mixed-robust, limited-robust, and mixed-limited). Practice locations with robust and mixed capabilities, however, care for smaller shares of dually eligible Medicare and Medicaid beneficiaries (p < 0.001 for comparisons of both with limited). Appendix exhibit A5 includes the full details of exhibit 1.11
Exhibit 1:
Medicare patient characteristics: robust versus mixed versus limited capability physician practice locations
| Patient characteristics | All beneficiaries (n = 1,511,938) | Patients of robust practices (n = 481,454) | Patients of mixed practices (n = 423,484) | Patients of limited practices (n = 607,000) |
|---|---|---|---|---|
| Age (mean) | 75.0 | 75.0 | 75.0 | 74.9 |
| Race/ethnicity | ||||
| White (%) | 87.8 | 86.1 | 87.8 | 89.2 |
| Black (%) | 5.8 | 6.1 | 5.8 | 5.6 |
| Asian (%) | 1.8 | 2.2 | 2.1 | 1.1 |
| Hispanic (%) | 0.9 | 1.1 | 0.8 | 0.8 |
| Other (%) | 3.7 | 4.5 | 3.4 | 3.3 |
| Female (%) | 58.3 | 58 | 58.4 | 58.6 |
| CMS-HCC RAF score (mean) | 1.01 | 1.032 | 1.008 | 0.994 |
| Any mental illness (%) | 18.2 | 18.5 | 18.3 | 17.8 |
| Frail elder (%) | 4.5 | 4.7 | 4.5 | 4.3 |
| Dually eligible for Medicare and Medicaid (%) | 2.8 | 2.6 | 2.6 | 3.1 |
| High-poverty ZIP code (%) | 15.4 | 16.2 | 14.7 | 15.3 |
| Median household income of ZIP code ($) | 61,711 | 63,390 | 61,214 | 60,727 |
| Deceased during 2017 (%) | 3.2 | 3.3 | 3.2 | 3.1 |
SOURCE Authors’ analysis of claims data of 2017 Medicare fee-for-service beneficiaries. NOTES We conducted t-tests to compare means of the following combinations of practice capabilities: mixed versus robust, limited versus robust, and mixed versus limited. p < 0.001 for all comparisons between robust and limited practices; p < 0.05 for all other comparisons except the difference in age between mixed and robust practices, difference in Hispanic between mixed and limited practices, difference in percent female between mixed and limited practices, and difference in percent dually eligible for Medicare and Medicaid between mixed and robust practices. A full version of this exhibit with t-test results is available in online appendix A5 (see note 11 in text). CMS-HCC RAF Score is Centers for Medicare and Medicaid Services Hierarchical Condition Category risk adjustment factor score.
Mean values for each of the ten National Survey of Healthcare Organizations and Systems composite measures of practice capabilities and practice-level control variables assessed in the research study are detailed in exhibit 2. All practice survey composites and practice characteristics are fully differentiated across practices with robust versus mixed versus limited capability categories (p < 0.001 for all comparisons: mixed-robust, limited-robust, and mixed-limited). Appendix exhibit A6 includes the full details in exhibit 2.11 Appendix exhibit A7 summarizes the unadjusted mean comparisons for each of the seven study outcomes for practice locations with robust versus mixed versus limited capabilities.11
Exhibit 2:
Physician practice location capabilities: robust versus mixed versus limited capability practices
| All practices (n = 1,772) | Robust practices (n = 585) | Mixed practices (n = 485) | Limited practices (n = 702) | |
|---|---|---|---|---|
| Practice capabilities (mean) | ||||
| Care of complex patients | 0.39 | 0.55 | 0.35 | 0.28 |
| Use of evidence-based guidelines | 0.56 | 0.89 | 0.60 | 0.28 |
| Use of EHR-based decision support | 0.53 | 0.84 | 0.78 | 0.11 |
| Use of registry functions | 0.47 | 0.88 | 0.36 | 0.22 |
| Patient responsiveness | 0.79 | 0.87 | 0.79 | 0.74 |
| Patient engagement activities | 0.35 | 0.48 | 0.33 | 0.26 |
| Patient-reported outcomes | 0.52 | 0.81 | 0.47 | 0.34 |
| Depression care management | 0.30 | 0.47 | 0.24 | 0.19 |
| Learning orientation or team culture | 0.57 | 0.67 | 0.56 | 0.50 |
| Capacity for innovation | 0.34 | 0.48 | 0.31 | 0.25 |
| Practice characteristics (%) | ||||
| Specialty mix | ||||
| None | 0.16 | 0.13 | 0.17 | 0.18 |
| Low | 0.25 | 0.23 | 0.26 | 0.27 |
| Moderate | 0.29 | 0.27 | 0.3 | 0.29 |
| High | 0.3 | 0.36 | 0.27 | 0.27 |
| Total physicians (mean) | 117.65 | 303.36 | 24.05 | 35.89 |
| Employed PCP (%) | 0.96 | 0.96 | 0.97 | 0.96 |
| Specialist-to-PCP ratio | 0.17 | 0.18 | 0.16 | 0.16 |
| Total advanced practice providers (NP/PA/CNS) (mean) | 6.02 | 10.95 | 3.08 | 4.18 |
| System or group-owned | 0.77 | 0.77 | 0.77 | 0.76 |
SOURCE Authors’ analysis of the 2017–18 National Survey of Healthcare Organizations and Systems and the 2016 IQVIA OneKey Database. NOTES We conducted t-tests to compare means: mixed-robust, limited-robust, and mixed-limited. p < 0.001 for all comparisons. A full version of this exhibit with t-test results is available in online appendix A6 (see note 11 in text). EHR is electronic health record. PCP is primary care physician. NP is nurse practitioner. PA is physician assistant. CNS is clinical nurse specialist.
Exhibit 3 summarizes the results of propensity score–weighted mixed-effects regression models, presented as marginal effects when comparing study outcomes for patients attributed to practice locations with mixed or limited capabilities compared with practice locations with robust capabilities. There were no statistically significant differences in quality or utilization by physician practice-level capabilities. Several patient characteristics were associated with the study outcomes. For example, practice locations with higher mean CMS Hierarchical Condition Category risk adjustment factor score scores had lower quality of care, higher utilization, and higher total spending compared with practices with lower mean risk adjustment factor scores (p < 0.001 for all comparisons). Appendix exhibit A8 compares adjusted process measures of quality and utilization for physician practice locations with robust versus mixed versus limited capabilities.11
Exhibit 3:
Association of physician practice location capabilities and Medicare patient characteristics with process measures of quality, utilization, and total spending
| Practice and patient characteristics | Quality measures | Utilization measures | Total spending | ||||
|---|---|---|---|---|---|---|---|
| Mammography screening | Hemoglobin A1c test | Blood lipid test | All-cause 30-day readmission | Hospitalization for ACSC | Unnecessary ED visit | ||
| Practice (n) | 1,759 | 1,740 | 1,740 | 1,721 | 1,772 | 1,772 | 1,772 |
| Patient (n) | 471,435 | 204,805 | 204,797 | 150,637 | 1,511,866 | 1,511,866 | 1,504,610 |
| Practice characteristics | |||||||
| Practice capabilities | |||||||
| Robust (reference) | —a | —a | —a | —a | —a | —a | —a |
| Mixed | −0.0063 | 0.0267 | 0.0201 | −0.011 | 0.0345 | 0.01 | 0.0522**** |
| Limited | −0.0325 | −0.0718 | −0.0489 | 0.009 | 0.0081 | 0.0081 | 0.0429*** |
| Specialty mix | |||||||
| No specialists (reference) | —a | —a | —a | —a | —a | —a | —a |
| Low | −0.191**** | −0.158** | −0.172** | 0.0234 | 0.0813** | 0.119**** | −0.04 |
| Moderate | −0.0914 | −0.251*** | −0.421**** | 0.0004 | 0.0946** | 0.143**** | −0.0943**** |
| High | −0.0259 | −0.209** | −0.341 | −0.0171 | 0.0766 | 0.154**** | 0.0243 |
| Employed primary care physician (%) | 0.158** | 0.143 | −0.102 | −0.0824 | −0.113 | 0.0356 | −0.0657* |
| Total physicians (standardized) | 0.168**** | 0.0457 | 0.061 | −0.0533* | −0.1** | −0.106*** | −0.006 |
| Total advanced practice providers (NP/PA/CNS) (standardized) | −0.13*** | −0.154** | −0.205*** | 0.0684*** | 0.0498 | 0.108*** | −0.0044 |
| System or group-owned (versus independent) | 0.0655* | 0.0255 | 0.018 | 0.0182* | −0.0261 | −0.0001 | −0.0512*** |
| Patient characteristics | |||||||
| Age (standardized) | −0.0715**** | 0.0599** | 0.0477*** | 0.0073* | 0.368**** | 0.223**** | 0.016**** |
| Female | —b | 0.194**** | 0.0686**** | 0.0542**** | 0.0968**** | 0.173**** | 0.0687**** |
| Race and ethnicity | |||||||
| White (reference) | —a | —a | —a | —a | —a | —a | —a |
| Black | 0.144**** | −0.113**** | −0.199**** | −0.0499* | 0.172**** | 0.465**** | −0.174**** |
| Asian | −0.284**** | 0.0634 | 0.0333 | −0.168** | −0.176*** | −0.0457 | −0.313**** |
| Hispanic | −0.137*** | −0.066 | −0.164*** | −0.00737 | −0.0503 | 0.382**** | −0.260**** |
| Other | −0.00416 | 0.0292 | 0.0224 | −0.0759 | −0.08*** | −0.121**** | −0.131**** |
| CMS-HCC RAF score | −0.274**** | −0.164**** | −0.185**** | 0.374**** | 0.812**** | 0.28**** | 0.796**** |
| Mental illness diagnosis | −0.0297** | −0.0814**** | −0.0716**** | 0.261**** | 0.643**** | 0.486**** | 0.495**** |
| Frail elder | −0.0092 | −0.0206 | −0.927*** | 0.266**** | 0.277**** | 0.191**** | 0.621**** |
| Dually eligible for Medicare and Medicaid (%) | −0.478**** | 0.0382 | −0.0662** | 0.0569 | 0.266**** | 0.281**** | −0.18**** |
| High poverty ZIP code | −0.0495**** | −0.0416 | −0.0308 | −0.0487 | −0.0026 | 0.0078 | −0.0195**** |
| Median household income of ZIP code (standardized) | 0.0688**** | 0.0231 | 0.0329*** | −0.0625**** | −0.0858**** | −0.0547**** | 0.0153**** |
| Deceased | −0.815**** | −1.576**** | −1.485**** | 0.623**** | −0.193**** | −0.0878**** | 0.624**** |
SOURCE Authors’ analysis of claims data of 2017 Medicare fee-for-service beneficiaries, 2017/18 National Survey of Healthcare Organizations and Systems, and the 2016 IQVIA OneKey Database. NOTES Reference categories are left blank since these are the categories against which the other variables shown are being compared. ACSC is ambulatory care–sensitive condition. ED is emergency department. NP is nurse practitioner. PA is physician assistant. CNS is clinical nurse specialist. CMS-HCC RAF score is Centers for Medicare and Medicaid Services Hierarchical Condition Category risk adjustment factor score.
aReference.
bNot applicable.
*p < 0.1,
**p < 0.05,
***p < 0.01,
****p < 0.001
Compared with beneficiaries attributed to robust physician practice locations, beneficiaries attributed to limited or mixed capability practice locations had higher total spending (p < 0.001). Exhibit 4 displays adjusted total spending comparisons by physician practice capability levels for the main model.
Exhibit 4.
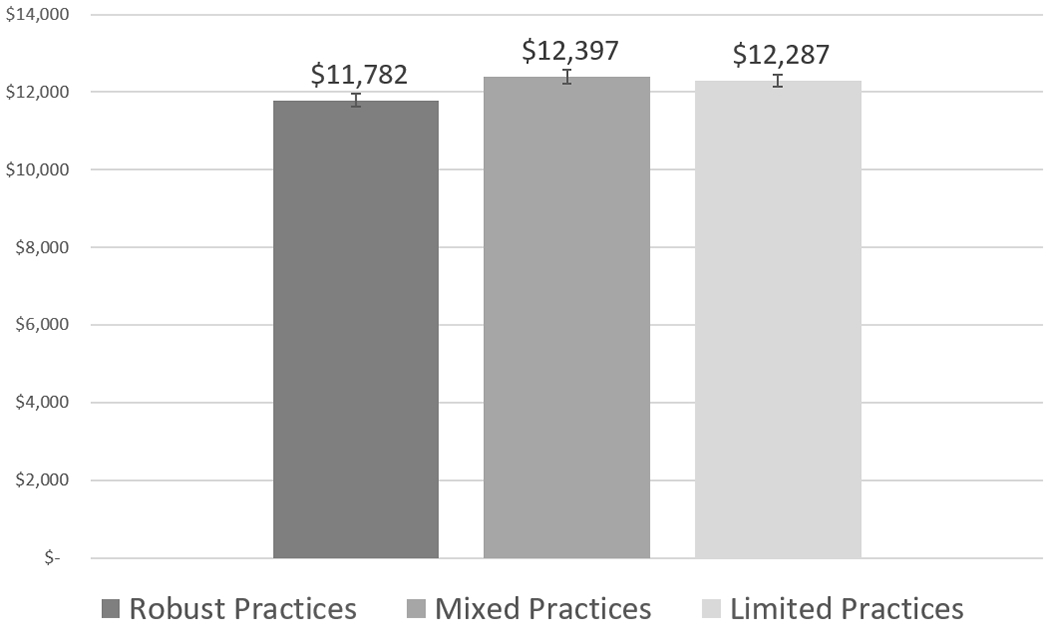
Adjusted total spending by physician practice location capability levels
Source/Notes: SOURCE Authors’ analysis of claims data of 2017 Medicare fee-for-service beneficiaries, 2017–18 National Survey of Healthcare Organizations and Systems, and the 2016 IQVIA OneKey Database. NOTE Physician practice locations with mixed or limited capabilities had significantly higher spending compared with physician practice locations with robust capabilities (p < 0.001).
When examining subcomponents of spending (appendix exhibit A9), beneficiaries attributed to mixed capability practice locations had higher spending for evaluation and management (p < 0.05) and outpatient spending (p < 0.001) compared with beneficiaries attributed to robust practice locations, but other subcomponents did not significantly differ.11 Beneficiaries attributed to limited capability practice locations also had higher spending for procedures (p < 0.05) and outpatient spending (p < 0.001), but most other subcomponents did not significantly differ. Importantly, hospice spending was lower for beneficiaries attributed to limited practice locations compared with robust practices (p < 0.01). This is noteworthy because it diverges from the overall higher spending pattern and is indicative of less use of hospice services for end-of-life care among beneficiaries attributed to practices with limited capabilities.
Based on the dollar denominated savings estimates for the total spending model, which is $615 per beneficiary savings for robust compared with mixed and $505 per beneficiary savings for robust compared with limited capabilities, if all thirty-eight million Medicare fee-for-service beneficiaries in 2017 were attributed to robust practices, approximately $14.9 billion dollars could potentially be saved annually. Spending estimates were most sensitive to the inclusion and exclusion of decedents in the analytic sample and including versus excluding a binary indicator to control for decedents in the final regression models (data not shown).
The results also revealed important relationships between study covariates and total spending. Compared with beneficiaries attributed to independent practices, beneficiaries attributed to practices owned by health care systems or medical groups had lower total spending (p < 0.01). Beneficiaries attributed to practice locations with moderate specialist-to-primary care physician ratios had lower total spending compared with practice locations without specialists, but this did not hold true for practice locations with low or high specialist-to-primary care physician ratios.
Discussion
Our national study found that physician practice locations with robust capabilities deliver comparable quality of care with lower total spending for Medicare fee-for-service beneficiaries. The savings are concentrated in outpatient spending, which has important policy implications because value-based payment reforms have largely focused on preventing emergency department and hospitalization utilization as a primary way to reduce total spending. Although health care systems and physician organizations have many incentives to promote better care management among complex patients, expand health information technology, and deliver patient-centered care, these capabilities can be costly and difficult to implement. Without a clear return on investment for developing these capabilities, they may not be pursued by health care organizations or may not be sustained over time.31 Our results contribute to evidence that investing in physician practice capabilities to effectively manage complex patients may help control total spending.5,32,33
We found that physician practice locations with robust capabilities have higher shares of clinically complex Medicare fee-for-service beneficiaries and are more likely to be located in urban and impoverished areas. These practice locations, however, serve relatively low shares of beneficiaries who are dually eligible for Medicare and Medicaid. These complex beneficiaries are more likely than non–dually eligible beneficiaries to need chronic care management and behavioral health support,34,35 but are more likely to receive primary care services from specialist practices that may lack capabilities for ongoing care management.36,37 Dually eligible beneficiaries could benefit from access to the care management and patient-centered care capabilities in robust practice locations.
Practice locations with robust capabilities, however, did not have significantly better performance on any of the six quality and utilization measures assessed. High performance levels for the three claims-based quality measures and their lack of association with the capabilities assessed raise the question of whether these claims-based measures are relevant for differentiating quality of care among practice locations. The utilization findings suggest that developing robust practice-level capabilities may not be sufficient to reduce potentially preventable emergency department and hospital utilization.
We found that physician practice locations owned by hospitals, health systems, or medical groups, independent of practice-level capabilities, had lower spending. Given the increased complexity of delivering health care, policy makers have largely assumed that integrated delivery systems are needed to effectively coordinate the range of services for patients with multiple chronic illnesses38 to achieve better quality and cost performance.39 Our findings reinforce the potential benefits of health care system or physician group ownership, as the system-group ownership effect size for total spending is similar in magnitude to the “robust” capability effect size. The additive effect of system-group ownership and practice-level capabilities on total spending underscores that system-level support may contribute to managing spending. These findings diverge from recent evidence about the effect of vertical integration on spending,40 which does not consider physician practice capabilities when assessing ownership and performance relationships.
Although the spending differences between physician practice locations with robust versus mixed versus limited capabilities were modest in magnitude, if all physician practice locations performed at the level of robust practices, an estimated $14.9 billion in annual savings could potentially be generated among fee-for-service beneficiaries. The savings estimate is greater than the estimated savings generated by the CMS Medicare Shared Savings Program, which was $4.1 billion in 2020 and $1.9 billion after accounting for shared savings payments.41 The potential savings estimates from robust practices is comparable to the $15 billion in annual savings estimated by Weeks and colleagues in 2010. 5 Although the small effect size is statistically significant, the savings may not be practically meaningful for any given health care organization. Our savings estimates from a nationally representative sample of physician practice locations with three or more primary care physicians, however, are likely more generalizable to other physician practices nationally compared with the “early adopter” physician practices studied by Weeks and colleagues, 5 using 2007 claims data.
Conclusion
Our national study found that physician practice locations with robust capabilities, including robust technology and innovation capacity, strong management and team cultures, and patient-centered orientations, have lower spending for Medicare fee-for-service beneficiaries compared with practice locations with more limited capabilities. The estimated cost savings attributable to physician practice locations with robust capabilities is modest and suggests that reforms beyond those targeting practice capabilities, including multipayer alignment and payment reform, may be needed to support larger performance advantages for practices with robust capabilities.42 Additional evidence is needed to understand whether intermediate outcomes of care and patient-reported outcome measures are better for practices with robust capabilities compared with practices with more limited capabilities. Policy changes that affect states and organizations differentially, such as responses to COVID-19,43 can potentially serve as natural experiments to clarify how robust practice-level capabilities affect quality of care and spending.
Supplementary Material
Acknowledgment
This study was supported by the Agency for Healthcare Research and Quality’s Comparative Health System Performance Initiative under Grant No. 1U 19HS024075, which studies how health care delivery systems promote evidence-based practices and patient-centered outcomes research in delivering care. The research was also partially supported by a research gift from AMGA to the Center for Healthcare Organizational and Innovation Research. The contents of the manuscript are solely the responsibility of the authors and do not necessarily represent the views of AMGA. The statements, findings, conclusions, views, and opinions contained and expressed in this article are based in part on data obtained under license from IQVIA information services (OneKey subscription information services 2010–18, IQVIA Inc., all rights reserved). The statements, findings, conclusions, views, and opinions contained and expressed herein are not necessarily those of IQVIA Inc. or any of its affiliated or subsidiary entities. The American Medical Association (AMA) was the source for the raw physician data; statistics, tables, and tabulations were prepared by the authors using data from the AMA Physician Masterfile. The authors appreciate the critical feedback from expert panelists. The authors also thank Timothy T. Brown for his helpful consultation for econometric analyses.
Biographies
BIOS for 2021-00302 (Rodriguez)
Hector P. Rodriguez (hrod@berkeley.edu), School of Public Health, University of California, Berkeley.
Elizabeth L. Ciemins, AMGA, Washington, D.C.
Karl Rubio, School of Public Health, University of California, Berkeley.
Stephen M. Shortell, School of Public Health, University of California, Berkeley.
Contributor Information
Hector P. Rodriguez, School of Public Health, University of California Berkeley.
Elizabeth L. Ciemins, AMGA, Washington, D.C..
Karl Rubio, School of Public Health, University of California Berkeley.
Stephen M. Shortell, School of Public Health University of California Berkeley.
Notes
- 1.Shrank WH, Rogstad TL, Parekh N. Waste in the US health care system: estimated costs and potential for savings. JAMA. 2019;322(15):1501–9. [DOI] [PubMed] [Google Scholar]
- 2.Liao JM, Navathe AS, Werner RM. The impact of Medicare’s alternative payment models on the value of care. Annu Rev Public Health. 2020;41:551–65. [DOI] [PubMed] [Google Scholar]
- 3.Peikes D, Dale S, Ghosh A, Taylor EF, Swankoski K, O’Malley AS, et al. The Comprehensive Primary Care Initiative: effects on spending, quality, patients, and physicians. Health Aff (Millwood). 2018;37(6):890–9. [DOI] [PubMed] [Google Scholar]
- 4.Martsolf GR, Kandrack R, Friedberg MW, Briscombe B, Hussey PS, LaBonte C. estimating the costs of implementing comprehensive primary care: a narrative review. Health Serv Res Manag Epidemiol. 2019;6:2333392819842484. [DOI] [PMC free article] [PubMed] [Google Scholar]
- 5.Weeks WB, Gottlieb DJ, Nyweide DE, Sutherland JM, Bynum J, Casalino LP, et al. Higher health care quality and bigger savings found at large multispecialty medical groups. Health Aff (Millwood). 2010;29(5):991–7. [DOI] [PubMed] [Google Scholar]
- 6.Colla C, Yang W, Mainor AJ, Meara E, Ouayogode MH, Lewis VA, et al. Organizational integration, practice capabilities, and outcomes in clinically complex medicare beneficiaries. Health Serv Res. 2020;55(Suppl 3):1085–97. [DOI] [PMC free article] [PubMed] [Google Scholar]
- 7.Correa VC, Lugo-Agudelo LH, Aguirre-Acevedo DC, Contreras JAP, Borrero AMP, Patiño-Lugo DF, et al. Individual, health system, and contextual barriers and facilitators for the implementation of clinical practice guidelines: a systematic metareview. Health Res Policy Syst. 2020;18(1):74. [DOI] [PMC free article] [PubMed] [Google Scholar]
- 8.Cook DA, Teixeira MT, Heale BS, Cimino JJ, Del Fiol G. Context-sensitive decision support (infobuttons) in electronic health records: a systematic review. J Am Med Inform Assoc. 2017;24(2):460–8. [DOI] [PMC free article] [PubMed] [Google Scholar]
- 9.Baker JM, Grant RW, Gopalan A. A systematic review of care management interventions targeting multimorbidity and high care utilization. BMC Health Serv Res. 2018;18(1):65. [DOI] [PMC free article] [PubMed] [Google Scholar]
- 10.Brewster AL, Fraze TK, Gottlieb LM, Frehn J, Murray GF, Lewis VA. The role of value-based payment in promoting innovation to address social risks: a cross-sectional study of social risk screening by US physicians. Milbank Q. 2020;98(4):1114–33. [DOI] [PMC free article] [PubMed] [Google Scholar]
- 11.To access the appendix, click on the Details tab of the article online.
- 12.Centers for Medicare and Medicaid Services. Medicare Shared Savings Program: shared savings and losses and assignment methodology [Internet]. Baltimore (MD): CMS; 2017. Apr [cited 2022 Jan 10]. Available from: https://www.cms.gov/Medicare/Medicare-Fee-for-Service-Payment/sharedsavingsprogram/Downloads/Shared-Savings-Losses-Assignment-Spec-V5.pdf [Google Scholar]
- 13.Fisher ES, Shortell SM, O’Malley AJ, Fraze TK, Wood A, Palm M, et al. Financial integration’s impact on care delivery and payment reforms: a survey of hospitals and physician practices. Health Aff (Millwood). 2020;39(8):1302–11. [DOI] [PMC free article] [PubMed] [Google Scholar]
- 14.Kennedy HP. Enhancing Delphi research: methods and results. J Adv Nurs. 2004;45(5):504–11. [DOI] [PubMed] [Google Scholar]
- 15.Ashcroft R, Menear M, Greenblatt A, Silveira J, Dahrouge S, Sunderji N, et al. Patient perspectives on quality of care for depression and anxiety in primary health care teams: a qualitative study. Health Expect. 2021;24(4):1168–77. [DOI] [PMC free article] [PubMed] [Google Scholar]
- 16.Gray B, Vandergrift J, Landon B, Reschovsky J, Lipner R. Associations between American Board of Internal Medicine maintenance of certification status and performance on a set of Healthcare Effectiveness Data and Information Set (HEDIS) process measures. Ann Intern Med. 2018;169(2):97–105. [DOI] [PubMed] [Google Scholar]
- 17.Henke RM, Karaca Z, Jackson P, Marder WD, Wong HS. Discharge planning and hospital readmissions. Med Care Res Rev. 2017;74(3):345–68. [DOI] [PubMed] [Google Scholar]
- 18.Casalino LP, Pesko MF, Ryan AM, Mendelsohn JL, Copeland KR, Ramsay PP, et al. Small primary care physician practices have low rates of preventable hospital admissions. Health Aff (Millwood). 2014;33(9):1680–8. [DOI] [PubMed] [Google Scholar]
- 19.Gandhi SO, Sabik L. Emergency department visit classification using the NYU algorithm. Am J Manag Care. 2014;20(4):315–20. [PubMed] [Google Scholar]
- 20.Colla CH, Lewis VA, Kao L-S, O’Malley AJ, Chang C-H, Fisher ES. Association between Medicare accountable care organization implementation and spending among clinically vulnerable beneficiaries. JAMA Intern Med. 2016;176(8):1167–75. [DOI] [PMC free article] [PubMed] [Google Scholar]
- 21.McMenamin SB, Schmittdiel J, Halpin HA, Gillies R, Rundall TG, Shortell SM. Health promotion in physician organizations: results from a national study. Am J Prev Med. 2004;26(4):259–64. [DOI] [PubMed] [Google Scholar]
- 22.Mehrotra A, Epstein AM, Rosenthal MB. Do integrated medical groups provide higher-quality medical care than individual practice associations? Ann Intern Med. 2006;145(11):826–33. [DOI] [PubMed] [Google Scholar]
- 23.McMenamin SB, Bellows NM, Halpin HA, Rittenhouse DR, Casalino LP, Shortell SM. Adoption of policies to treat tobacco dependence in U.S. medical groups. Am J Prev Med. 2010;39(5):449–56. [DOI] [PubMed] [Google Scholar]
- 24.Shortell SM, Gillies R, Siddique J, Casalino LP, Rittenhouse D, Robinson JC, et al. Improving chronic illness care: a longitudinal cohort analysis of large physician organizations. Med Care. 2009;47(9):932–9. [DOI] [PubMed] [Google Scholar]
- 25.Casalino L, Gillies RR, Shortell SM, Schmittdiel JA, Bodenheimer T, Robinson JC, et al. External incentives, information technology, and organized processes to improve health care quality for patients with chronic diseases. JAMA. 2003;289(4):434–41. [DOI] [PubMed] [Google Scholar]
- 26.Joynt KE, Figueroa JF, Beaulieu N, Wild RC, Orav EJ, Jha AK. Segmenting high-cost Medicare patients into potentially actionable cohorts. Healthc (Amst). 2017;5(1-2):62–7. [DOI] [PubMed] [Google Scholar]
- 27.Austin PC. The relative ability of different propensity score methods to balance measured covariates between treated and untreated subjects in observational studies. Med Decis Making. 2009;29(6):661–77. [DOI] [PubMed] [Google Scholar]
- 28.Stuart EA. Matching methods for causal inference: a review and a look forward. Stat Sci. 2010;25(1):1–21. [DOI] [PMC free article] [PubMed] [Google Scholar]
- 29.Cook KF, Jensen SE, Schalet BD, Beaumont JL, Amtmann D, Czajkowski S, et al. PROMIS measures of pain, fatigue, negative affect, physical function, and social function demonstrated clinical validity across a range of chronic conditions. J Clin Epidemiol. 2016;73:89–102. [DOI] [PMC free article] [PubMed] [Google Scholar]
- 30.Wiley JA, Rittenhouse DR, Shortell SM, Casalino LP, Ramsay PP, Bibi S, et al. Managing chronic illness: physician practices increased the use of care management and medical home processes. Health Aff (Millwood). 2015;34(1):78–86. [DOI] [PubMed] [Google Scholar]
- 31.Rodriguez HP, Henke RM, Bibi S, Ramsay PP, Shortell SM. The exnovation of chronic care management processes by physician organizations. Milbank Q. 2016;94(3):626–53. [DOI] [PMC free article] [PubMed] [Google Scholar]
- 32.Cross DA, Nong P, Harris-Lemak C, Cohen GR, Linden A, Adler-Milstein J. Practice strategies to improve primary care for chronic disease patients under a pay-for-value program. Healthc (Amst). 2019;7(1):30–7. [DOI] [PubMed] [Google Scholar]
- 33.Reed ME, Huang J, Brand RJ, Neugebauer R, Graetz I, Hsu J, et al. Patients with complex chronic conditions: health care use and clinical events associated with access to a patient portal. PLoS One. 2019;14(6):e0217636. [DOI] [PMC free article] [PubMed] [Google Scholar]
- 34.Jung H-Y, Trivedi AN, Grabowski DC, Mor V. Integrated Medicare and Medicaid managed care and rehospitalization of dual eligibles. Am J Manag Care. 2015;21(10):711–7. [PMC free article] [PubMed] [Google Scholar]
- 35.Keohane LM, Trivedi AN, Mor V. Recent health care use and Medicaid entry of Medicare beneficiaries. Gerontologist. 2017;57(5):977–86. [DOI] [PMC free article] [PubMed] [Google Scholar]
- 36.Yee HF Jr. The patient-centered medical home neighbor: A subspecialty physician’s view. Ann Intern Med. 2011;154(1):63–4. [DOI] [PubMed] [Google Scholar]
- 37.Kirschner N, Barr MS. Specialists/subspecialists and the patient-centered medical home. Chest. 2010;137(1):200–4. [DOI] [PubMed] [Google Scholar]
- 38.Christianson JB, Carlin CS, Warrick LH. The dynamics of community health care consolidation: acquisition of physician practices. Milbank Q. 2014;92(3):542–67. [DOI] [PMC free article] [PubMed] [Google Scholar]
- 39.Landon BE, Keating NL, Onnela J-P, Zaslavsky AM, Christakis NA, O’Malley AJ. Patient-sharing networks of physicians and health care utilization and spending among Medicare beneficiaries. JAMA Intern Med. 2018;178(1):66–73. [DOI] [PMC free article] [PubMed] [Google Scholar]
- 40.Whaley CM, Zhao X, Richards M, Damberg CL. Higher Medicare spending on imaging and lab services after primary care physician group vertical integration. Health Aff (Millwood). 2021;40(5):702–9. [DOI] [PMC free article] [PubMed] [Google Scholar]
- 41.Staff MHE. Medicare ACOs Saved $4.1B in 2020. Managed Healthcare Executive [serial on the Internet]. 2021. Aug 25 [cited 2022 Jan 10]. Available from: https://www.managedhealthcareexecutive.com/view/medicare-acos-saved-4-1b-2020
- 42.Blumenthal D, Chernof B, Fulmer T, Lumpkin J, Selberg J. Caring for high-need, high-cost patients—an urgent priority. N Engl J Med. 2016;375(10):909–11. [DOI] [PubMed] [Google Scholar]
- 43.Islam N, Sharp SJ, Chowell G, Shabnam S, Kawachi I, Lacey B, et al. Physical distancing interventions and incidence of coronavirus disease 2019: natural experiment in 149 countries. BMJ. 2020;370:m2743. [DOI] [PMC free article] [PubMed] [Google Scholar]
Associated Data
This section collects any data citations, data availability statements, or supplementary materials included in this article.