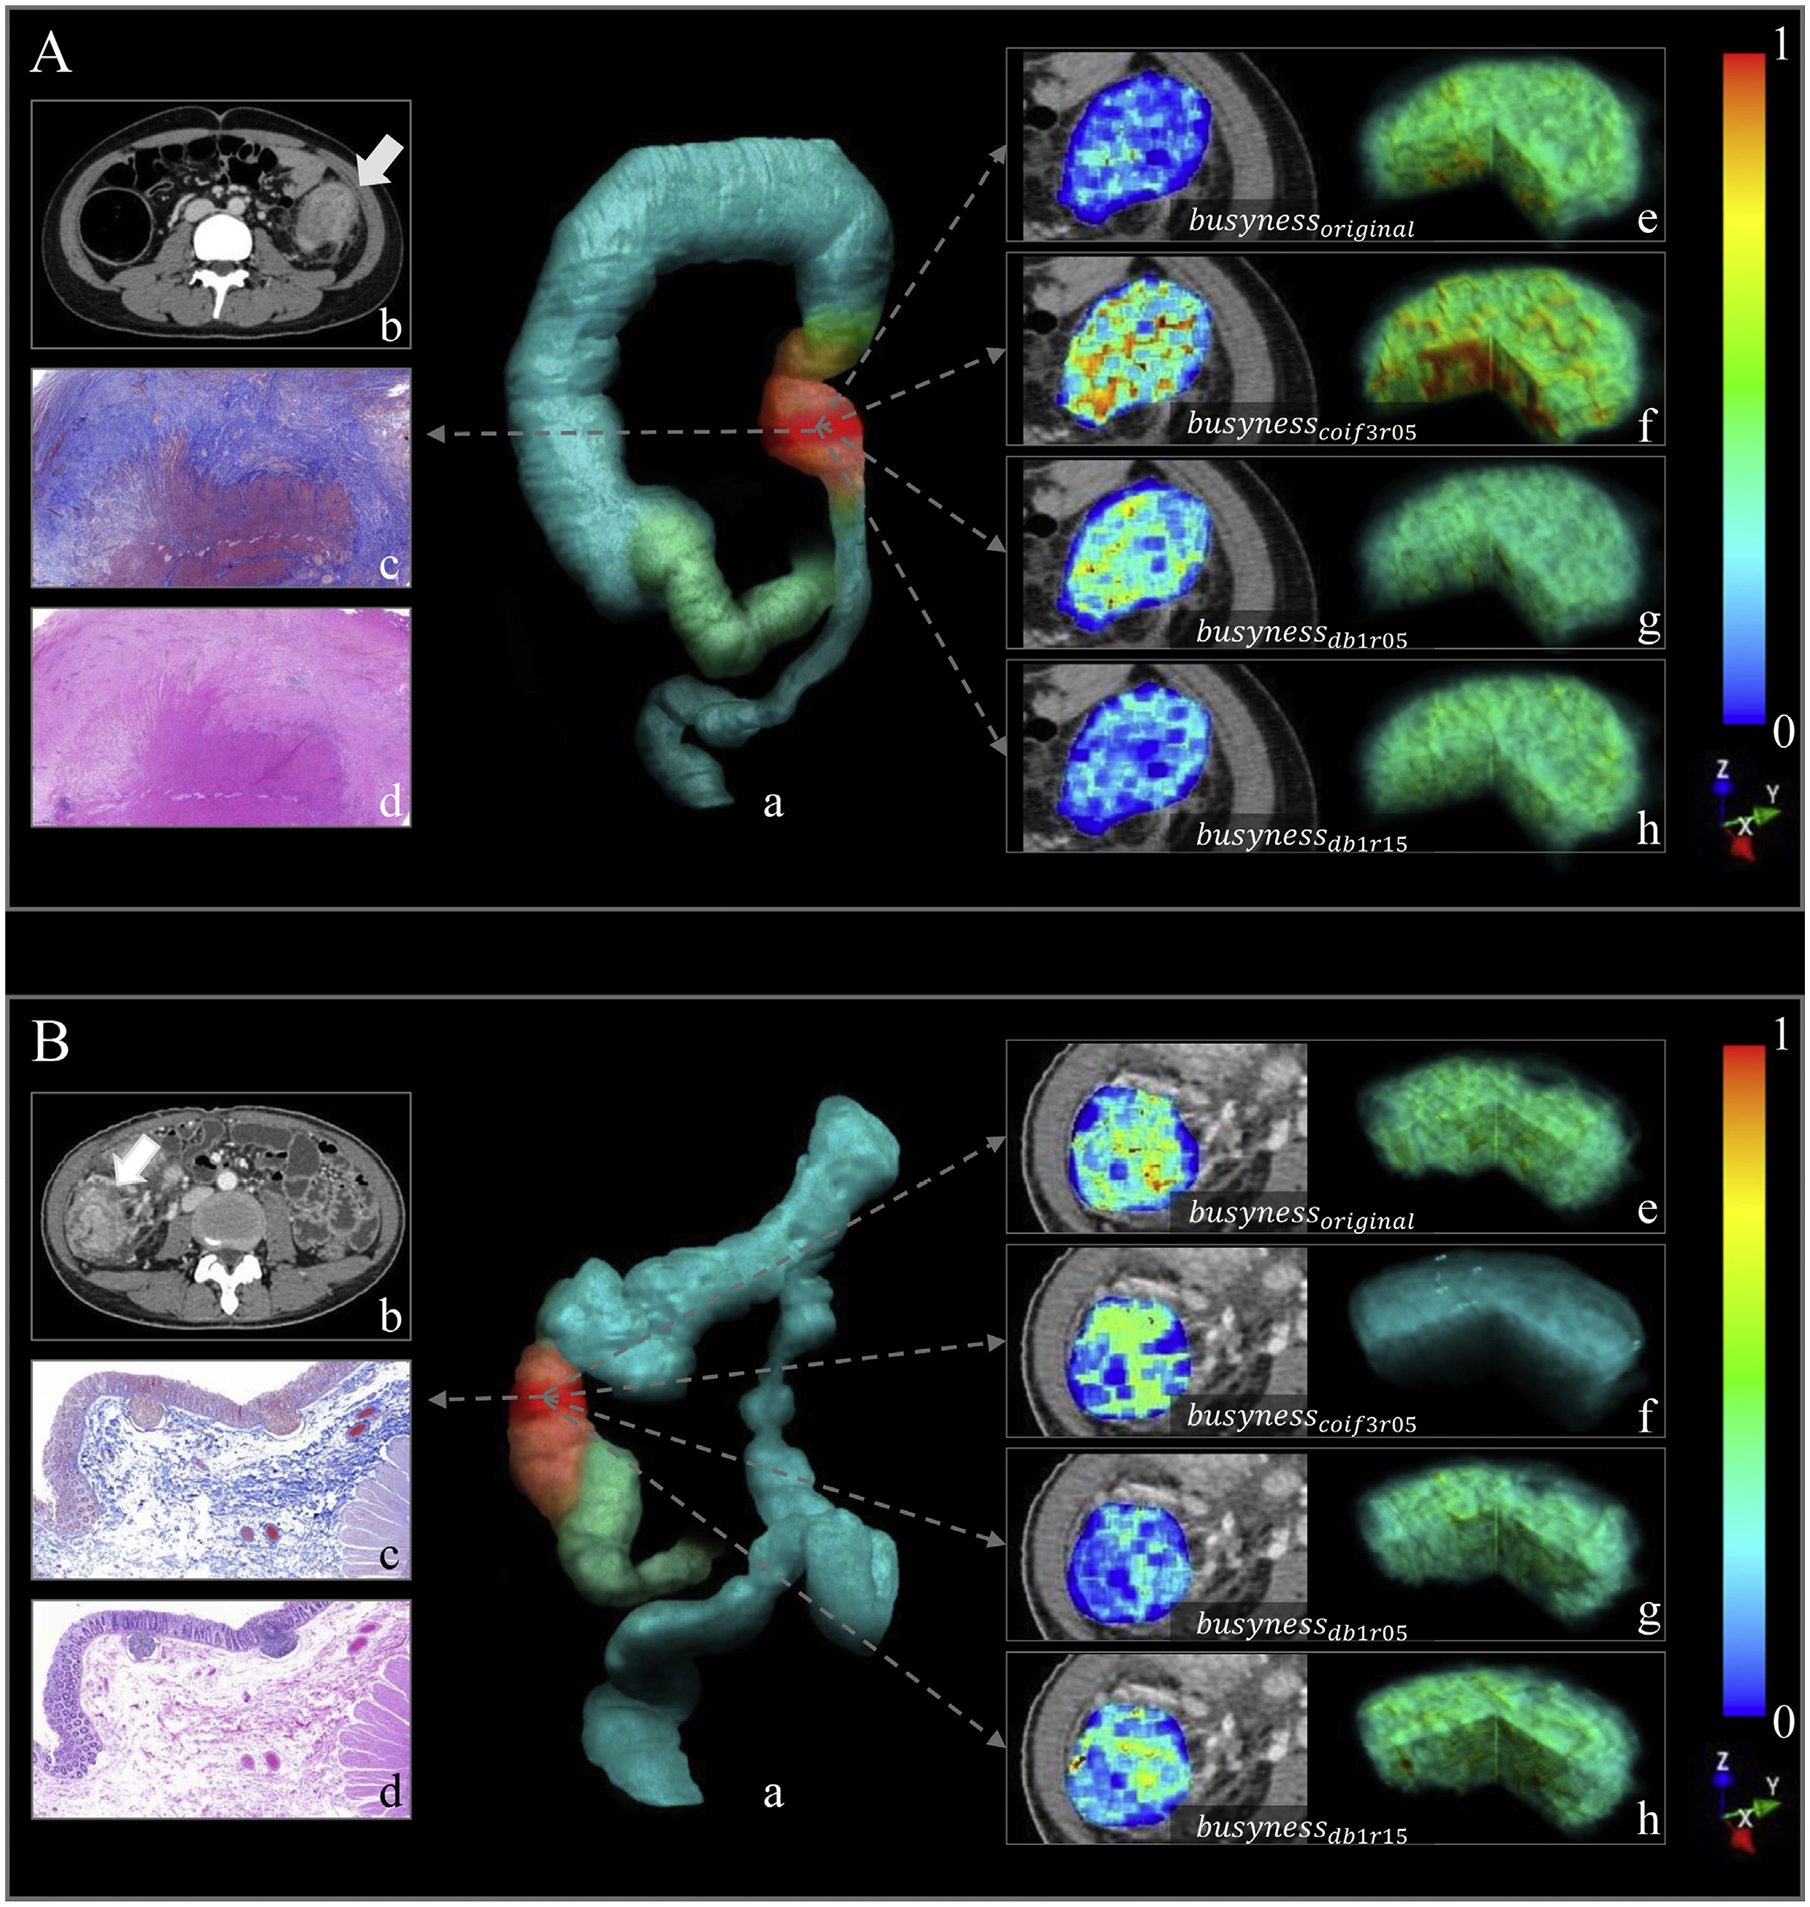
Figure 3.

Images show the radiomics analysis in (A) a 17-year-old girl with CD with moderate–severe fibrotic stricture (fibrosis score, 4; inflammation score, 3; predicted probability of RM, >99.9%), and (B) a 34-year-old woman with CD with none–mild fibrotic stricture (fibrosis score, 1; inflammation score, 1; predicted probability of RM, <0.1%). In each part, image (a) shows volume rendering reconstruction (blue-green area: intestinal tract; pink area: colonic stricture; red area: VOI in the stricture); axial contrast-enhanced venous-phase CTE image (b) shows a stricture of colon (arrow); images show Masson’s trichrome (c) and H&E staining (d), respectively (×40 magnification). Illustrations of the 4 busyness radiomic features overlaid on CTE images and their 3-dimensional stereogram are as follows: (e) busynessoriginal, (f) busynesscoif3r05, (g) busynessdb1r05, and (h) busynessdb1r15. To generate feature maps, the features were calculated for each voxel in the segmented VOIs with a kernel radius of 3 pixels, and the value was assigned to the center pixel.
