

Summary
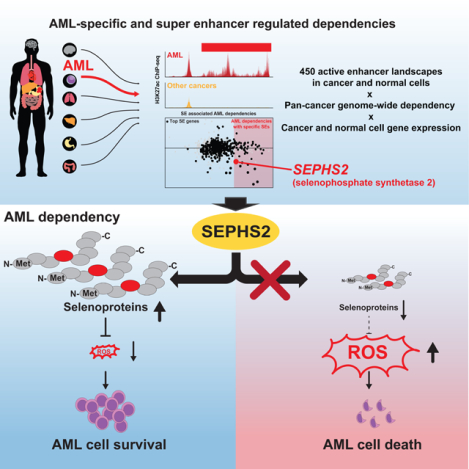
Deregulation of transcription is a hallmark of acute myeloid leukemia (AML) that drives oncogenic expression programs and presents opportunities for therapeutic targeting. By integrating comprehensive pan-cancer enhancer landscapes with genetic dependency mapping, we find that AML-enriched enhancers encode for more-selective tumor dependencies. We hypothesized that this approach could identify actionable dependencies downstream of oncogenic driver events and discovered a MYB-regulated AML-enriched enhancer regulating SEPHS2, a key component of the selenoprotein production pathway. Using a combination of patient samples and mouse models we show that this enhancer upregulates SEPHS2, promoting selenoprotein production and antioxidant function required for AML survival. SEPHS2 and other selenoprotein pathway genes are required for AML growth in vitro. SEPHS2 knockout and selenium dietary restriction significantly delay leukemogenesis in vivo with little effect on normal hematopoiesis. These data validate the utility of enhancer mapping in target identification and suggest that selenoprotein production is an actionable target in AML.
Keywords: AML, selenium, enhancer, MYB, SEPHS2, Hematopoiesis
Graphical Abstract
eTOC blurb
Eagle et al. combined pan-cancer genetic dependency data with active enhancer landscape and identified SEPHS2 as a highly AML-specific dependency regulated by MYB bound to its enhancer. SEPHS2 regulates selenoprotein production in AML, suppression of which by diet renders AML susceptible to oxidative stress without harming hematopoiesis.
Introduction
Acute myeloid leukemias (AML) represent a diverse array of myeloid malignancies with poor outcomes and few targeted therapies. Although AML is comprised of multiple distinct molecular subtypes, 75% of the top 20 most frequent AML driver mutations directly affect regulators of chromatin and transcription (Metzeler et al., 2016). Indeed, the aberrant activation of oncogenes such as HOXA9, MEIS1, and MYC via hyperacetylated proximal cis-regulatory enhancer regions is known to contribute to AML pathology and is caused by multiple driver mutations (Brunetti et al., 2018). These observations suggest that mapping of deregulated chromatin signatures in AML may uncover understudied oncogenic pathways and dependencies. In particular, enhancer gain of function whether by genetic or non-genetic mechanisms has been repeatedly shown to associate with oncogene activation (Groschel et al., 2014; Mansour et al., 2014).
Enhancers are non-coding regions of DNA that are bound by transcription factors and modulate the expression of nearby target genes via multiple mechanisms including remodeling of the local chromatin environment and direct recruitment/activation of the transcription machinery. In many cancers, driver genetic and non-genetic events lead to the formation of enhancers at key oncogenes (Hnisz et al., 2016; Mansour et al., 2014; Northcott et al., 2014; Shi et al., 2013). Additionally, mapping of tumor-specific enhancers has led to the discovery of tumor dependencies (Chapuy et al., 2013; Lin et al., 2016; Mack et al., 2018; Mack et al., 2019; Nabet et al., 2015). This is especially true for large clustered enhancer or super enhancers which are known to associate with oncogenes and tumor dependencies in a wide range of tumor types (Hnisz et al., 2013; Lin et al., 2016; Loven et al., 2013). Super enhancers are more cell- or tumor-type specific in their activity than either typical enhancers or promoter active cis-regulatory elements (Whyte et al., 2013). This has been attributed to their formation by the master transcription factors that establish cell or tumor identity (Hnisz et al., 2015; Lin et al., 2016; Saint-Andre et al., 2016). As a result, when oncogenes or tumor dependencies are regulated by large tumor-specific enhancers or super enhancers, they often have highly desirable selectivity as therapeutic targets.
The recent release of high-quality, pan-cancer, genome-wide CRISPR knockout lethality screening data has enabled the systematic exploration and identification of attractive and selective oncology target genes (Ghandi et al., 2019; McDonald et al., 2017; Meyers et al., 2017). Initial analyses of these data reiterate the selectivity of targeting tumor-specific lineage as encoded by master transcription factors (e.g. MITF in melanoma). Additionally, through integration with gene expression and tumor genetics, they establish potent synthetic lethal interactions that can potentially be exploited (e.g. CDK2 targeting in context of Rb loss (McDonald et al., 2017)). Although these datasets create a highly valuable resource, they have several limitations that provide opportunities for improved target identification: screening occurs in tumor cell lines which are known to be highly divergent from primary tumors (Chapuy et al., 2013; Lin et al., 2016); and, observed CRISPR lethality provides an incomplete understanding of mechanism of action and selectivity. Thus, with the exception of cases where a clear genetic interaction serves as a biomarker, it is difficult to understand the basis for target gene selectivity and to establish an explanatory mechanism for therapeutic effect.
We hypothesize that the integration of tumor enhancer landscapes with pan-cancer dependency will allow better prioritization of highly tumor-specific, enhancer-encoded, selective dependencies and provide a better mechanistic understanding for observed selectivity — i.e., the precise tumor-specific regulation of a candidate target. Here we demonstrate this with our identification of the selenoprotein biosynthesis gene SEPHS2 as a highly-selective dependency encoded by a MYB-regulated oncogenic enhancer in AML.
Results
AML-enriched super enhancers encode for AML genetic dependencies
We assembled a curated atlas of high-quality enhancer landscapes across ~450 tumor, cell line, and normal tissue samples using genome-wide chromatin acetylation data (H3K27ac ChIP-seq) (Table S1). Enhancers were ranked based on H3K27ac signal as a validated surrogate for enhancer activity and mapped using our previously published ROSE2 algorithm (Brown et al., 2014). We focused on AML given the importance of chromatin and transcription and the availability of a rich primary tumor dataset (McKeown et al., 2017).
We found that genes associated with consensus top super enhancers in AML (Table S2; Table S3; Fig. S1A) showed increased dependency in AML (Fig. 1A). Amongst AML genetic dependencies (CERES dependency ≤ −0.25), genes with an AML-specific super enhancer exhibited a higher degree of selective dependency (Fig. 1B) as measured by the difference in CERES dependency between AML and non-AML lines. For all superenhancer associated AML dependencies, plotting enhancer specificity against selectivity of dependency revealed a leading edge of many well-characterized AML specific drivers including CDK6, RHOA, MED13, ZEB2, MYB, SPI1 (PU.1), GFI1, LMO2, FLI1, MCL1, and CEPBA (Fig. 1C). These genes possess highly specific super enhancers, highlighting the pervasiveness of super-enhancer oncogene regulation in AML. In addition to these known genes, we also identified the gene SEPHS2 (selenophosphate synthetase 2), a critical component of the selenoprotein production pathway responsible for converting selenium ions into selenophosphate (Fig. S1B). SEPHS2 is itself a selenoprotein, and in AML, it shows a dependency and elevated expression profile (Fig. 1D–E) similar to other known drivers (e.g. CDK6 in Fig. S1C–D).
Fig. 1. Pan-cancer enhancer and CRISPR dependency mapping reveals SEPHS2 as a highly-selective enhancer-regulated AML target.
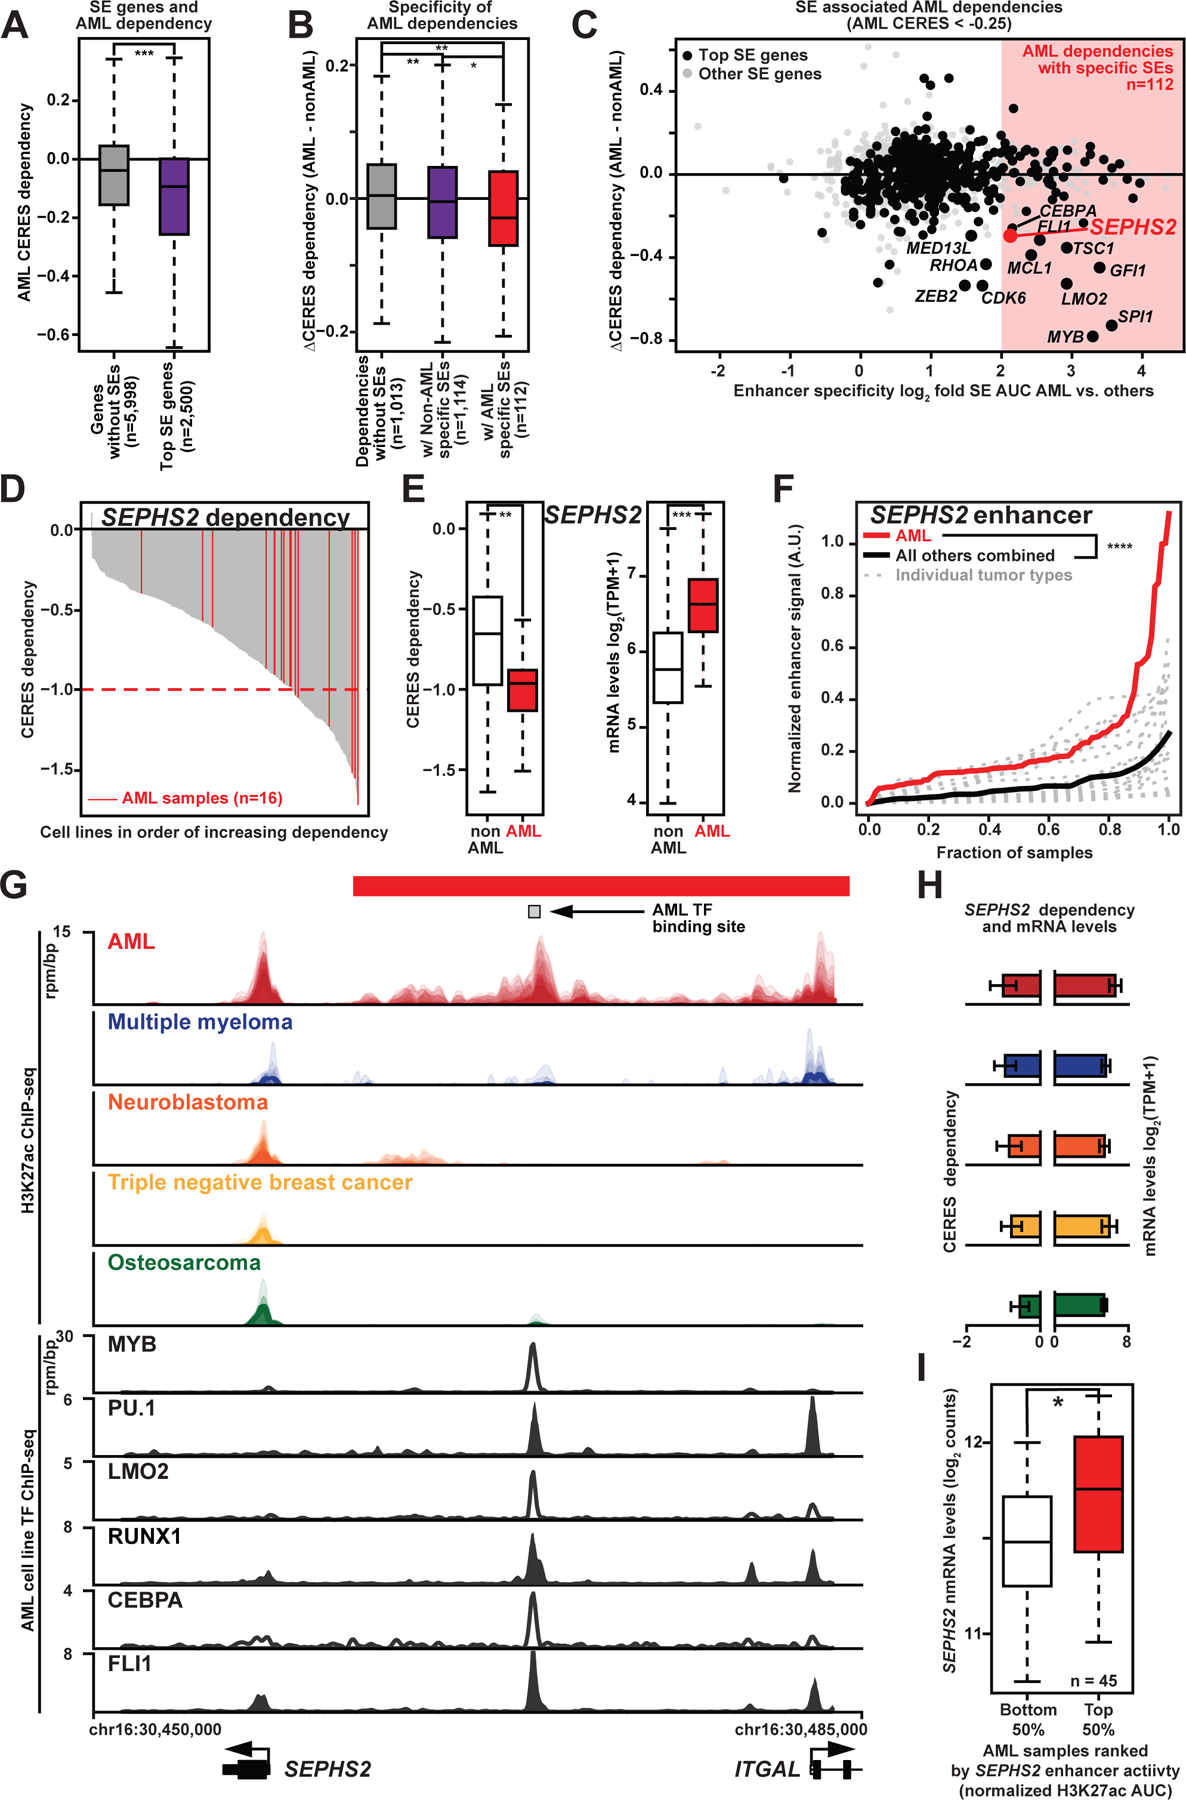
(A) CERES Avana dependency data for expressed genes in CERES Avana AML cell lines that have no SEs vs. CERES Avana dependency for the 2,500 genes in the same cell lines with the largest AML SEs. Probability by one-sided Wilcoxon rank-sum test; ***, p<0.001.
(B) Differential CERES Avana dependency (median dependency in AML cell lines minus median dependency in non-AML cell lines) for genes as in 1A. SE-associated genes shown for those genes with log2-fold enhancer specificity < 1 and log2-fold enhancer specificity >= 2 (enhancer specificity = quotient of median enhancer signals in AML vs. non-AML samples). Probability by one-sided Wilcoxon rank-sum test; *, p<0.05; **, p<0.01.
(C) For SE-associated genes, crossplot of differential CERES Avana dependency vs. enhancer specificity. Largest third of genes by median H3K27ac activity are in black. Attractive targets, mostly well-characterized AML drivers, are named.
(D) CERES Avana dependency for SEPHS2 for all 558 cell lines, with AML cell lines highlighted in red.
(E) Boxplot of CERES Avana dependency for SEPHS2 for all 558 cell lines (left), and corresponding mRNA expression.
(F) Normalized H3K27ac SE activity for SEPHS2 for each cancer type, sorted by normalized activity. The red line is all AML samples, while each gray line represents a different cancer type. The black line is an average of the non-AML samples.
(G) Top: H3K27ac ChIP-seq tracks near the SEPHS2 locus in AML (n=84), multiple myeloma (n=7), neuroblastoma (n=33), triple negative breast cancer (n=12), and osteosarcoma (n=18). Bottom: transcription factor ChIP-seq tracks over the same region.
(H) For SEPHS2, median CERES Avana dependency scores (left) and median CCLE mRNA (right) for all cell lines corresponding to the five cancer types in Fig 1G.
(I) SEPHS2 mRNA counts for AML patient samples with the highest and lowest quartiles of SEPHS2 SEs ranked by enhancer H3K27ac AUC. Probability by one-sided Wilcoxon rank-sum test; ***, p<0.001. See also Fig. S1.
SEPHS2 is regulated by an oncogenic AML super enhancer
By quantifying normalized SEPHS2 enhancer signal and comparing to other tumor types, we find that the SEPHS2 proximal enhancer ranked highly in AML in terms of both enhancer signal (Table S2; Fig. S1A) and specificity (Table S2; Fig. S1F). The median SEPHS2 enhancer in AML had 4-fold higher H3K27ac normalized occupancy than the median in other tumor types and roughly 10% of AML samples had a SEPHS2 enhancer stronger than any observed in all other tumor samples (Fig. 1F); these results are comparable to those of CDK6 (Fig. S1E). Inspection of the SEPHS2 locus in several well-characterized tumor types showed a clear enrichment of super enhancer activity in AML, and a significant correlation between enhancer signal and dependency (Fig. 1G–H) that is comparable to other known enhancer-regulated AML dependencies such as CDK6 (Fig. S1G–H). Finally, across AML, increased H3K27ac levels at the SEPHS2 enhancer were associated with elevated SEPHS2 expression (Fig. 1I). These data suggest that an AML-enriched super enhancer drives elevated SEPHS2 expression in AML.
To further explore the role of SEPHS2 upregulation in AML, we stratified the survival of TCGA AML cohort by SEPHS2 expression (Cancer Genome Atlas Research et al., 2013). This revealed that AML patients with high SEPHS2 expression had poor overall survival (Fig. 2A). Notably, Cox proportional hazards analysis of the TCGA cohort revealed that SEPHS2 expression is mostly strongly associated with FLT3 mutations (Fig. 2B). Consistently, in two independent cohorts (Beat AML (Tyner et al., 2018) and (Verhaak et al., 2009)), SEPHS2 expression was elevated in AMLs with FLT3 mutation with normal karyotype (Fig. 2C) as well as in NPM1c mutant AML (Fig. 2C–D; Fig. S2A). NPM1c mutant AML also display a modest survival association (Fig. 2B), however as NPM1c and FLT3 mutations tend to co-occur (Patel et al., 2017), this association may be superseded by the effect of FLT3 mutation in the univariate hazard analysis. Although some association is found between SEPHS2 expression and FLT3 or IDH1 mutations (Fig. 2B), it is unlikely that SEPHS2 is regulated directly by FLT3 or IDH1 mutant oncogenes, as expression of these mutants did not affect SEPHS2 expression (Fig. S2B–F). Thus, while the clinical significance of the association between SEPSH2 expression and FLT3 or NPM1c mutation remains to be investigated, these data demonstrate that high SEPHS2 expression associates with poor prognosis and the highly lethal FLT3 mutant subtype (Patel et al., 2012; Schlenk et al., 2008).
Fig. 2. SEPHS2 expression is associated with poor prognosis AML.
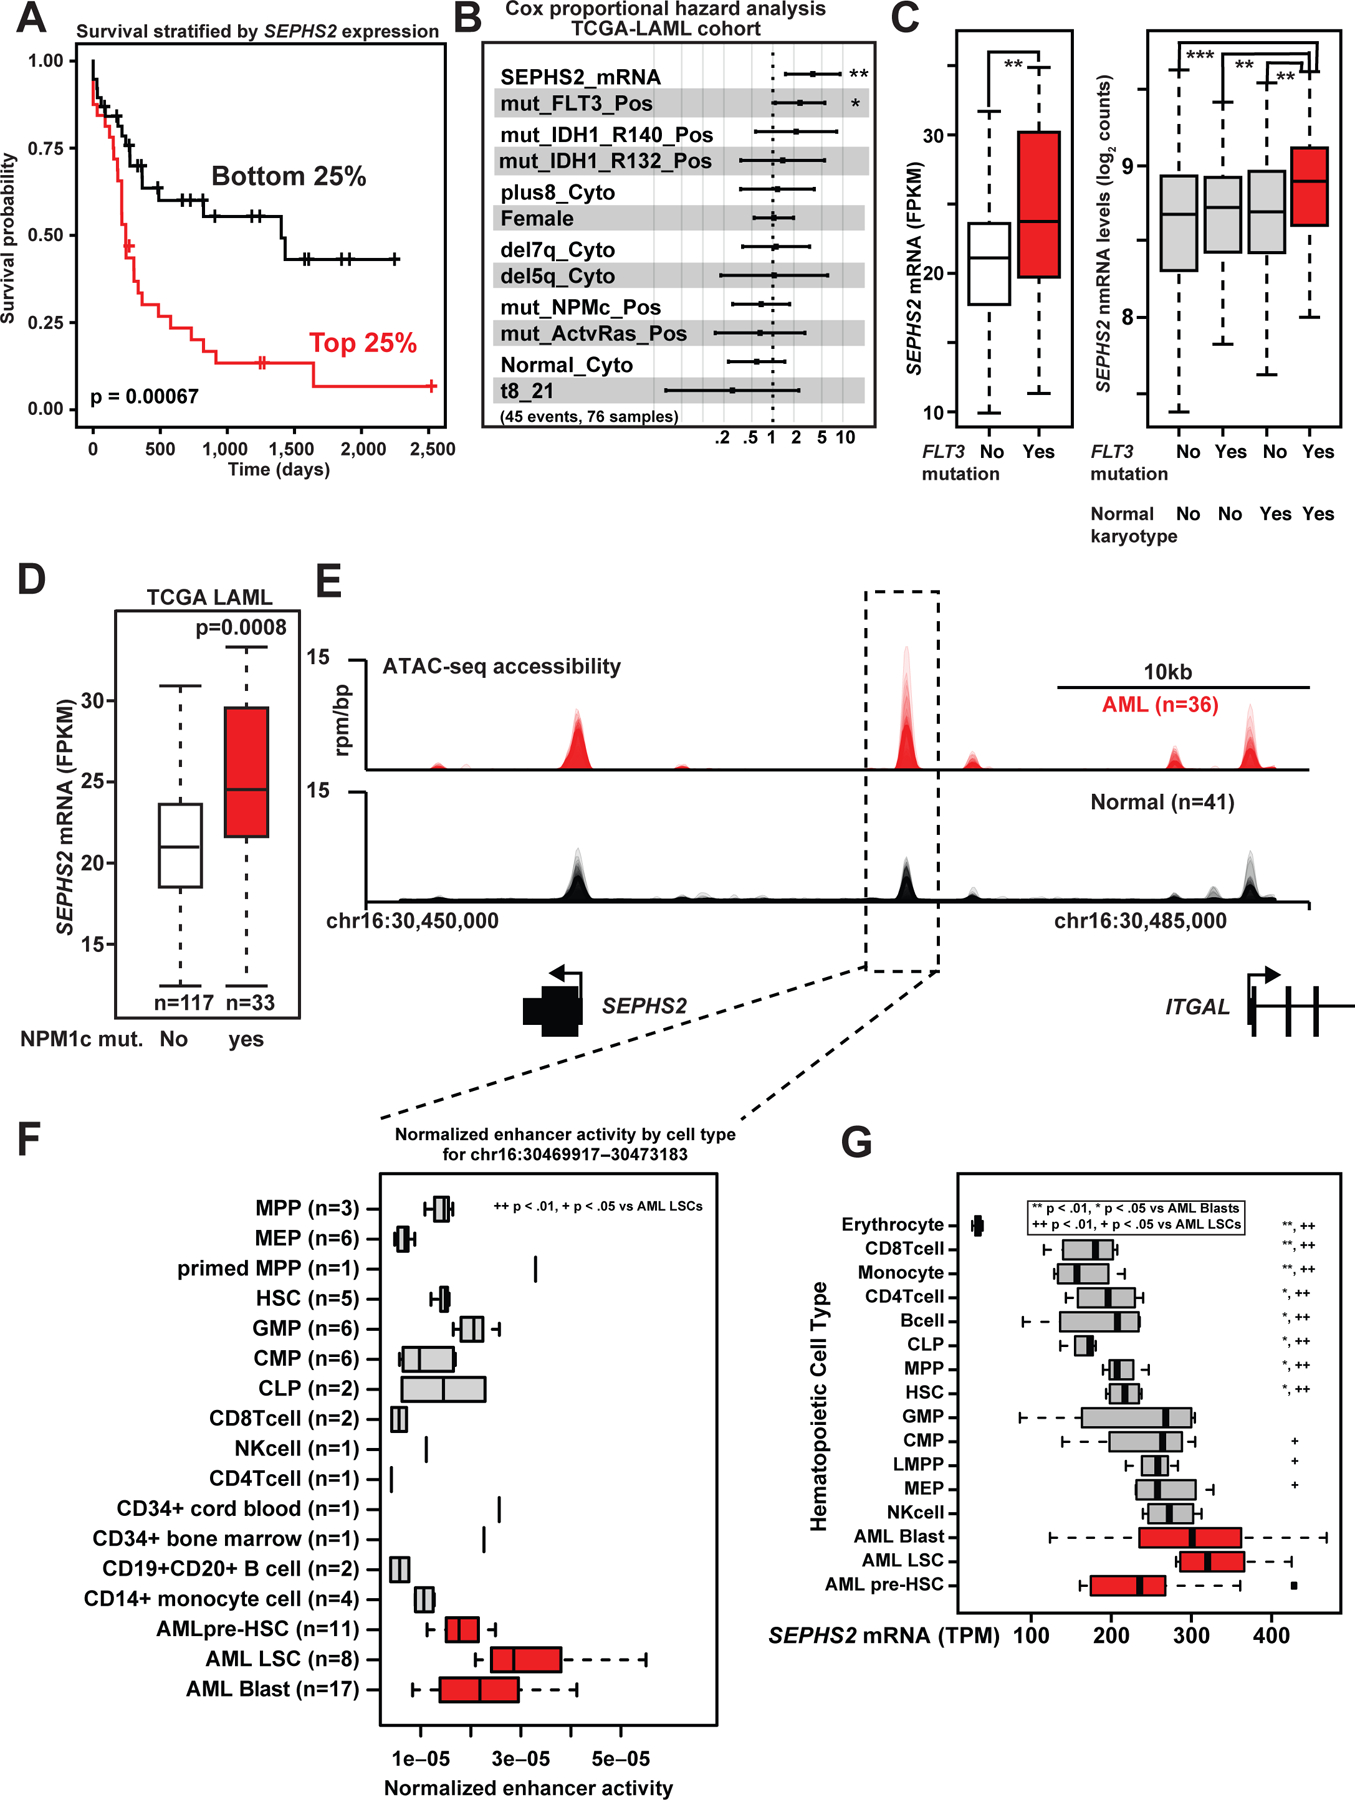
(A) Survival data from TCGA for the patients with the highest and lowest quartiles of SEPHS2 mRNA expression (FPKM). Probability by log-rank test.
(b) Cox proportional hazards analysis of TCGA-LAML data for the patients with the highest and lowest quartiles of SEPHS2 mRNA expression (FPKM).
(C) SEPHS2 FPKM of TCGA patient samples with or without FLT3 mutations (left). The panel on right shows similar data from Verhaak, separating their cohort by karyotypes. Probability by one-sided Wilcoxon rank-sum test.
(D) SEPHS2 mRNA expression (FPKM) of TCGA-LAML cohort segregated based on the presence or absence of NPMc mutations.
(E) ATAC-seq meta-tracks in AML samples (blasts, leukemia stem cells (LSCs), and pre-LSC) vs. normal hematopoietic populations near the SEPHS2 locus.
(F) Boxplot of patient chromatin accessibility at the SEPHS2 enhancer region aggregated by cell type. Significance of chromatin accessibility for AML LSCs vs. other subgroups is shown. Probability by one-sided Wilcoxon rank-sum test.
(G) Boxplot of patient SEPHS2 mRNA aggregated by cell type. Significance of chromatin accessibility for AML LSCs and AML blasts vs. other subgroups is shown. Probability by one-sided Wilcoxon rank-sum test. See also Figure S2.
Augmented SEPHS2 enhancer regulation in AML versus normal hematopoietic cells
Having established that SEPHS2 is associated with poor clinical outcomes in AML and possesses a super enhancer that is selective to AML versus other tumor types, we next investigated SEPHS2 enhancer regulation between AML and normal hematopoietic cells. Utilizing a compendium of chromatin accessibility data (ATAC-seq) spanning AML and normal hematopoietic lineages (Corces et al., 2016), we observed elevated chromatin accessibility in AML vs. normal hematopoietic cells at the SEPHS2 locus and specifically at the enhancer element bound by MYB and other AML transcription factors (Fig. 1G and 2E). This increased chromatin accessibility is most pronounced for AML leukemic stem cells vs. other progenitor and stem subpopulations (Fig. 2F). These AML-specific changes in chromatin are substantiated by elevated levels of SEPHS2 mRNA in AML versus normal cell types (Fig. 2G). Notably, pre-leukemic hematopoietic stem cells (AML pre-HSC) exhibited lower levels of SEPHS2 expression consistent with SEPHS2 upregulation occurring downstream of AML driver events such as FLT3 mutation. From these data we conclude that SEPHS2 is regulated by an oncogenic enhancer that is associated with AML aggression and is more active in AML versus both other cancers and normal hematopoietic cells.
Deletion of the SEPHS2 enhancer downregulates SEPHS2 in AML
To determine whether the putative SEPHS2 enhancer directly regulates SEPHS2 expression, we functionally edited the enhancer in a series of cancer cell lines expressing SEPHS2. We first confirmed preferential H3K27ac accumulation at the SEPHS2 enhancer by H3K27ac chromatin immunoprecipitation coupled with quantitative PCR (ChIP-qPCR). We observed enrichment of H3K27ac at SEPHS2 enhancer in MOLM-13 AML cells but not in breast cancer (MDA-231) or neuroblastoma (BE(2)-C) cell lines (Fig. 3A).
Fig. 3. The SEPHS2 enhancer recruits MYB and is required for AML proliferation.
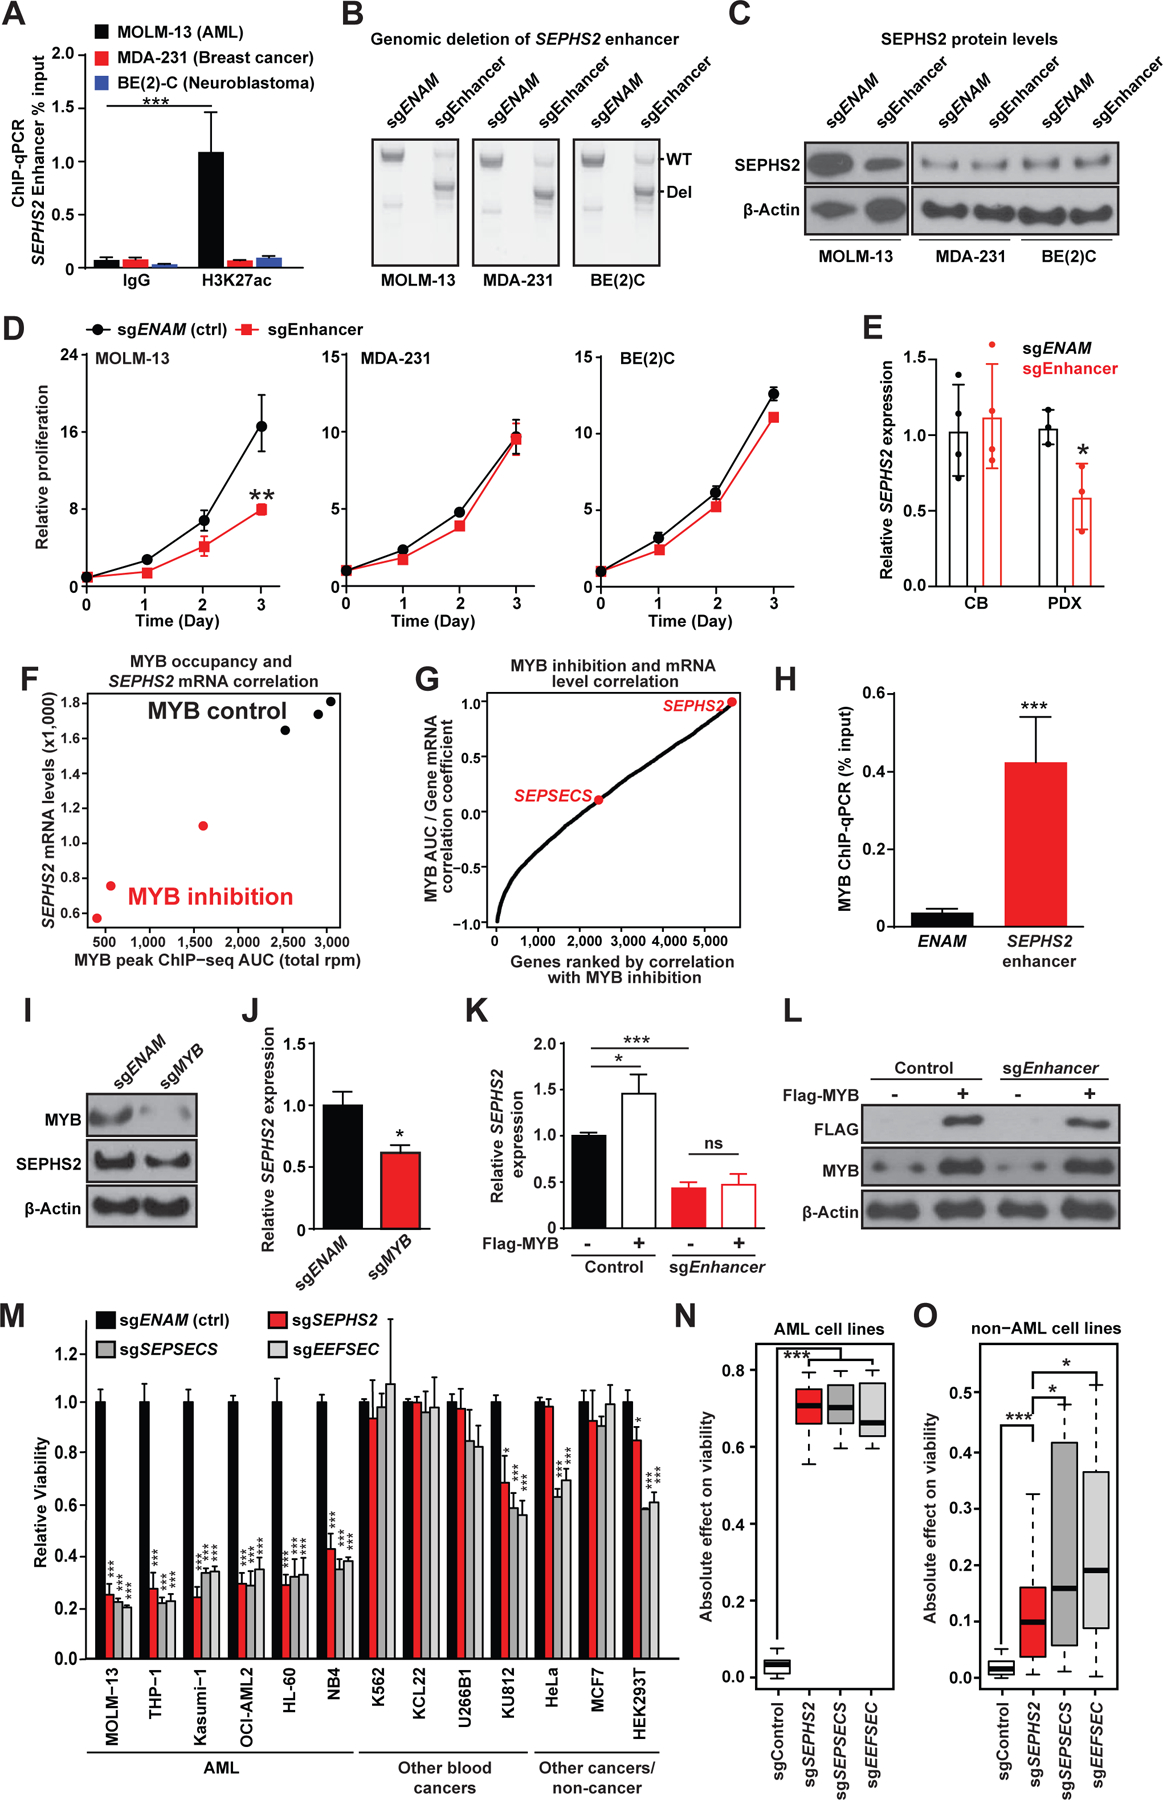
(A) ChIP-qPCR analysis of H3K27ac occupation at the SEPHS2 enhancer locus in MOLM-13 (AML), MDA-231 (Breast cancer), and BE(2)C (Neuroblastoma) cell lines (n=3). ***, p<0.001 by Student’s t-test.
(B) Gel image of PCR amplified enhancer locus after CRISPR mediated deletion of a control locus ENAM (involved in amelogenesis) or the SEPHS2 enhancer. Shown are wild-type (WT) and the expected deletion (Del) bands.
(C) Immunoblotting for SEPHS2 in the indicated cell lines after CRISPR-mediated disruption of the SEPHS2 enhancer.
(D) Relative rates of proliferation after CRISPR mediated deletion of the SEPHS2 enhancer locus in MOLM-13, MDA-231 and BE(2)C cell lines after plating 105 cells on day 0 (n=3). **, p<0.01 by Student’s t-test.
(E) Relative expression level of SEPHS2 in cord blood-derived CD34+ HSPCs (CB) or human AML patient-derived xenograft cells (PDX) after CRISPR-mediated disruption of the SEPHS2 enhancer (n=3–4). *, p<0.05 by Student’s t-test.
(F) SEPHS2 mRNA counts vs. MYB ChIP-seq area under the curve (from the region chr16:30469935–30470491) in MV-411 cells treated with or without a MYB inhibitor.
(G) Pearson correlation coefficients between local MYB AUC and mRNA expression for each reported gene across six samples, three controls and three with inhibited MYB binding.
(H) ChIP-qPCR analysis of MYB occupation at the SEPHS2 enhancer locus and a control locus (ENAM) in MOLM-13 cells (n=3). ***, p<0.001 by Student’s t-test.
(I) Immunoblotting for MYB and SEPHS2 in MOLM-13 cells after deleting MYB with CRISPR.
(J) Quantitative PCR analysis for SEPHS2 expression in control- or MYB-deleted MOLM-13 cells (n=3). *, p<0.05 by Student’s t-test.
(K) Quantitative PCR analysis for SEPHS2 expression in control or SEPHS2 enhancer-deleted MOLM-13 cells with or without retroviral transduction of FLAG-tagged MYB. *, p<0.05; ***, p<0.001 by Student’s t-test.
(L) Immunoblotting for endogenous and FLAG-tagged MYB with cells in (K).
(M) Relative cell proliferation after CRISPR mediated deletion of selenoprotein synthesis genes in different cell lines (n=3).
(N-O) Absolute change in proliferation from normalized control value of 1.0 in each AML (N) / non-AML (O) cell-line trial represented in Figure 3M, aggregated by gene deletion target. Probability by one-sided Wilcoxon rank-sum test; ***, p<.001, *, p<.05. See also Figure S3.
We next deleted this enhancer element with the CRISPR/Cas9 system using a pair of sgRNA sequences flanking the apex of H3K27ac signal (Fig. 3B). Deletion of the SEPHS2 enhancer reduced SEPHS2 mRNA and protein expression in MOLM-13 AML cells, which have high SEPHS2 expression, but not in breast cancer and neuroblastoma cell lines which also express SEPHS2 (Fig. 3C; Fig. S3A). Additionally, proliferation of AML cells but not breast cancer or neuroblastoma cells was significantly impaired, indicating that AMLs are highly sensitive to SEPHS2 suppression (Fig. 3D). Furthermore, deletion of this enhancer element reduced SEPHS2 expression in AML patient samples but not in CD34+ hematopoietic stem/progenitor cells (HSPCs) from umbilical cord blood (Fig. 3E; Fig. S3B). These data demonstrate that the SEPHS2 upstream element demarcated with H3K27ac enhances SEPHS2 expression in AML cells.
MYB directly binds to the SEPHS2 super enhancer and regulates SEPHS2 expression in AML
Within the SEPHS2 enhancer we note a constituent element with evident binding of MYB and other well-known AML transcription factors (Table S4; Fig. 1G). We reanalyzed the transcriptomic and MYB binding profiles of AML cells treated with a MYB peptidomimetic inhibitor (Ramaswamy et al., 2018) and found that SEPHS2 expression strongly correlates with MYB occupancy, both of which are attenuated by the MYB inhibitor (Fig. 3F–G; Table S5) suggesting direct regulation of SEPHS2 by this MYB-occupied enhancer element. Indeed, chromatin immunoprecipitation coupled with quantitative PCR (ChIP-qPCR) validated MYB binding to the enhancer locus in MOLM-13 cells (Fig. 3H). Furthermore, deletion of MYB by CRISPR/Cas9 significantly impaired cell proliferation and decreased SEPHS2 mRNA expression (Fig. 3I–J; S3C). To further confirm that the effects of MYB on SEPHS2 expression were mediated through its binding to the enhancer, we overexpressed MYB in wild type and SEPHS2 enhancer-deleted AML cells (Fig. 3K–L). We find that MYB is only able to upregulate SEPHS2 expression in the context of an unedited and intact SEPHS2 enhancer (Fig. 3K–L). On the contrary, deletion of PU.1 or RUNX1 did not appreciably reduce SEPHS2 expression (Fig. S3D). Collectively, these data establish that MYB has a profound effect on SEPHS2 expression among other AML transcription factors that are recruited to the SEPHS2 enhancer.
SEPHS2 and other selenoprotein pathway components are required for AML growth in vitro and in vivo
SEPHS2 is one of several genes in the selenoprotein production pathway (Supplementary Fig. S1B). To validate its selective genetic dependency in AML, we first performed genetic knockout experiments in a panel of 13 cell lines using CRISPR/Cas9. Here, we targeted SEPHS2 and two other components of selenoprotein production, SEPSECS and EEFSEC — which are involved in charging of the selenocysteine tRNA (tRNA−sec) and its incorporation during translation (Fig. 3M; Fig. S1B). Knockout of any of the three genes, but not SEPHS1 (the paralog of SEPHS2), significantly impaired viability of AML cell lines (Fig. 3M; Fig. S3E–H). For SEPHS2, we confirmed time-dependent effects of SEPHS2 knockout in AML cell lines, mouse AML induced by MLL-AF9 or MOZ-TIF2 oncogenes (Aikawa et al., 2010; Krivtsov et al., 2006) and two independent human patient derived xenograft (PDX) cells (Han et al., 2017; Jiang et al., 2018) (Fig. S3E).
Calculating the absolute effect of each genetic perturbation showed that AML cells exhibit stronger dependency on the selenoprotein synthesis pathway compared to non-AML cell lines (Fig. 3N–O). Among the three genes, deletion of SEPHS2 had the least effect on non-AML cells, while significantly impairing the viability of a panel of AML cells (Fig. 3N–O, Fig. S3E). In AML, knockout was associated with a decrease in DNA replication and a slight increase in apoptosis (Fig. S3I–J). In addition to SEPHS2, both SEPSECS and EEFSEC are highly expressed in AML (Fig. S3H), and for all three genes we confirm loss of protein upon genetic deletion. However, unlike SEPHS2, the SEPSECS and EEFSEC genes showed limited evidence of AML-specific dependency in the pan-cancer dataset (Fig. S3L–M). In contrast to SEPHS2, SEPSECS is not associated with a strong consensus AML super enhancer and does not demonstrate evidence of MYB regulation (Fig. 3G and Fig. S3K, N–O); EEFSEC is not associated with any consensus AML super enhancers (Fig. S3P–Q). Thus, by our own functional validation and supported by pan-cancer dependency mapping, we find multiple components of the selenoprotein production pathway to be dependencies in AML with the AML-specific super enhancer regulated SEPHS2 exhibiting the strongest selectivity.
To examine the impact of SEPHS2 deletion in AML in vivo, we generated two mouse models of AML driven by either MLL-AF9 or MOZ-TIF2 oncogenes (Aikawa et al., 2010; Krivtsov et al., 2006) and deleted Sephs2, Sepsecs, or Eefsec using CRISPR/Cas9. Efficient depletion of these proteins in the two AML models was confirmed by immunoblotting (Fig. S3H). By transplanting these gene-edited AML cells, we consistently found that knockout of selenoprotein pathway genes extends overall survival (Fig. 4A–B). We also observed decreased AML cells (marked by GFP) and white blood cell counts in the blood of recipient mice (Fig. 4C–D and Fig. S4A–B). Culturing Sephs2-deleted MLL-AF9-induced murine AML cells on semi-solid media revealed that deleting Sephs2 attenuates the ability of immature AML cells to serially replate, consistent with the defective leukemogenesis in vivo (Fig. S4C).
Fig. 4. Selenoprotein production pathway genes are genetic dependencies in AML.
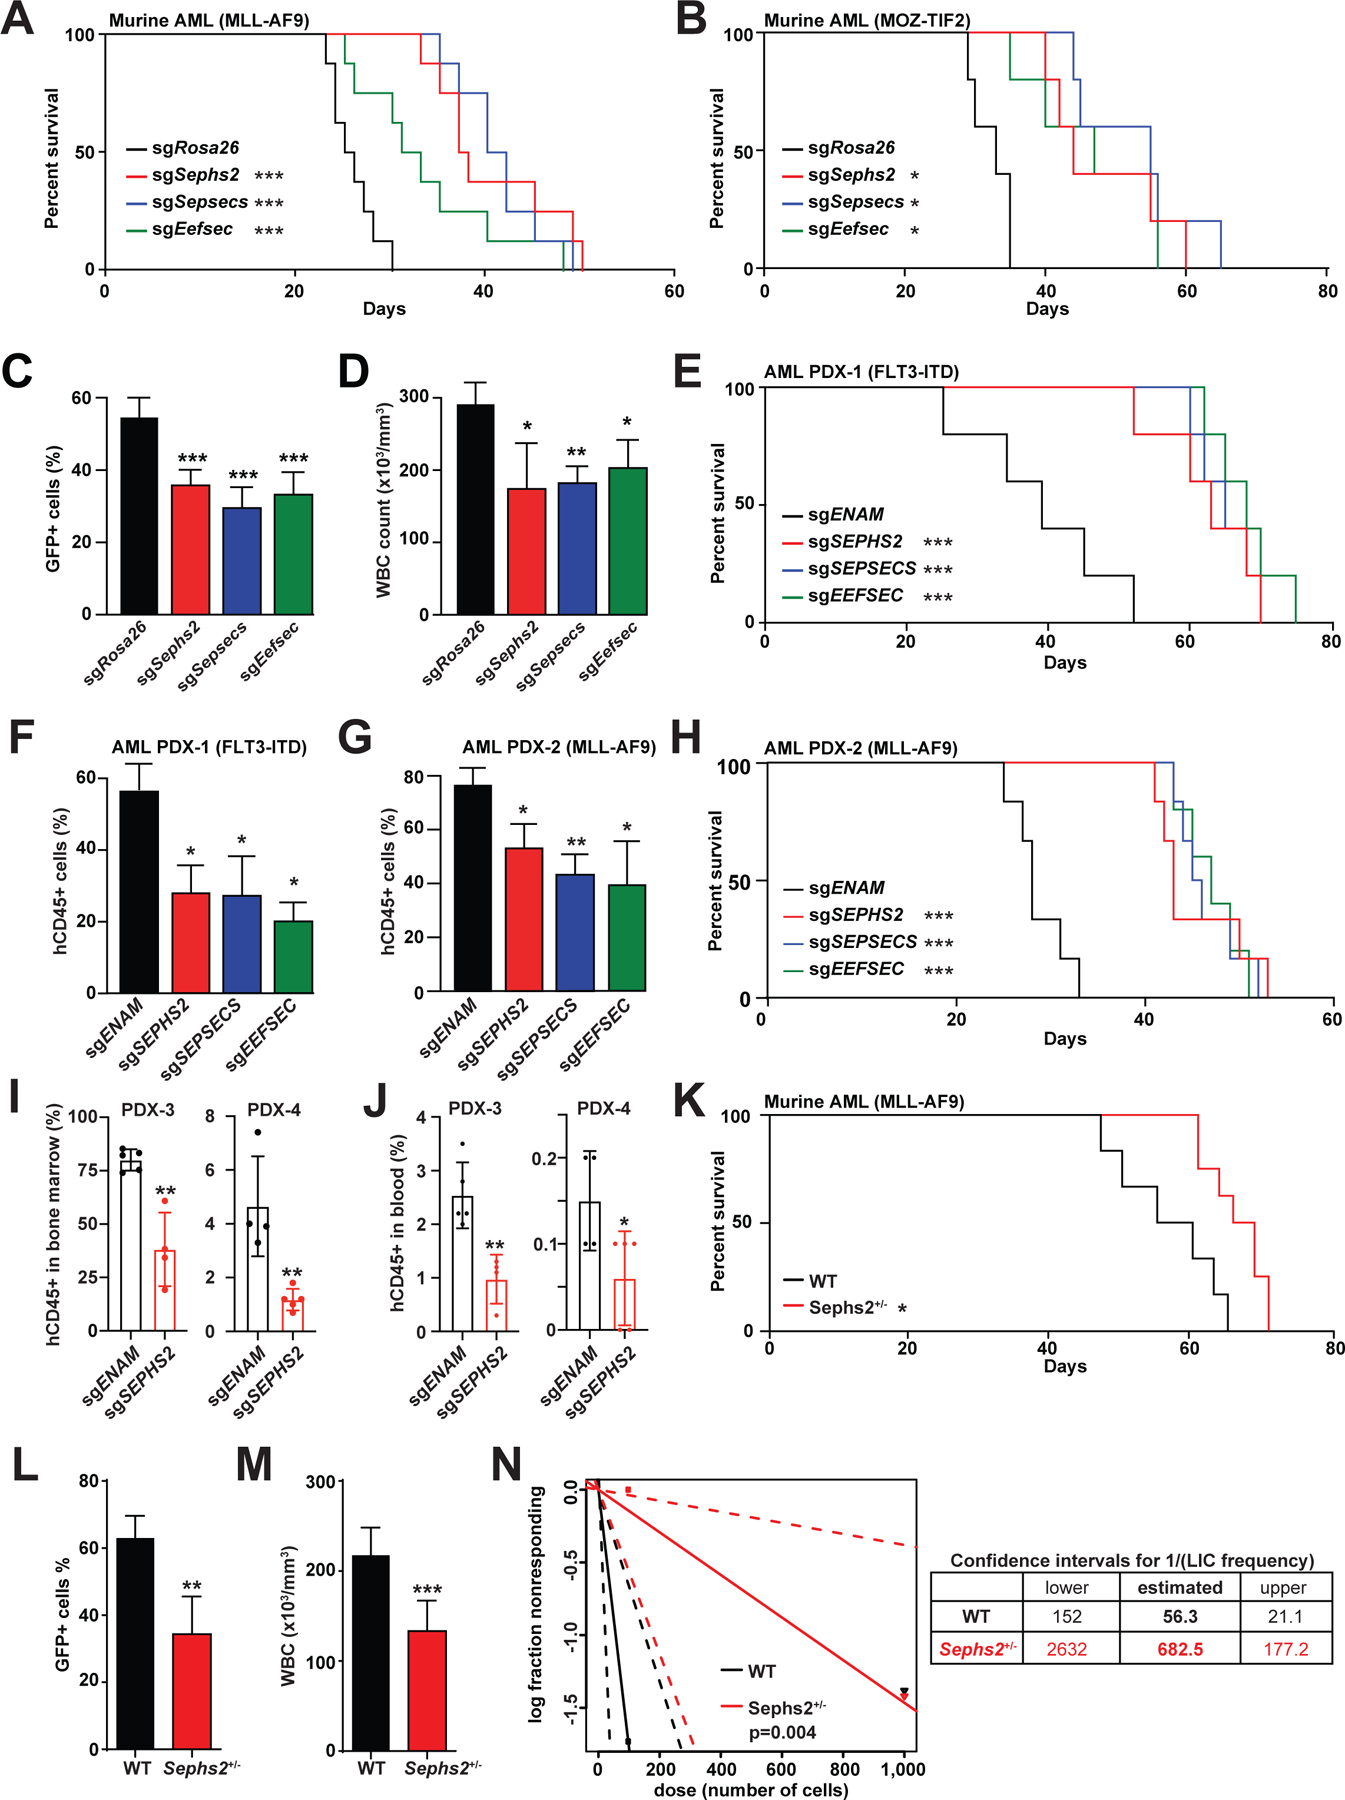
(A-B) Survival of mice transplanted with murine MLL-AF9-induced (A, n=8) or MOZ-TIF2-induced (B, n=5) AML after CRISPR mediated deletion of selenoprotein synthesis genes. *, p<0.05; ***, p<0.001 by log-rank test.
(C-D) Flow cytometry analysis of GFP+ murine AML cells in peripheral blood (C) and white blood cell count (D) of the AML recipient mice at day 21. *, p<0.05; **, p<0.01; and ***, p<0.001 by one-way ANOVA.
(E) Survival of NSG-SGM3 mice transplanted with human PDX AML carrying a FLT3-ITD mutation after CRISPR-mediated deletion of selenoprotein synthesis genes (n=5). ***, p<0.001 by log-rank test.
(F-G) Flow cytometry analysis to detect human CD45+ AML cells in the NSG-SGM3 recipient bone marrow cells transplanted with FLT3-ITD (F) or MLL-AF9 (G) human AML samples. For (F-G, L-M), analyses were done on the day of euthanasia. *, p<0.05 and **, p<0.01; by one-way ANOVA.
(H) Survival of NSG-SGM3 mice transplanted with human PDX AML carrying a MLL-AF9 mutation after CRISPR-mediated deletion of selenoprotein synthesis genes (n=6). ***, p<0.001 by log-rank test.
(I-J) The level of human AML engraftment in the bone marrow (I) or the presence of human AML cells in the blood (J) of NSG-SGM3 recipient mice 45 days (bone marrow) or 36 days (blood) after xenotransplantation of ENAM- or SEPHS2- deleted cells (n=4).
(K) Survival of recipient mice transplanted with murine MLL-AF9-induced AML initiated in wild-type (WT, n=6) or Sephs2+/− HSPCs (n=8). *, p<0.05 by log-rank test.
(L-M) Flow cytometry analysis of GFP+ murine AML cells (L) and white blood cell counts (M) in peripheral blood of mice shown in (K).
(N) Limiting dilution transplantation assay with WT or Sephs2+/− MLL-AF9-induced AML cells. Estimated leukemia-initiating cell (LIC) frequency and 95% confidence intervals are shown on right. **, p<0.01; and ***, p<0.001 by Student’s t-test. See also Figure S4.
To extend these studies to human AML, we established two AML PDX models driven by either t(9;11) translocation creating the MLL-AF9 oncogene or by FLT3-ITD mutation (Han et al., 2017; Jiang et al., 2018; Jiang et al., 2019). The three selenoprotein synthesis genes, SEPHS2, SEPSECS, and EEFSEC, were efficiently deleted in these two AML PDX models by CRISPR/Cas9 (Fig. S3H). Transplantation of the gene-edited human AML cells of both FLT3-ITD and MLL-AF9 PDX models into immunocompromised NSG-SGM3 mice resulted in extended leukemia-free survival of recipient mice and reduced human CD45+ cells compared to control-edited AML (FLT3-ITD: Fig. 4E–F, and MLL-AF9: Fig. 4G–H). To establish the requirement of human AML on SEPHS2, we generated two additional AML PDX models, deleted SEPHS2 with CRISPR/Cas9, and analyzed AML engraftment. Both of these AML PDX models exhibited reduced engraftment of human AML cells in the bone marrow and had diminished frequencies of circulating AML cells in the blood (Fig. 4I–J). These results establish that the selenoprotein synthesis pathway is a vulnerability of both murine and human AML.
Prior experiments established the effects of knocking out a selenoprotein production pathway member in AML. To assess whether partial loss of SEPHS2 could also impact leukemogenesis, we obtained the Sephs2+/− mice, transformed HSPCs from these mice with MLL-AF9 and transplanted into recipient mice to establish AML. Deletion of a single allele of Sephs2 was sufficient to delay the onset of AML (Fig. 4K). AML that developed from Sephs2+/− cells had lower AML burden as assessed by the frequency of GFP+ AML cells and by WBC counts in blood (Fig. 4L–M). To determine the effects of Sephs2 heterozygous loss on the frequency of leukemia-initiating cells (LICs), we performed a limiting dilution transplantation assay. This analysis revealed that Sephs2 heterozygous deletion reduced LIC frequency by 12-fold (p=0.004) (Fig. 4N). In conclusion, these results establish that AML depends on the selenoprotein synthesis pathway, among which Sephs2 exhibits strong AML specific dependency.
Selenium dietary restriction does not affect normal hematopoiesis
As a potentially druggable enzyme, SEPHS2 merits strong consideration as a therapeutic target. In the interim, we hypothesized that selenium dietary restriction may be able to phenocopy selenoprotein synthesis pathway inhibition. Selenium is considered an essential element, although cells are able to tolerate a wide range of selenium concentrations. Both selenium supplementation and deprivation have been discussed as possible treatments for various cancers. Selenium-deprived mice were resistant to plasmacytoma formation in a pristane model (Felix et al., 2004). Additionally, selenium deprivation is well tolerated as mice survive in selenium-deprived diets for the entire life and exhibit no change in lifespan, and rather activate several pathways linked to longevity (Yim et al., 2019).
We first examined whether normal hematopoietic progenitor cells and AML cells exhibit different dependency on the selenoprotein synthesis pathway. We thus sorted lineage−c-kit+Sca-1+ (LSK) HSPCs and AML cells from mice and cultured them in selenium-deficient media supplemented with increasing amount of selenite. Both LSK and AML cells failed to proliferate in the absence of selenium (Fig. 5A). Notably, AML cells required approximately 2.3-fold more selenite to restore proliferation compared to LSK cells, suggesting that normal HSPCs are more capable at resisting low selenium conditions than AML cells (Fig. 5A). To test whether normal hematopoiesis is affected by selenium restriction in vivo, we fed wild-type mice with selenium-deficient diet for 10 weeks. We found that serum levels of Selenoprotein P (SEPP1), a liver-secreted selenoprotein that carries ingested selenium to peripheral cells, were significantly reduced in mice fed selenium-deficient diet for 3 weeks (Fig. 5B). Consistently, bone marrow cells isolated from mice fed selenium-deficient diet had reduced SEPHS2 protein level and increased oxidative stress (Fig. 5C and Fig. S5A).
Fig. 5. Hematopoiesis is largely unaffected by selenoprotein pathway inhibition.
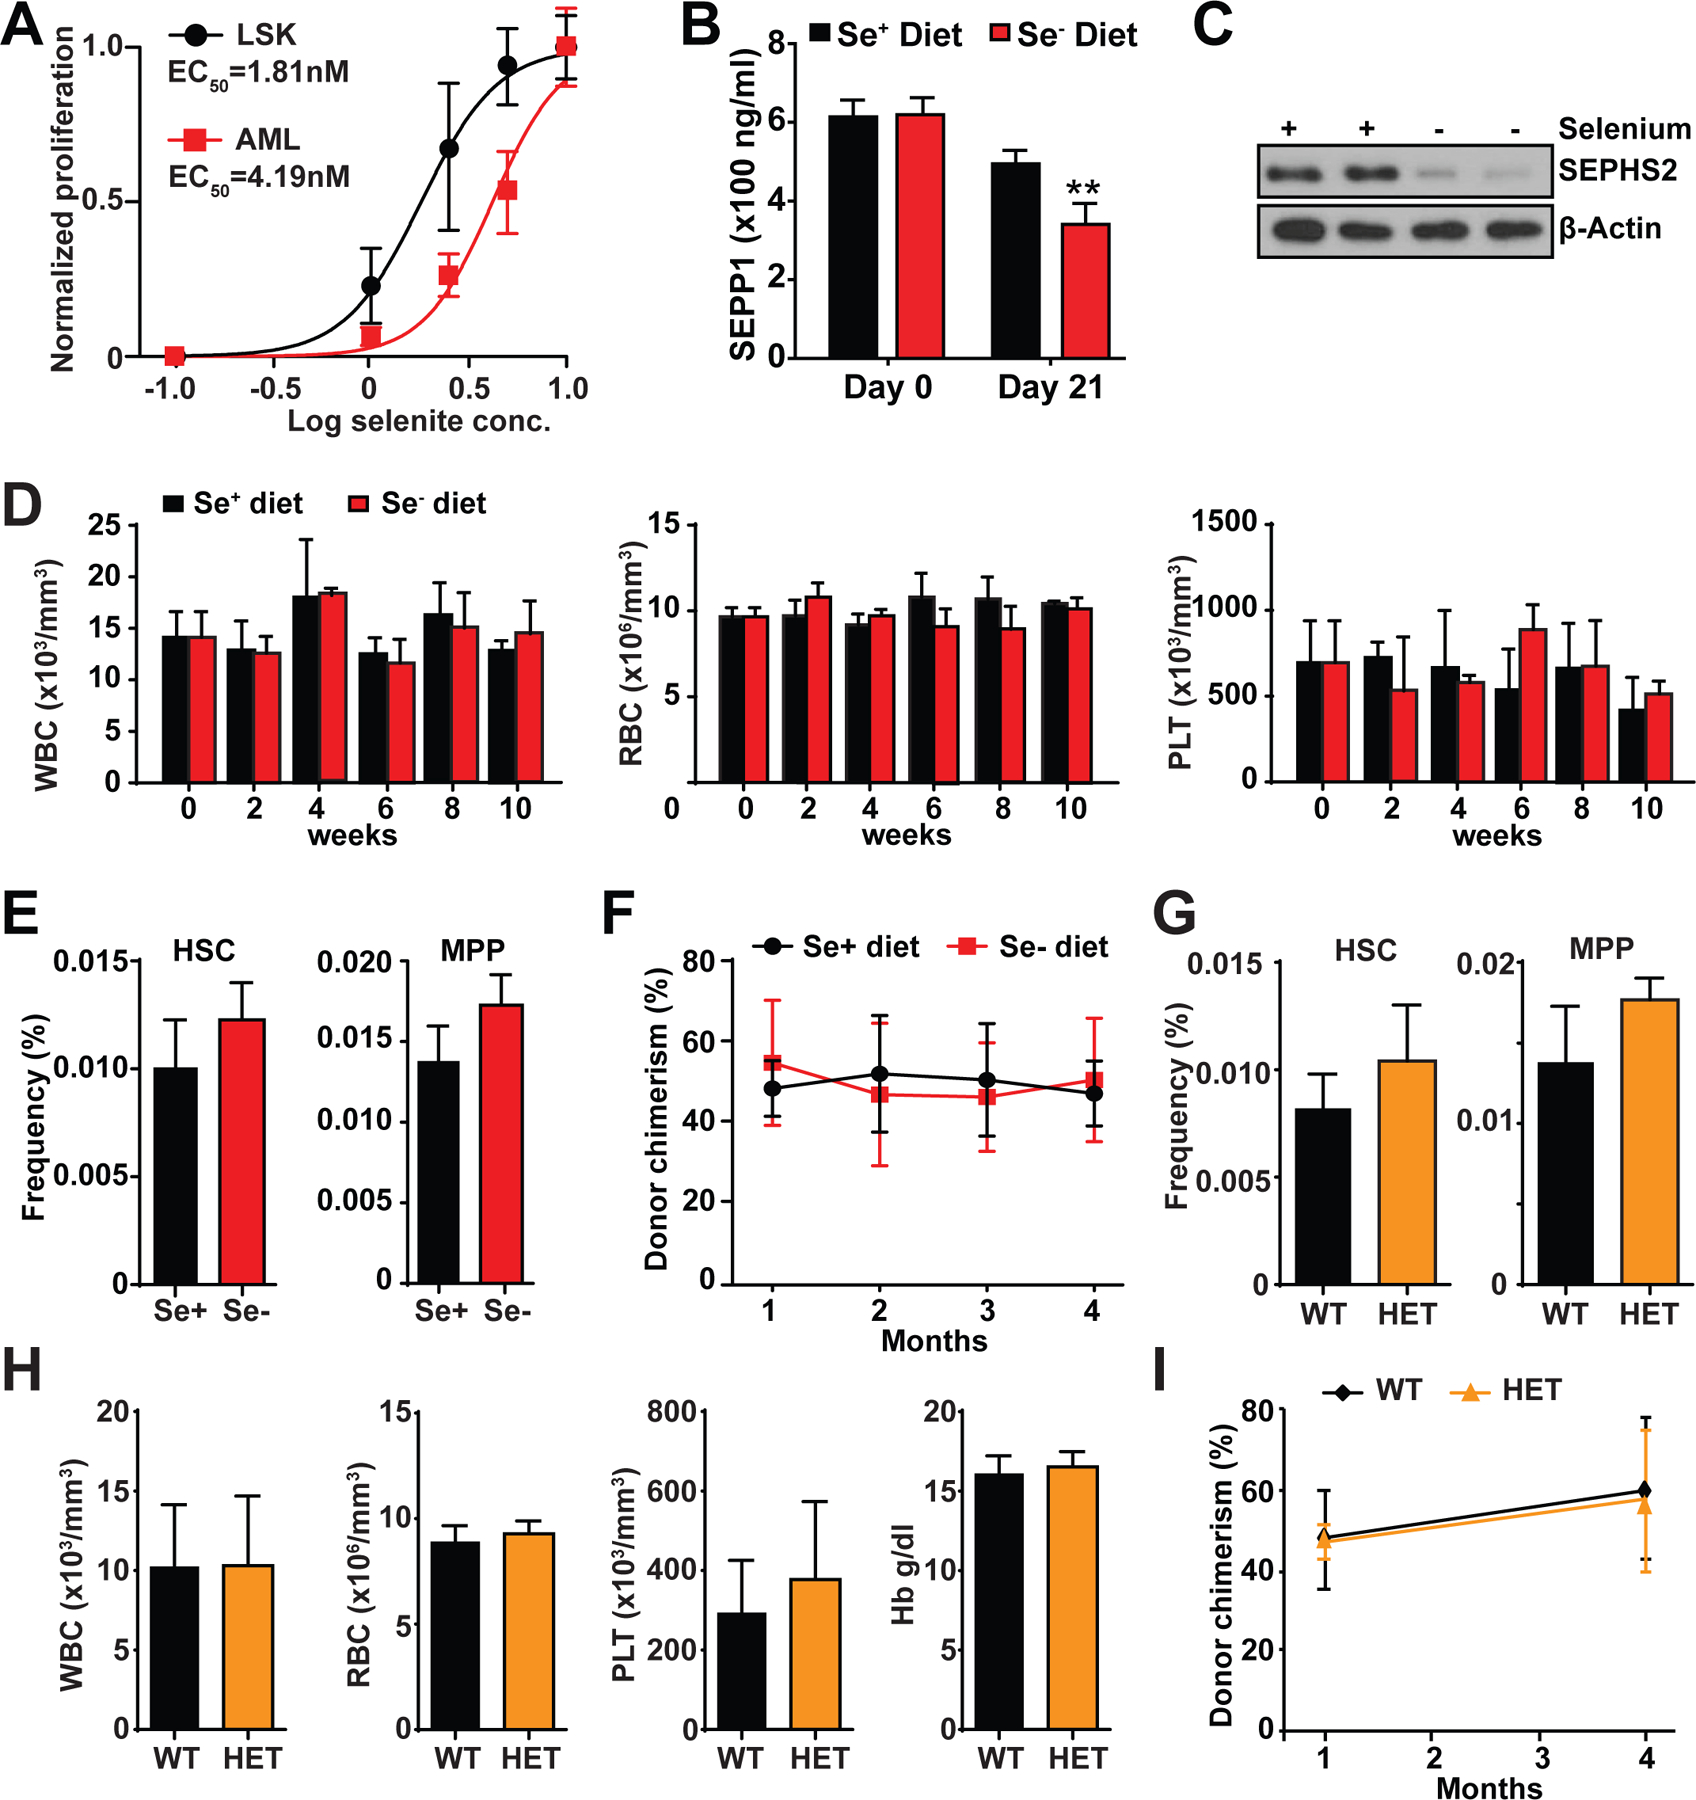
(A) Proliferation of murine AML or LSK progenitor cells cultured in media supplemented with different selenite concentrations (n=3).
(B) Measurement of serum Sepp1 protein level by ELISA (n=3). **, p<0.01; by Student’s t-test.
(C) Immunoblotting for SEPHS2 with bone marrow cells harvested from mice fed with selenium proficient (Se+) or deficient (Se−) diet for 10 weeks.
(D) Complete blood cell counts of white blood cells (WBC), red blood cells (RBC), platelets (PLT), and hemoglobin (Hb) of mice fed with selenium proficient (Se+) or deficient (Se−) diet for up to 10 weeks (n=3).
(E) Frequencies of HSCs and MPPs of mice fed with selenium proficient (Se+) or deficient (Se−) diet for 10 weeks (n=3).
(F) Long-term competitive bone marrow transplantation using donor mice fed with selenium proficient (Se+) or deficient (Se−) diet for 10 weeks. Recipient mice were fed with regular chow (n=4).
(G) Frequencies of HSCs and MPPs of wild-type (WT) and Sephs2+/− (HET) mice (n=3).
(H) Complete blood cell counts of white blood cells (WBC), red blood cells (RBC), platelets (PLT), and hemoglobin (Hb) of wild-type (WT) and Sephs2+/− (HET) mice (n=3).
(I) Long-term competitive bone marrow transplantation with wild-type (WT) and Sephs2+/− (HET) mice as donors (n=6). See also Figure S5.
Despite the significant depletion of SEPHS2 protein in bone marrow cells, hematopoiesis was not affected by selenium restriction. The numbers of white blood cells (WBC), red blood cells (RBC), and platelets (PLT) in the blood of selenium restricted mice did not show any differences compared to mice fed regular chow (Fig. 5D). Moreover, the frequencies of HSPCs, including hematopoietic stem cells (HSCs) and multipotent progenitor cells (MPPs), were not affected by selenium deprivation (Fig. 5E and Fig. S5B). To assess whether selenium restriction affects the function of HSCs to regenerate hematopoiesis upon transplantation, we performed a long-term competitive transplantation assay. We transplanted bone marrow cells isolated from mice fed with selenium-deficient or regular diet along with competitor bone marrow cells into irradiated recipient mice. Cells from selenium-restricted mice were as competitive as those from control mice in regenerating the hematopoietic system (Fig. 5F). Collectively, these data demonstrate HSPCs and normal hematopoiesis can tolerate dietary selenium restriction, a regimen that delays AML progression.
SEPHS2 heterozygosity does not impair normal hematopoiesis
We investigated the genetic dependency of HSPCs on Sephs2 by analyzing HSPCs and hematopoiesis in Sephs2+/− mice. In contrast to the strict dependency of AML on Sephs2 allelic dosage (Fig. 4K–N), normal hematopoiesis and HSPCs were not significantly affected by deleting one allele of Sephs2 (Fig. 5G–H). The frequencies of HSCs, MPPs, lineage-restricted progenitor cells, and mature hematopoietic cells in the bone marrow were not affected in Sephs2 heterozygous mice (Fig. 5G and Fig. S5C–D). Peripheral blood cell counts and the frequencies of myeloid, B-, and T-cells were also unaffected by Sephs2 heterozygosity (Fig. 5H). Furthermore, bone marrow competitive transplantation with Sephs2 WT and heterozygous mice established that Sephs2 heterozygous HSCs are fully capable of long-term multilineage reconstitution (Fig. 5I). These genetic studies therefore expose the differential dependency of AML and normal hematopoiesis on Sephs2, further supporting the notion that SEPHS2 may represent an understudied therapeutic target for AML.
Selenoproteins regulate oxidative stress response in AML
Having established the tolerability of normal hematopoiesis on selenium restriction, we next sought to characterize the functional consequences of perturbing selenoprotein pathway genes in AML. Selenoproteins are prominently involved in reductive oxidation (redox) homeostasis and include glutathione peroxidase 4 (GPX4), one of the most studied selenoproteins and regulators of oxidative stress response. Deletion of SEPHS2, SEPSECS, and EEFSEC in AML cells reduced GPX4 protein and elevated levels of γH2AX (a marker of DNA damage) (Fig. 6A and Fig. S6A). By multiple measurements, SEPHS2, SEPSECS, and EEFSEC perturbation induced oxidative stress (Fig. 6B and Fig. S6B–D) and myeloid differentiation (Fig. 6C and Fig. S6E) in MOLM13 cells. AML PDX cells also showed increased differentiation upon SEPHS2 deletion (Fig. 6D). To test whether the increased oxidative stress observed after deleting the selenoprotein synthesis pathway affects AML, we treated the cells with an antioxidant TEMPOL. We found that TEMPOL significantly attenuated oxidative stress in edited MOLM-13 cells in vitro (Fig. S6F) and increased proliferation of the edited cells (Fig. 6E). Importantly, TEMPOL administration in vivo partially ameliorated oxidative stress and reinstated leukemogenesis by AML cells deleted for Sephs2, Sepsecs, or Eefsec (Fig. 6F and Fig. S6G–I). These data establish impaired redox homeostasis as underlying the defective proliferation of selenoprotein synthesis-deficient AML.
Fig. 6. Selenoproteins regulate oxidative stress response in AML.
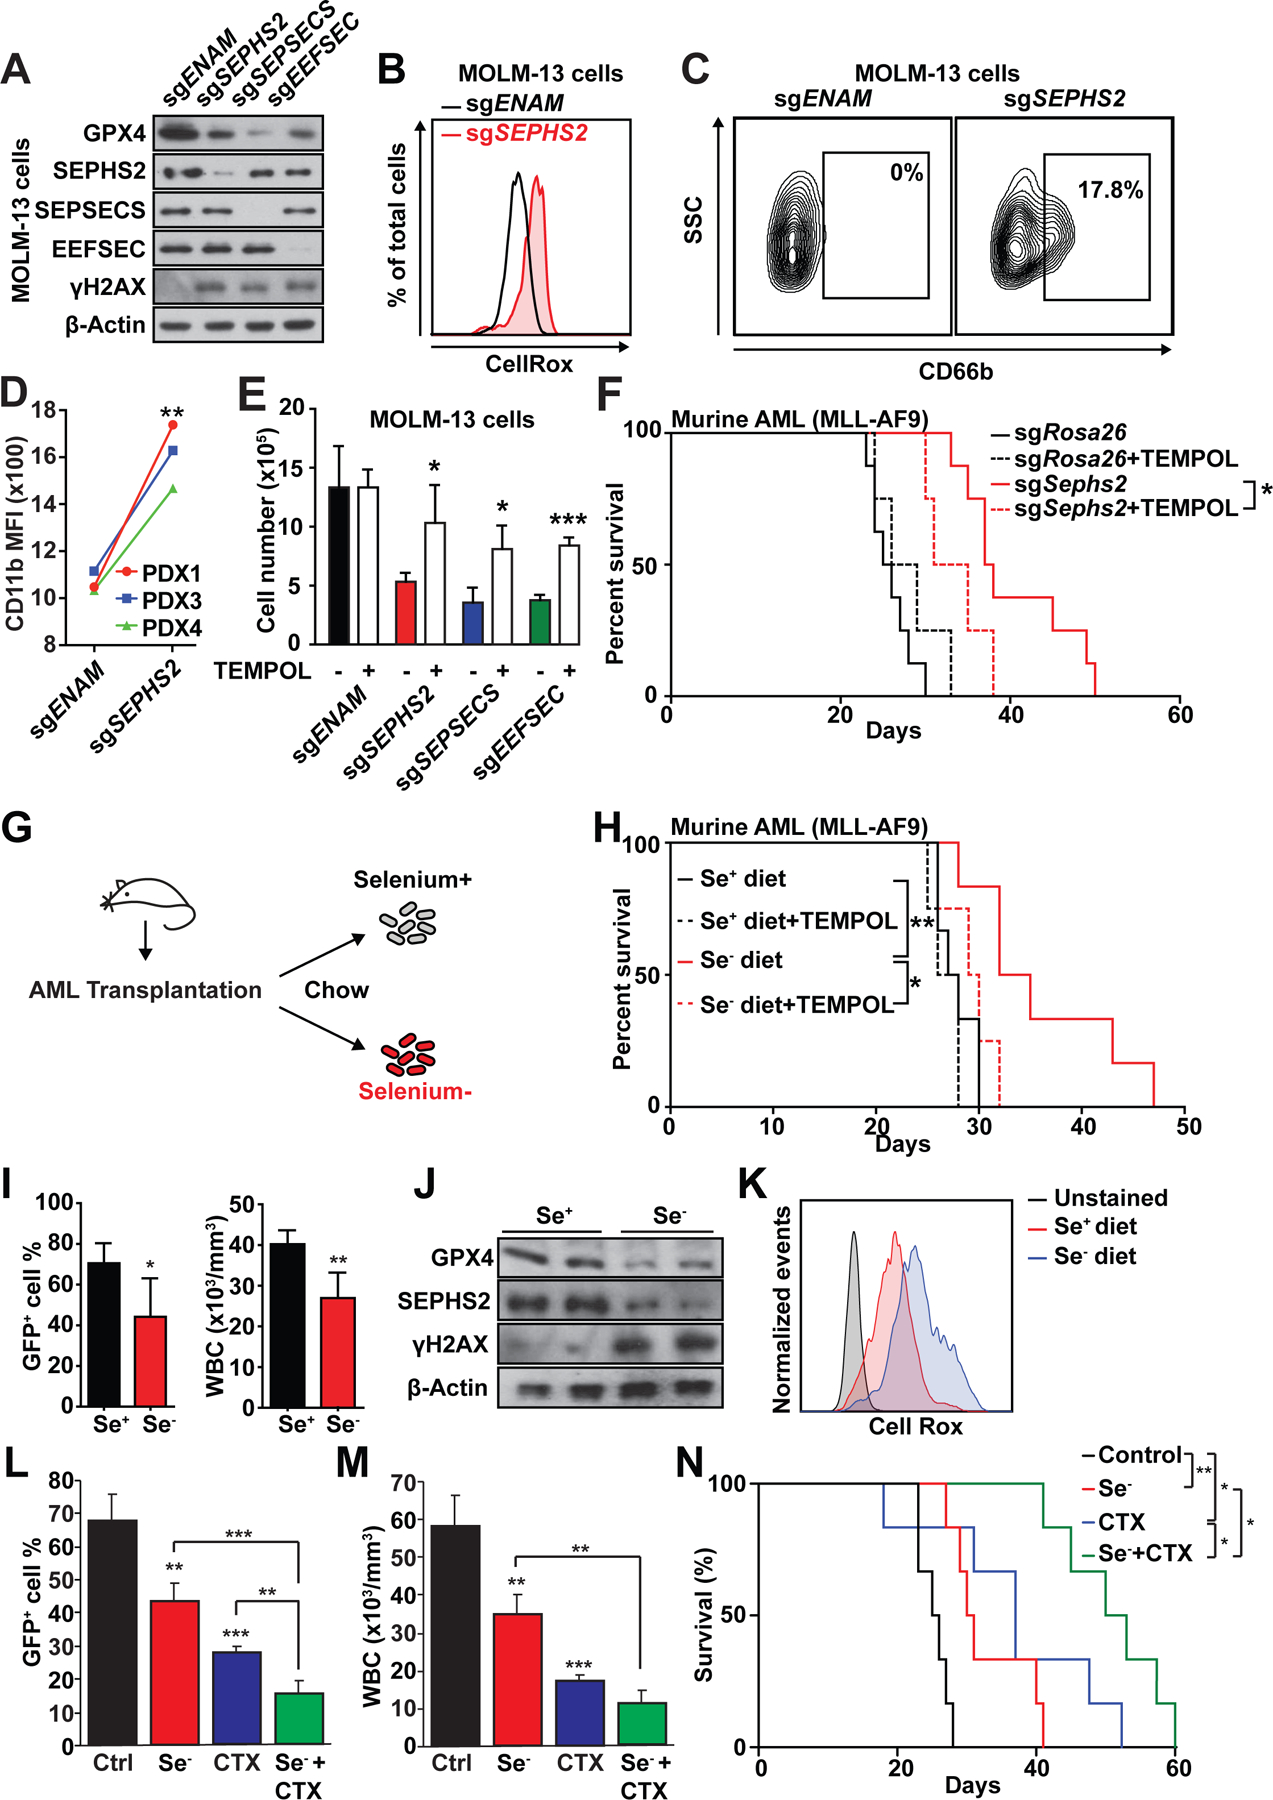
(A) Immunoblot of MOLM-13 cells after CRISPR mediated deletion of selenoprotein synthesis genes.
(B) Flow cytometry analysis of MOLM-13 cells stained with CellRox dye to detect oxidative stress.
(C-D) Flow cytometry analysis of the myeloid differentiation marker CD66b in MOLM-13 cells (C) or CD11b in three AML PDX cells (D) after deleting SEPHS2.
(E) Proliferation of MOLM-13 cells after CRISPR mediated deletion of selenoprotein synthesis genes, with or without TEMPOL supplementation in media (n=3). *, p<0.05; and ***, p<0.001 by one-way ANOVA.
(F) Survival of mice treated with TEMPOL after transplantation of Sephs2-deleted AML cells (n=4). Non-TEMPOL treated mice were the same cohort used in Fig. 2I. *, p<0.05 by log-rank test.
(G) Schematic illustration of the selenium-deficient diet feeding at day 1 post transplantation of AML cells.
(H) Survival of murine AML recipient mice fed with selenium proficient (Se+) or deficient (Se−) diet with either regular or TEMPOL supplemented water (n=6). Probability by log-rank test: *, p<0.05.
(I) Flow cytometry analysis of GFP+ AML cells in peripheral blood (left) and white blood cell count of the diseased mice at day 21 (n=3). *, p<0.05; **, p<0.01; by Student’s t-test.
(J) Immunoblotting of GFP+ AML cells from mice fed with selenium proficient or deficient diet.
(K) Flow cytometry analysis of CellRox stained GFP+ AML cells from mice fed with selenium proficient or deficient diet.
(L-N) Frequency of GFP+ AML cells in the blood (L), WBC cells (M), and survival (N) of recipient mice of MLL-AF9-induced AML cells treated with selenium-deficient diet and/or chemotherapy (CTX) (n=6). *, p<0.05; **, p<0.01; ***, p<0.001 by Student’s t-test in (L-M). *, p<0.05; **, p<0.01 by log rank test in (N). See also Figure S6.
Selenium dietary restriction phenocopies genetic selenoprotein pathway perturbation in AML
To quantitatively assess selenium dependency of AML cells, we first used serum-free media supplemented with increasing concentrations of selenite, a selenium oxoanion that is readily metabolized by cells. Proliferation of MOLM-13 cells increased in a manner depending on concentration of selenite supplementation (Fig. S6J). SEPHS2-, SEPSECS-, or EEFSEC-deficient MOLM-13 cells exhibited significantly blunted response to selenite supplementation and proliferated poorly in this defined media suggesting that incorporation of selenium into selenoprotein underlies the essentiality of metabolic selenium (Fig. S6K).
To assess in vivo selenium dependency, we fed AML recipient mice with a selenium-deficient diet starting one day after transplantation (Fig. 6G). AML recipient mice fed with selenium-deficient diet showed ameliorated leukocytosis, reduced leukemic burden, and significantly extended leukemia-free survival (Fig. 6H–I). Selenium-deficient diet also extended leukemia-free survival of Trp53-deficient AML, suggesting that selenium restriction may suppress highly aggressive AML (Fig. S6L). AML that developed in mice fed with selenium-deficient diet had reduced expression of GPX4, increased oxidative stress, and increased DNA damage, consistent with the role of selenium and selenoproteins to maintain redox homeostasis (Fig. 6J–K). Finally, attesting to the role of dietary selenium in suppressing oxidative stress, the impaired leukemogenesis in mice fed with selenium-deficient diet was significantly rescued by a co-administration of TEMPOL to mitigate oxidative stress (Fig. 6H). These results establish the dependency of AML on selenoprotein synthesis pathway and that management of oxidative stress can be targeted by depriving selenium from diet.
Our findings that selenium restriction promotes oxidative stress in AML raised the possibility that selenium-deficient diet may augment the effects of AML chemotherapies. To test this, we generated a cohort of AML recipient mice and treated them with either selenium-deficient diet, chemotherapy (5 days of cytarabine with 3 days of doxorubicin), or both. Single treatment of selenium-deficient diet or chemotherapy reduced GFP+ AML cells in the blood and ameliorated leukocytosis, as expected (Fig. 6L–M). The combination treatment further reduced AML cells in the blood and leukocytosis (Fig. 6L–M) and led to a significant extension of leukemia-free survival of recipient mice compared to single treatment groups (Fig. 6N). These results demonstrate that selenium restriction offers a strategy to augment the efficacy of chemotherapies by promoting oxidative stress in AML.
Discussion
In this study we identify the selenoprotein production pathway as a highly selective AML-specific dependency. Our data suggest that AML harbor a unique addiction to selenoprotein activity that is enabled by upregulation of selenoprotein synthesis via an AML-specific super enhancer adjacent to SEPHS2. As a consequence, targeting the selenoprotein production pathway, whether by inhibition of genes like SEPHS2 or by dietary restriction of selenium, is able to selectively block AML growth with modest effects on other cell types in vitro and no overt toxicity in vivo.
We and others have shown that AML stem cells are dependent on metabolic pathways that endow them with low oxidative stress state (Jones et al., 2018; Lagadinou et al., 2013; Saito et al., 2015). Our study unveils a mechanism in which an oncogenic enhancer drives the expression of a key selenoprotein to link dietary selenium to the redox regulator GPX4. Indeed, AML blasts uptake so much selenium that plasma selenium deficiency is an observed clinical sequela that is reversed upon induction chemotherapy (Beguin et al., 1989). These data suggest that AML are uniquely addicted to and dependent on selenoproteins.
We find that AML achieve upregulation of selenoprotein production via the super enhancer mediated transcriptional upregulation of SEPHS2. SEPHS2 enhancer mediated upregulation is specific to AML versus both other tumor types and normal hematopoiesis. This AML-specific super enhancer exhibits binding for many key oncogenic AML transcription factors, and we hypothesize that the specificity of this enhancer is a result of coordinated binding by the transcription factors that establish AML identity. This hypothesis is supported by evidence that MYB binds to the SEPHS2 super enhancer and directly regulates SEPHS2 expression. Our study, however, does not exclude the possibility that other cancers also upregulate SEPHS2, especially those that are dependent on MYB, such as colorectal or brain tumors (Ramsay and Gonda, 2008). More generally, by demarcating genes inextricably tied to tumor identity, these data suggest that mapping of tumor specific enhancers/super enhancers can find oncogenic pathways and dependencies that may not otherwise be associated with recurrent genetic alterations. We believe this approach can be extended to other tumor types, and that our identification of oncogenic enhancer regulation of SEPHS2 provides promising early proof of concept.
Finally, our work provides the rationale for targeting selenoprotein production in AML as a promising treatment modality with a mechanistic basis for an emergent therapeutic index. As an enzyme with few human homologs, SEPHS2 is an attractive candidate for selective small molecule inhibition. In the nearer term, dietary selenium restriction may improve outcomes by downregulating selenoprotein synthesis and also sensitizing blasts to chemotherapies whose activity is modulated by oxidative stress. Notably, in AML, resistance to arsenic trioxide can be overcome by glutathione depletion (Davison et al., 2003); glutathione is the reducing agent required by GPX4. An alternative strategy to target the vulnerability created by SEPHS2 inhibition in cancer was recently proposed, whereby SEPHS2-deleted cancer cells were found to be highly sensitive to selenide overdose (Carlisle et al., 2020). Although selenium is an essential nutrient, there is an incomplete understanding of minimal levels required in mammals. Mice placed on highly selenium-restricted diets (2% of normal chow) were able to propagate for three generations before reproductive defects emerged, and importantly these mice were completely resistant to pristane induced plasmacytoma formation (Felix et al., 2004). Recent study further demonstrated that mice placed on selenium-deficient diet (0 ppm) for the entire life exhibited no changes in lifespan (Yim et al., 2019). Healthy human males fed a low-selenium diet for 99 days showed no changes in their overall health or hematopoietic function (Hawkes et al., 2001). Regions of the world with naturally-low selenium diets see few health impacts other than for children and women of child-bearing age, neither of which make up a significant fraction of the AML patient group (Fordyce, 2013). The finding presented here that dietary selenium deprivation suppresses leukemogenesis, but not normal hematopoiesis, points to selenoprotein production as a deregulated and therapeutically actionable metabolic axis in AML.
Limitation of the study
One of the limitations in data-driven approaches that mine cell line data is that they are largely generated from cancer cell lines and that limited data are available for both non-cancerous and cancerous primary cells. Indeed, although this study identified the SEPHS2 enhancer to be highly activated in AML compared to other tumors, a large fraction of the data is derived from cancer cell lines. Thus, whether the SEPHS2 enhancer is not active in primary non-AML tumors remains to be experimentally validated. Additionally, some primary human hematopoietic cell types express SEPHS2 based on the limited data available, suggesting that either the specificity of the SEPHS2 enhancer on AML is not absolute and/or that other gene regulatory mechanisms may regulate SEPHS2 expression in hematopoietic cells. This study suggests that there is a therapeutic window to target SEPHS2 or the selenoprotein production pathway as an AML therapy. While we provide the proof-of-principle that suppressing selenoprotein production with a selenium-deficient diet can impair leukemogenesis, no drugs are available to our knowledge that directly targets SEPHS2 or other components in this pathway, and whether this pathway can be therapeutically targeted remains to be seen.
STAR METHODS
RESOURCE AVAILABILITY
Lead contact
Further information and requests for resources and reagents should be directed to and will be fulfilled by the Lead Contact, Daisuke Nakada, PhD (nakada@bcm.edu)
Materials availability
Plasmids generated in this study are available upon request. gRNA sequences used in this study are listed in Table S6. Sephs2 heterozygous mice are available from the MMRRC.
Data and code availability
All sequencing data used in this study is available from existing archives as listed in Table S1. Custom computer code supporting this paper can be found at https://app.box.com/s/5cw4lkggaxzbkiqu16dpk4wtdbaj99yq
EXPERIMENTAL MODEL AND SUBJECT DETAILS
Animal studies
C57BL/6J and B6.SJL-Ptprca Pepcb/BoyJ (CD45.1) mice (8–12 weeks of age) were used for murine AML and bone marrow transplantation assays, respectively. Sephs2em1(IMPC)Mbp mice were obtained from the Mutant Mouse Resource and Research Centers (MMRRC) and were backcrossed to the C57BL/6J background. NOD.Cg-Prkdcscid Il2rgtm1Wjl Tg(CMV-IL3,CSF2,KITLG)1Eav/MloySzJ (Wunderlich et al., 2010) (NSG-SGM3, 8–12weeks of age) mice were used for transplanting human cells. Mice were housed in AAALAC-accredited, specific-pathogen-free animal care facilities at Baylor College of Medicine (BCM). Selenium-deficient diet and selenium supplemented diet were purchased from BioServ. Cytarabine was administered at a dose of 100mg/kg intraperitoneally for 5 days. Doxorubicin was administered at a dose of 3mg/kg intraperitoneally for 3 days. Both chemotherapy treatments were initiated 7 days after transplantation. All procedures were approved by BCM Institutional Animal Care and Use Committees.
Murine AML:
The pMIG-MLL-AF9 plasmid was described previously (Saito et al., 2015). pMIG-MLL-AF9-3xTy1 was generated by cloning a linker containing 3xTy1 sequence. 293T cells were transiently transfected with MSCV vectors with pCL-Eco plasmid using polyethylenimine (PEI). Hematopoietic stem and progenitor cells (Lin−c-kit+Sca-1+) were sorted and incubated in X-Vivo 15 (Lonza, Allendale, NJ) supplemented with 50 ng/ml SCF, 50 ng/ml TPO, 10 ng/ml IL-3 and 10 ng/ml IL-6 (all from Peprotech, Rocky Hill, NJ) for 24 hours. After incubation, cells were spin-infected with retroviral supernatant supplemented with polybrene (8 μg/ml) in retronectin (Clontech, Mountain View, CA) coated plates at 600g for 30 min at 20 °C. 50,000 cells were transplanted into lethally irradiated C57BL/6 mice. For secondary transplantations, 105 GFP+ cells from primary recipient mice were transplanted into sublethally irradiated (650cGy) recipients. For limiting dilution transplantation, 100 or 1,000 AML cells were transplanted into sublethally irradiated recipients.
Human studies
Human AML samples with a t(9;11) translocation (creating MLL-AF9 fusion) or a FLT3-ITD mutation were collected under LAB01-473 protocol in MD Anderson (Han et al., 2017; Jiang et al., 2018). PDX3 (MDA13) and PDX4 (MDA14) were previously described (Hu et al., 2019). NSG-SGM3 mice were sublethally irradiated (250 cGy) and transplanted with 105 cells as previously described (29). All procedures involving the use of human samples were approved by the BCM IRB committee (Protocol H-43877).
Cell lines and cell culture
MOLM-13, THP-1, Kasumi-1, K562, NB4, KCL22, Ku812 and U266B1 cell lines were cultured in RPMI1640 with 10% FBS and 1% Penicillin-Streptomycin (all from ThermoFisher, Waltham, MA). HL-60 cells were cultured in IMDM with 20% FBS and 1% Penicillin-Streptomycin. OCI-AML2 cells were cultured in αMEM with 10% FBS and 1% Penicillin-Streptomycin. HEK293T and HeLa cell lines were cultured in DMEM with 10% FBS and 1% Penicillin-Streptomycin (all from ThermoFisher, Waltham, MA). PDX and cord blood cells were cultured in StemSpan SFEM media supplemented with CD34+ Expansion Supplement (both from Stemcell Technologies, Cambridge, MA). Mouse AML cells and cKit+ bone marrow cells were sorted and cultured in in X-Vivo 15 (Lonza, Allendale, NJ) supplemented with 50 ng/ml SCF, 50 ng/ml TPO, 10 ng/ml IL-3 and 10 ng/ml IL-6 (all from Peprotech, Rocky Hill, NJ).
METHOD DETAILS
Competitive bone marrow transplantation
5×10⁵ experimental bone marrow cells were mixed with 5×10⁵ competitor bone marrow cells (CD45.1) and transplanted retro-orbitally into lethally irradiated (10 Gy) CD45.1 recipient mice. Peripheral blood was collected from recipient mice at the indicated time point after transplantation and donor chimerism was assessed in Mac-1+ myeloid cells, B220+ B-cells, and CD3+ T-cells within CD45.2+ cells by flow cytometry.
CRISPR gene disruption
sgRNAs were designed using http://crispor.tefor.net/ and the sequences are listed in Table S6. sgRNA was cloned with a T7 promoter sequence and transcribed using the HiScribe™ T7 In Vitro Transcription Kit (NEB, Ipswich, MA). Cas9-sgRNA complex was introduced to cells as previously described (Gundry et al., 2016; Shi et al., 2018). The sgRNA pair targeting the SEPHS2 enhancer deletes a 468 bp fragment at chr.16 30,470,038 to 304,70,505 (hg19).
TEMPOL treatment
Antioxidant TEMPOL (1mM supplemented in drinking water) was given to mice at day 1 post transplantation through the entire course.
Flow cytometry
Cultured cells, peripheral blood cells and bone marrow cells were used for flow cytometry. Bone marrow cells were flushed from long bones (tibias and femurs) in Hank’s buffered salt solution (HBSS) without calcium and magnesium, supplemented with 2% heat-inactivated bovine serum (Gibco, Grand Island, NY). Cells were triturated and filtered through nylon screen (100μm, Sefar America, Kansas City, MO) to obtain a single-cell suspension. Antibodies for flowcytometry were purchased from Thermo Fisher. To stain for mature human AML cells, cells were incubated with CD66b (G10F5), CD33 (WM53), or CD11b (1CRF44). To stain for mature mouse AML cells, cells were incubated with Mac-1 (M1/70) and Gr-1 (RB6–8C5). To stain for ROS, cells were incubated with DCF-DA (Thermo Fisher, Cat # D399) or Cell Rox (Thermo Fisher, cat C10422) in PBS at 37 °C for 15min.
BrdU and Annexin V staining
10 μM BrdU (Sigma, St. Louis, MO) was added into cell culture media 6 hours prior to staining. BrdU and Annexin V staining was performed using kit purchased from BD biosciences (cat 552598 and 550475) according to manufacturer’s instructions.
Western blotting
Cells or tissues were homogenized and incubated with 10% TCA on ice for 10min before centrifugation. Pellets were washed with acetone and air dried. Urea solubilization buffer was added to dissolve protein pellets. Proteins were separated on a Bis-Tris polyacrylamide gel (Life Technologies) and transferred to a PVDF membrane (Millipore, Billerica, MA). Antibodies used for western blotting include α-SEPHS2 (Thermo Fisher, clone PA5–27950), α-SEPSECS (Abcam, cat ab56033), α-EEFSEC (Thermo Fisher, clone PA5–31764), α-GPX4 (Thermo Fisher, PA5–79321), α-SEPHS1 (Santa Cruz, sc-365945), α-MYB (Abcam, ab117635), α-γ-H2AX (CST, clone 20E3), α-β-Actin (Sigma, clone AC-74).
Giemsa Staining
25,000 Cells were spun down onto glass slides using StatSpin Cytofuge (Beckman Coulter, Atlanta, GA) at 1000rpm for 2min. Slides were airdried and then proceeded to Giemsa staining according to manufacturer’s instructions (Sigma, St. Louis, MO).
Selenium deficient diet
Selenium deficient diet was purchased from Bio Serv (item NO. S7738, Flemington, NJ). Control diet (item NO. S7739, Bio Serv, Flemington, NJ) was made by adding selenite in the deficient diet to a final selenium concentration of 0.18 mg/kg. Diet was started at day 1 post transplantation through the entire course of the study.
ELISA
Mouse serum was collected and diluted 50 times before performing SEPP1 ELISA using the SEPP1 ELISA kit (G-Biosciences, St. Louis, MO) according to manufacturer’s instructions.
H3K27ac ChIP-seq processing
The H3K27ac ChIP-seq data was sourced as indicated in Table S1. All files were processed following the guidelines of ENCODE (phase-3) using the AQUAS pipeline (https://github.com/kundajelab/chipseq_pipeline). The AQUAS pipeline aligned all reads to the human reference genome hg19/GRCh37 using BWA (Li and Durbin, 2009). Low-quality, duplicate, multimapping, unmapped reads, and reads mapping to the mitochondrial genome were filtered. Peak finding was performed by the AQUAS pipeline using MACS2 with a P-value threshold of 1 × 10⁻⁵. The AQUAS pipeline also determined quality control measures such as mapping statistics, enrichment, library complexity (PCR bottlenecking coefficients PBC1 and PBC2), cross-correlation scores, and fraction of reads in the peaks as defined by ENCODE data standards (https://www.encodeproject.org/chip-seq/histone/). Primary H3K27ac ChIP-seq samples with PBC1 ≥0.5, total mapped reads ≥10 million, and MACS2 peaks ≥5,000 were included in analysis. H3K27ac ChIP-seq cell line samples with PBC1 ≥0.5, alignment rate ≥70%, and MACS2 peaks ≥10,000 were included in analysis.
Enhancer activity
H3K27ac typical enhancers (TEs) and super enhancers (SEs) in individual samples were mapped using the ROSE2 software package (available at https://github.com/BradnerLab/pipeline) (Loven et al., 2013; Whyte et al., 2013). The ROSE2 program was used with default parameters, except peaks found in the ENCODE (Consortium, 2012) blacklist (https://sites.google.com/site/anshulkundaje/projects/blacklists) were excluded.
Total enhancer activity for each sample was aggregated to allow normalization of enhancer activity across samples. Consensus AML SEs were determined by finding overlapping SEs from the individual AML samples listed in Table S1. Genes associated with any component SE were linked to the aggregated consensus SE. Table S3 contains the resulting consensus SE locations and all associated genes. H3K27ac activity was mapped to consensus AML SEs using bamliquidator (https://github.com/BradnerLab/pipeline/wiki/bamliquidator) as called in the function pipeline_dfci.map_regions found in the Lin lab utilities pipeline (https://github.com/BradnerLab/pipeline/blob/master/pipeline_dfci.py). For each SE, we extracted H3K27ac area under the curve in each sample and normalized by total H3K27ac across all the consensus AML SEs in that sample to yield a normalized enhancer signal.
Characterizing AML genetic dependencies
For Fig. 1B, 1C, and Supplementary Fig. S1D, we restricted gene populations to those with a median CERES Avana dependency score of −0.25 or less across the CERES Avana AML cell lines; this ensured that our potential gene pool showed lethality in AML cell lines. We also eliminated any gene with median mRNA values of less than 0.05 (log2 of TPM+1) across the CCLE AML cell lines, to ensure that the genes were actually expressed in AML. Fig. 1A only used the mRNA filtering.
Definition of gene cohorts by enhancer association status (Fig. 1A–C)
Genes without SEs in Fig. 1A were taken as all genes in the CERES Avana dataset that were not associated with an SE as described above and that passed gene screening for mRNA expression. Top SE genes in Fig. 1A were those SE-associated genes with the largest median H3K27ac activity across the AML samples in Table S1. Genes without SEs in Fig. 1B were those remaining from Fig. 1A after screening for median CERES Avana dependency as described above. SE-associated genes for Fig. 1B were first screened for median CERES Avana dependency and mRNA; all of these genes with log2 fold enhancer specificity < 1.0 are shown as “Non-AML specific”, while genes with log2 fold enhancer specificity >= 2.0 are shown as “AML specific”. Fig. 1C includes all SE-associated genes after screening for both median CERES Avana dependency and mRNA; this group is split into the third with the highest median normalized enhancer signal (“Top SE genes”) and the remainder (”Other genes”).
Calculating and visualizing enhancer specificity (AML vs. non-AML) for each gene (Fig. 1F and Fig. S1E)
For each consensus SE, we aggregated the normalized enhancer signals across all the AML samples listed in Table S1 and separately across all the non-AML samples in Table S1. We compared these populations using two tests. First, a one-sided Wilcoxon rank-sum test was used to determine the probability that the AML samples were from a population with higher normalized enhancer signal compared to the non-AML samples. Second, we calculated the fold change by dividing the median of the AML population by the median of the non-AML population. All genes associated with an SE were assigned the same enhancer specificity for that SE. For genes only associated with a single SE, that SE’s specificity was used for that gene; where genes were associated with more than one SE, we chose the largest SE by H3K27ac activity and assigned that SE’s specificity to the gene.
For each gene, we aggregated the normalized enhancer signals across all the AML samples listed in Table S1, sorted them in ascending order, and plotted the results on the y-axis against one through the number of samples on the x-axis; a point was added at (0,0) to anchor the curve. This process was repeated for each of the cancer types in Table S1, excepting those with only one or two samples. An additional curve was generated using all the “normal” samples in Table S1. The non-AML curves were averaged into a combined non-AML curve using all the points from the above single-cancer curves and doing a local polynomial regression fit using the loess() R routine with default parameters except for a span=0.2.
Correlating MYB enhancer occupancy with target gene expression (Fig. 3F–G and Supplementary Fig. S3J)
MYB area under curve (AUC) vs. mRNA expression was based on six ChIP-seq samples (Table S5) downloaded from the GEO database at accession number GSE94240. Corresponding gene mRNA expression data was found in file “GSE94241_Table_HTseq_MYBMIM_TG3_Control.txt” from GSE94241. We identified MYB binding peaks for each sample within each gene’s AML consensus super enhancer, assuming a background MYB signal of 1.34. MYB peak locations were identified in each of the six samples, and then aggregated across the six samples into consensus peak locations by finding overlaps. The AUC for the MYB consensus peaks was calculated for all six samples by simple rectangle integration; in the case of multiple peaks within a single AML consensus SE, the largest peak by AUC (mean AUC across the six samples) was retained. The resulting MYB peak AUC for the six samples was then correlated to gene mRNA expression in the same samples (Pearson correlation coefficient) using the cor() function in R; any genes with mean mRNA less than 10 across the three control samples were eliminated.
TCGA Survival and Cox Proportional Hazards Analysis (Fig. 2A,B)
mRNA data for the TCGA-LAML project was accessed using the TCGAbiolinks (Colaprico et al., 2016) R routine GCDQuery with parameters data.category = “Transcriptome Profiling”, data.type=“Gene Expression Quantification”, and workflow.type=“HTSeq - FPKM”. Clinical data was accessed through GCDQuery with parameter data.category=”Clinical”. From the clinical data files, we accessed Dead/Alive status from “clin_shared:vital_status” and days_to_death or days_to_last_followup for survival data. For the non-mRNA hazards, the fields “molecular analysis abnormality” and “cytogenetic abnormality” were accessed from the same clinical files.
mRNA analysis of AML subtype and SEPHS2 expression (Fig. 2C, D, Fig. S2A)
TCGA RNA-seq and clinical data were downloaded from project TCGA-LAML as described above, Beat AML (Tyner et al., 2018), and Verhaak et al (Verhaak et al., 2009). FLT3 and NPM1c mutation status were extracted from the clinical datafiles. Aggregates were compared using a Wilcoxon rank-sum test. Verhaak data and metadata were accessed from GSE6891; expression data was accessed from GSE6891 using Geo2R with ID# 200961_at and compared using Wilcoxon rank-sum tests.
ATAC-seq analysis (Fig. 2E, F)
Raw fastq files were downloaded from GSE74912 and processed through an internal version of the Kundaje Lab ATAC-seq pipeline (https://github.com/kundajelab/atac_dnase_pipelines), including the primary steps of alignment (Bowtie2), quality control, and peak calling with MACS2. Samples were eliminated if the fraction of reads in peaks was less than 0.2 or percentage of mapped reads was less than 70%. Super-enhancers were determined using ROSE2, and aggregated to consensus SEs across the samples as described above. Peaks were remapped to the consensus SEs to determine enhancer activity, and normalized using total sample activity. ATAC-seq metatracks (Fig. 2E) were created using bamPlot (https://github.com/BradnerLab/).
Normalized chromatin accessibility (Fig. 2F)
ATAC-seq samples from GSE74912 (Corces et al. 2016) were processed as discussed under “ATAC-seq analysis”, then re-mapped to consensus AML super-enhancers and normalized as discussed for H3K27ac samples under “Enhancer activity”. Normalized activity was aggregated by cell type and plotted using R/boxplot with default parameters.
mRNA analysis of AML vs. normal hematopoietic cells (Fig. 2G)
RNA-seq counts were downloaded from GSE74246 and converted to FPKM using transcript lengths acquired through the Bioconductor package “biomaRt” (Durinck et al., 2009; Huber et al., 2015). Samples were aggregated by cell type using metadata; aggregates were compared with a one-sided Wilcoxon rank-sum test.
Depmap.org data
CERES Avana dependency (“gene_effect_corrected.csv”), CCLE mRNA expression (“CCLE_depMap_19Q1_TPM.csv”), and associated lineage information were downloaded from depmap.org on 3/2/19.
QUANTIFICATION AND STATISTICAL ANALYSIS
Statistics were determined with a paired Student’s t test, ANOVA, Wilcoxon rank-sum test, or log-rank test with Prism software (GraphPad) or R (version 3.5.1). Group data always represent mean ± standard deviation. No randomization or blinding was used in any experiment. Experimental mice were not excluded from analysis in any experiment. Sample sizes were selected based on previous experience with the degree of variance in each assay.
Supplementary Material
Table S1. ChIP-seq sample identification and quality control results; related to STAR Methods. ChIP-seq sample identification, data sources, and quality control scores.
Table S2. Superenhancer-associated genes; related to STAR Methods. This table identifies the location of the AML consensus super enhancer associated with each expressed gene and the enhancer specificity results for that enhancer. It also includes the median CERES Avana dependency score and median CCLE mRNA across AML and non-AML cell lines for each gene.
Table S3. AML Consensus Superenhancers; Related to STAR Methods. Location of consensus AML super enhancers and identification of all genes associated with each super enhancer.
Table S6. Oligonucleotides used in the study; Related to STAR Methods. This table list the nucleotides used in the study as sgRNA sequences or for PCR.
KEY RESOURCES TABLE
| REAGENT or RESOURCE | SOURCE | IDENTIFIER |
|---|---|---|
| Antibodies | ||
| Anti-Mouse CD2 (PE conjugated) | Biolegend | Clone: RM2–5; RRID: AB_2073690 |
| Anti-Mouse CD3 (PE conjugated) | Biolegend | Clone: 145–2C11; RRID: AB_312673 |
| Anti-Mouse CD8 (PE conjugated) | Biolegend | Clone: 53–6.7; RRID: AB_312747 |
| Anti-Mouse B220 (PE conjugated) | Biolegend | Clone: RA3–6B2; RRID: AB_312993 |
| Anti-Mouse Ter119 (PE conjugated) | Biolegend | Clone: TER-119; RRID: AB_313709 |
| Anti-Mouse Mac1 (PE conjugated) | Biolegend | Clone: M1/70; RRID: AB_312791 |
| Anti-Mouse Gr-1 (PE conjugated) | Biolegend | Clone: RB6–8C5; RRID: AB_313373 |
| Anti-Mouse c-kit/CD117 (APC-Cy7 conjugated) | Biolegend | Clone: 2B8; RRID: AB_1626278 |
| Anti-Mouse c-kit/CD117 (Biotin conjugated) | eBioscience | Clone: 2B8; RRID: AB_466569 |
| Anti-Mouse Sca-1 (APC conjugated) | Biolegend | Clone: E13–161.7; RRID: AB_756197 |
| Anti-Mouse CD127 (PE conjugated) | Biolegend | Clone: A7R34; RRID: AB_1937251 |
| Anti-Mouse CD135 (PE-Cy5 conjugated) | Biolegend | Clone: A2F10; RRID: AB_2263031 |
| Anti-Mouse CD48 (PE-Cy7 conjugated) | Biolegend | Clone: HM48–1; RRID: AB_2075049 |
| Anti-Mouse CD150 (PE-Cy5 conjugated) | Biolegend | Clone:TC15–12F12.2; RRID: AB_493598 |
| Anti-Mouse CD16/32 (PE-Cy7 conjugated) | eBioscience | Clone: 93; RRID: AB_469598 |
| Anti-Mouse CD11b (APC conjugated) | Biolegend | Clone: M1/70; RRID: AB_312795 |
| Anti-Mouse CD45.1 (APC-Cy7 conjugated) | Biolegend | Clone: A20; RRID: AB_313505 |
| Anti-Mouse CD45.2 (AF700 conjugated) | eBioscience | Clone: 104; RRID: AB_657752 |
| Anti-Mouse CD34 (eFluor660 conjugated) | eBioscience | Clone: RAM34; RRID: AB_10596826 |
| Anti-Mouse Sca-1 (PerCP-Cy5.5 conjugated) | eBioscience | Clone: D7; RRID: AB_914372 |
| Anti-Mouse B220 (PE-Cy5 conjugated) | eBioscience | Clone: RA3–6B2; RRID: AB_469721 |
| Anti-Human CD45 (APC conjugated) | Biolegend | Clone: HI30; RRID: AB_314400 |
| Anti-Human CD11b (APC conjugated) | Biolegend | Clone: ICRF44; RRID: AB_314162 |
| Anti-Human CD66b (PE-Cy7 conjugated) | eBiosciences | Clone: G10F5; RRID: AB_2573360 |
| Anti-Human CD33 (APC conjugated) | eBiosciences | Clone: WM53; RRID: AB_314352 |
| Streptavidin (APC-Cy7 conjugated) | BD Biosciences | Cat # 554063; RRID: AB_10054651 |
| Anti-Biotin microbeads | Miltenyi Biotec | Cat # 130-090-485; RRID: AB_244365 |
| H2DCFDA | Thermo Fisher | Cat # D399 |
| Cell Rox | Thermo Fisher | Cat # C10422 |
| BrdU | BD biosciences | Cat # 552598; RRID: AB_2861367 |
| Annexin V | BD biosciences | Cat # 550475; RRID: AB_2868885 |
| α-SEPHS2 | Thermo Fisher | Cat # PA5–27950; RRID: AB_2545426 |
| α-SEPHS1 | Santa Cruz | Cat # sc-365945; RRID: AB_10917408 |
| α-SEPSECS | Abcam | Cat # ab56033; RRID: AB_2186856 |
| α-EEFSEC | Thermo Fisher | Cat # PA5–31764; RRID: AB_2549237 |
| α-GPX4 | Thermo Fisher | Cat # PA5–79321; RRID: AB_10982478 |
| α-γ-H2AX | Cell Signaling | Cat # 9718; RRID: AB_2118009 |
| α-MYB | Abcam | Cat # ab117635; RRID: AB_10900735 |
| Anti-Histone H3 (acetyl K27) | Abcam | Cat# ab4729; RRID: AB_2118291 |
| α-PU1 | Cell Signaling | Cat # 2266S; RRID: AB_10692379 |
| α-RUNX1 | Abcam | Cat # ab35962; RRID: AB_2269981 |
| α-FLAG (M2) | Sigma Aldrich | Cat # F1804; RRID: AB_262044 |
| α-β-Actin | Sigma Aldrich | Cat # A2228; RRID: AB_476697 |
| Biological samples | ||
| AML PDX1 | Han et al. 2017 | N/A |
| AML PDX2 | Jiang et al. 2018 | #23 |
| AML PDX3 | Hu et al. 2019 | MDA13 |
| AML PDX4 | Hu et al. 2019 | MDA14 |
| Chemicals, peptides, and recombinant proteins | ||
| TRIzol | Thermo Fisher | Cat # 15596026 |
| Cas9 protein with NLS | PNA Bio | Cat # CP02 |
| Lipofectamine 2000 | Thermo Fisher | Cat # 11668027 |
| Dimethyl sulfoxide (DMSO) | Sigma Aldrich | Cat# 472301 |
| 4’,6-diamidino-2-phenylindole (DAPI) | Thermo Fisher | Cat# D1306 |
| Selenium-deficient diet | BioServ | Cat # S7738 |
| Selenium supplemented diet | BioServ | Cat # S7739 |
| Recombinant Murine SCF | Peprotech | Cat # 250–03 |
| Recombinant Murine TPO | Peprotech | Cat # 315–14 |
| Recombinant Murine IL-3 | Peprotech | Cat # 213–13 |
| Recombinant Murine IL-6 | Peprotech | Cat # 216–16 |
| Recombinant human FLT3 ligand | Peprotech | Cat # 300–19 |
| Recombinant human G-CSF | Peprotech | Cat # 300–23 |
| Recombinant human IL-3 | Peprotech | Cat # 200–03 |
| Recombinant human SCF | Peprotech | Cat # 300–07 |
| Retronectin | Clontech | Cat # T100B |
| Antioxidant TEMPOL | Sigma Aldrich | Cat # 176141 |
| Sodium Selenite | Sigma Aldrich | Cat# 214485 |
| Critical commercial assays | ||
| HiScribe™ T7 In Vitro Transcription Kit | NEB | Cat # E2040S |
| Giemsa staining reagent | Sigma Aldrich | Cat # WG32–1L |
| CellTiter 96 Aqueous One Solution Cell Proliferation Assay | Promega | Cat # G3580 |
| Neon Transfection System 10 μL Kit | Thermo Fisher | Cat # MPK1096 |
| SEPP1 ELISA kit | G-Biosciences | Cat # IT5364 |
| KAPA HiFi HotStart Ready Mix (2X) | KAPA Biosystem | Cat # KK2601 |
| SuperSignal West Pico PLUS Chemiluminescent Substrate | Thermo Fisher | Cat # 34580 |
| X-Vivo 15 | Lonza | Cat # 04–418-Q |
| RPMI1640 | Gibco | Cat # 61870–036 |
| αMEM | Gibco | Cat # 32571–036 |
| DMEM | Gibco | Cat # 10566–016 |
| IMDM | Gibco | Cat # 12440053 |
| StemSpan SFEM | Stemcell Technologies | Cat # 09600 |
| CD34+ Expansion Supplement | Stemcell Technologies | Cat # 02691 |
| MethoCult M3234 | Stemcell Technologies | Cat # 03234 |
| Hank’s buffered salt solution (HBSS) | Gibco | Cat # 14185–052 |
| Heat-inactivated bovine serum | Gibco | Cat # 26170–043 |
| Fetal bovine serum (FBS) | Gibco | Cat # 26140–079 |
| Experimental models: Cell lines | ||
| MOLM-13 | Laboratory of Margaret Goodell | NA |
| THP-1 | Laboratory of Margaret Goodell | NA |
| Kasumi-1 | Laboratory of Daniel Lacorazza | NA |
| NB4 | Laboratory of Daniel Lacorazza | NA |
| KCL22 | Laboratory of Daniel Lacorazza | NA |
| Ku812 | Laboratory of Daniel Lacorazza | NA |
| OCI-AML2 | Laboratory of Margaret Goodell | NA |
| HEK293T | ATCC | CRL-3216; RRID: CVCL_0063 |
| K562 | ATCC | CCL-243; RRID: CVCL_0004 |
| HL-60 | Laboratory of Rachel Rau | NA |
| MCF7 | ATCC | HTB-22; RRID: CVCL_0031 |
| U266 | ATCC | TIB-196; RRID: CVCL_0566 |
| HeLa | ATCC | CCL-2; RRID: CVCL_0030 |
| Experimental models: Organisms/strains | ||
| CD45.1 (B6.SJL-Ptprca Pepcb/BoyJ) | The Jackson Laboratory | RRID: IMSR_JAX:002014 |
| CD45.2 (C57BL/6J) | The Jackson Laboratory | RRID: IMSR_JAX:000664 |
| NOD.Cg-Prkdcscid Il2rgtm1Wjl Tg(CMV-IL3,CSF2,KITLG)1Eav/MloySzJ (NSG-SGM3) | The Jackson Laboratory | RRID: IMSR_JAX:013062 |
| Sephs2em1(IMPC)Mbp mice | Mutant Mouse Resource and Research Centers (MMRRC) | RRID: MMRRC_043991-UCD |
| Oligonucleotides | ||
| See Table S6 | ||
| Recombinant DNA | ||
| pMIG-MLL-AF9 | Saito et. al. | RRID: Addgene_71443 |
| pMIG-MOZ-TIF2 | Laboratory of Issay Kitabayashi (Aikawa et al.) | N/A |
| pCL-Eco (retroviral packaging) | Addgene | RRID: Addgene_12371 |
| pMIG-flag-MYB | This paper | N/A |
| Software and algorithms | ||
| GraphPadPrism 6.0 | GraphPad | N/A |
| FlowJo 10.7 | Tree Star Inc. | N/A |
| CRISPOR | Jean-Paul et at. | http://crispor.org |
| R | Bioconductor | https://www.r-project.org/ |
| MACS2 | Laboratory of X. Shirley Liu (Zhang et al.) | https://pypi.org/project/MACS2/ |
Highlights.
Genetic dependency and enhancer landscape data identify SEPHS2 as an AML regulator
MYB is bound to the SEPHS2 enhancer and upregulates SEPHS2 expression in AML
SEPHS2 promotes selenoprotein production and prevents oxidative stress in AML
Inhibiting selenoprotein production by diet suppresses AML but not hematopoiesis
Acknowledgements
This project was supported by the Cytometry and Cell Sorting Core at Baylor College of Medicine including the expert assistance of Joel M. Sederstrom. We thank Luka Ausec (Genialis Inc.) for assistance in software development and data assembly.
Financial Support:
C.Y.L and D.N. are CPRIT Scholars in Cancer Research (RR150093 for C.Y.L. and R1201 for D.N.). C.Y.L. was a Pew-Stewart Scholar for Cancer Research (Alexander and Margaret Stewart Trust) and was supported by the NIH (R01CA215452). D.N. is a Scholar of the Leukemia and Lymphoma Society and is supported by the NIH (R01CA193235 and R01CA255813). K.E. and J.V.K. were supported by CPRIT (RR150093). X.S. is a Special Fellow of the Leukemia and Lymphoma Society. M.W.P. was supported by the NIH and NCI (R01CA21545S). Y.J. was supported by NIH (T32DK060445) and CPRIT (RP160283). T. H. was supported by CPRIT (RP160283). J.S.Y. is an Alex’s Lemonade Stand Foundation Center of Excellence Developmental Therapeutics Scholar and is supported by the NIH K12 Clinical Pharmacology Faculty Fellowship. This project was supported by the Cytometry and Cell Sorting Core at Baylor College of Medicine with funding from the CPRIT Core Facility Support Award (CPRIT-RP180672) and the NIH (P30 CA125123 and S10 RR024574).
Footnotes
Publisher's Disclaimer: This is a PDF file of an unedited manuscript that has been accepted for publication. As a service to our customers we are providing this early version of the manuscript. The manuscript will undergo copyediting, typesetting, and review of the resulting proof before it is published in its final form. Please note that during the production process errors may be discovered which could affect the content, and all legal disclaimers that apply to the journal pertain.
Declaration of Interests: C.Y.L. is an executive and shareholder of Kronos Bio and has licensed intellectual property to Syros Pharmaceuticals. K.E. has applied for a patent entitled “Method of Inducing Therapeutic Selenium Deficiency.”
References:
- Aikawa Y, Katsumoto T, Zhang P, Shima H, Shino M, Terui K, Ito E, Ohno H, Stanley ER, Singh H, et al. (2010). PU.1-mediated upregulation of CSF1R is crucial for leukemia stem cell potential induced by MOZ-TIF2. Nat Med 16, 580–585, 581p following 585. [DOI] [PMC free article] [PubMed] [Google Scholar]
- Beguin Y, Bours V, Delbrouck JM, Robaye G, Roelandts I, Bury J, Fillet G, and Weber G (1989). Relationship of serum selenium levels to tumor activity in acute non-lymphocytic leukemia. Carcinogenesis 10, 2089–2091. [DOI] [PubMed] [Google Scholar]
- Brown JD, Lin CY, Duan Q, Griffin G, Federation A, Paranal RM, Bair S, Newton G, Lichtman A, Kung A, et al. (2014). NF-kappaB directs dynamic super enhancer formation in inflammation and atherogenesis. Mol Cell 56, 219–231. [DOI] [PMC free article] [PubMed] [Google Scholar]
- Brunetti L, Gundry MC, Sorcini D, Guzman AG, Huang YH, Ramabadran R, Gionfriddo I, Mezzasoma F, Milano F, Nabet B, et al. (2018). Mutant NPM1 Maintains the Leukemic State through HOX Expression. Cancer Cell 34, 499–512 e499. [DOI] [PMC free article] [PubMed] [Google Scholar]
- Cancer Genome Atlas Research, Ley N, Miller TJ, Ding C, Raphael L, Mungall BJ, Robertson AJ, Hoadley A, Triche K, T.J. Jr., P.W Laird., et al. (2013). Genomic and epigenomic landscapes of adult de novo acute myeloid leukemia. N Engl J Med 368, 2059–2074. [DOI] [PMC free article] [PubMed] [Google Scholar]
- Carlisle AE, Lee N, Matthew-Onabanjo AN, Spears ME, Park SJ, Youkana D, Doshi MB, Peppers A, Li R, Joseph AB, et al. (2020). Selenium detoxification is required for cancer-cell survival. Nat Metab 2, 603–611. [DOI] [PMC free article] [PubMed] [Google Scholar]
- Chapuy B, McKeown MR, Lin CY, Monti S, Roemer MG, Qi J, Rahl PB, Sun HH, Yeda KT, Doench JG, et al. (2013). Discovery and characterization of superenhancer-associated dependencies in diffuse large B cell lymphoma. Cancer cell 24, 777–790. [DOI] [PMC free article] [PubMed] [Google Scholar]
- Colaprico A, Silva TC, Olsen C, Garofano L, Cava C, Garolini D, Sabedot TS, Malta TM, Pagnotta SM, Castiglioni I, et al. (2016). TCGAbiolinks: an R/Bioconductor package for integrative analysis of TCGA data. Nucleic Acids Res 44, e71. [DOI] [PMC free article] [PubMed] [Google Scholar]
- Consortium EP (2012). An integrated encyclopedia of DNA elements in the human genome. Nature 489, 57–74. [DOI] [PMC free article] [PubMed] [Google Scholar]
- Corces MR, Buenrostro JD, Wu B, Greenside PG, Chan SM, Koenig JL, Snyder MP, Pritchard JK, Kundaje A, Greenleaf WJ, et al. (2016). Lineage-specific and single-cell chromatin accessibility charts human hematopoiesis and leukemia evolution. Nat Genet 48, 1193–1203. [DOI] [PMC free article] [PubMed] [Google Scholar]
- Davison K, Cote S, Mader S, and Miller WH (2003). Glutathione depletion overcomes resistance to arsenic trioxide in arsenic-resistant cell lines. Leukemia 17, 931–940. [DOI] [PubMed] [Google Scholar]
- Durinck S, Spellman PT, Birney E, and Huber W (2009). Mapping identifiers for the integration of genomic datasets with the R/Bioconductor package biomaRt. Nature protocols 4, 1184–1191. [DOI] [PMC free article] [PubMed] [Google Scholar]
- Felix K, Gerstmeier S, Kyriakopoulos A, Howard OM, Dong HF, Eckhaus M, Behne D, Bornkamm GW, and Janz S (2004). Selenium deficiency abrogates inflammation-dependent plasma cell tumors in mice. Cancer Res 64, 2910–2917. [DOI] [PubMed] [Google Scholar]
- Fordyce FM (2013). Selenium deficiency and toxicity in the environment. In Essentials of medical geology (Springer), pp. 375–416. [Google Scholar]
- Ghandi M, Huang FW, Jane-Valbuena J, Kryukov GV, Lo CC, McDonald ER 3rd, Barretina J, Gelfand ET, Bielski CM, Li H, et al. (2019). Next-generation characterization of the Cancer Cell Line Encyclopedia. Nature 569, 503–508. [DOI] [PMC free article] [PubMed] [Google Scholar]
- Groschel S, Sanders MA, Hoogenboezem R, de Wit E, Bouwman BA, Erpelinck C, van der Velden VH, Havermans M, Avellino R, van Lom K, et al. (2014). A single oncogenic enhancer rearrangement causes concomitant EVI1 and GATA2 deregulation in leukemia. Cell 157, 369–381. [DOI] [PubMed] [Google Scholar]
- Gundry MC, Brunetti L, Lin A, Mayle AE, Kitano A, Wagner D, Hsu JI, Hoegenauer KA, Rooney CM, Goodell MA, et al. (2016). Highly Efficient Genome Editing of Murine and Human Hematopoietic Progenitor Cells by CRISPR/Cas9. Cell reports 17, 1453–1461. [DOI] [PMC free article] [PubMed] [Google Scholar]
- Han L, Jorgensen JL, Brooks C, Shi C, Zhang Q, Nogueras Gonzalez GM, Cavazos A, Pan R, Mu H, Wang SA, et al. (2017). Antileukemia Efficacy and Mechanisms of Action of SL-101, a Novel Anti-CD123 Antibody Conjugate, in Acute Myeloid Leukemia. Clin Cancer Res 23, 3385–3395. [DOI] [PMC free article] [PubMed] [Google Scholar]
- Hawkes WC, Kelley DS, and Taylor PC (2001). The effects of dietary selenium on the immune system in healthy men. Biological trace element research 81, 189–213. [DOI] [PubMed] [Google Scholar]
- Hnisz D, Abraham BJ, Lee TI, Lau A, Saint-Andre V, Sigova AA, Hoke HA, and Young RA (2013). Super-enhancers in the control of cell identity and disease. Cell 155, 934–947. [DOI] [PMC free article] [PubMed] [Google Scholar]
- Hnisz D, Schuijers J, Lin CY, Weintraub AS, Abraham BJ, Lee TI, Bradner JE, and Young RA (2015). Convergence of Developmental and Oncogenic Signaling Pathways at Transcriptional Super-Enhancers. Molecular cell. [DOI] [PMC free article] [PubMed] [Google Scholar]
- Hnisz D, Weintraub AS, Day DS, Valton AL, Bak RO, Li CH, Goldmann J, Lajoie BR, Fan ZP, Sigova AA, et al. (2016). Activation of proto-oncogenes by disruption of chromosome neighborhoods. Science 351, 1454–1458. [DOI] [PMC free article] [PubMed] [Google Scholar]
- Hu T, Morita K, Hill MC, Jiang Y, Kitano A, Saito Y, Wang F, Mao X, Hoegenauer KA, Morishita K, et al. (2019). PRDM16s transforms megakaryocyte-erythroid progenitors into myeloid leukemia-initiating cells. Blood 134, 614–625. [DOI] [PMC free article] [PubMed] [Google Scholar]
- Huber W, Carey VJ, Gentleman R, Anders S, Carlson M, Carvalho BS, Bravo HC, Davis S, Gatto L, Girke T, et al. (2015). Orchestrating high-throughput genomic analysis with Bioconductor. Nat Methods 12, 115–121. [DOI] [PMC free article] [PubMed] [Google Scholar]
- Jiang X, Mak PY, Mu H, Tao W, Mak DH, Kornblau S, Zhang Q, Ruvolo P, Burks JK, Zhang W, et al. (2018). Disruption of Wnt/beta-Catenin Exerts Antileukemia Activity and Synergizes with FLT3 Inhibition in FLT3-Mutant Acute Myeloid Leukemia. Clin Cancer Res 24, 2417–2429. [DOI] [PMC free article] [PubMed] [Google Scholar]
- Jiang Y, Hu T, Wang T, Shi X, Kitano A, Eagle K, Hoegenauer KA, Konopleva M, Lin C, Young NL, et al. (2019). AMP-activated protein kinase links acetyl-CoA homeostasis to BRD4 recruitment in acute myeloid leukemia. Blood. [DOI] [PMC free article] [PubMed] [Google Scholar]
- Jones CL, Stevens BM, D’Alessandro A, Reisz JA, Culp-Hill R, Nemkov T, Pei S, Khan N, Adane B, Ye H, et al. (2018). Inhibition of Amino Acid Metabolism Selectively Targets Human Leukemia Stem Cells. Cancer Cell 34, 724–740 e724. [DOI] [PMC free article] [PubMed] [Google Scholar]
- Krivtsov AV, Twomey D, Feng Z, Stubbs MC, Wang Y, Faber J, Levine JE, Wang J, Hahn WC, Gilliland DG, et al. (2006). Transformation from committed progenitor to leukaemia stem cell initiated by MLL-AF9. Nature 442, 818–822. [DOI] [PubMed] [Google Scholar]
- Lagadinou ED, Sach A, Callahan K, Rossi RM, Neering SJ, Minhajuddin M, Ashton JM, Pei S, Grose V, O’Dwyer KM, et al. (2013). BCL-2 inhibition targets oxidative phosphorylation and selectively eradicates quiescent human leukemia stem cells. Cell Stem Cell 12, 329–341. [DOI] [PMC free article] [PubMed] [Google Scholar]
- Li H, and Durbin R (2009). Fast and accurate short read alignment with Burrows-Wheeler transform. Bioinformatics 25, 1754–1760. [DOI] [PMC free article] [PubMed] [Google Scholar]
- Lin CY, Erkek S, Tong Y, Yin L, Federation AJ, Zapatka M, Haldipur P, Kawauchi D, Risch T, Warnatz HJ, et al. (2016). Active medulloblastoma enhancers reveal subgroup-specific cellular origins. Nature 530, 57–62. [DOI] [PMC free article] [PubMed] [Google Scholar]
- Loven J, Hoke HA, Lin CY, Lau A, Orlando DA, Vakoc CR, Bradner JE, Lee TI, and Young RA (2013). Selective inhibition of tumor oncogenes by disruption of super-enhancers. Cell 153, 320–334. [DOI] [PMC free article] [PubMed] [Google Scholar]
- Mack SC, Pajtler KW, Chavez L, Okonechnikov K, Bertrand KC, Wang X, Erkek S, Federation A, Song A, Lee C, et al. (2018). Therapeutic targeting of ependymoma as informed by oncogenic enhancer profiling. Nature 553, 101–105. [DOI] [PMC free article] [PubMed] [Google Scholar]
- Mack SC, Singh I, Wang X, Hirsch R, Wu Q, Villagomez R, Bernatchez JA, Zhu Z, Gimple RC, Kim LJY, et al. (2019). Chromatin landscapes reveal developmentally encoded transcriptional states that define human glioblastoma. J Exp Med 216, 1071–1090. [DOI] [PMC free article] [PubMed] [Google Scholar]
- Mansour MR, Abraham BJ, Anders L, Berezovskaya A, Gutierrez A, Durbin AD, Etchin J, Lawton L, Sallan SE, Silverman LB, et al. (2014). Oncogene regulation. An oncogenic super-enhancer formed through somatic mutation of a noncoding intergenic element. Science 346, 1373–1377. [DOI] [PMC free article] [PubMed] [Google Scholar]
- McDonald ER 3rd, de Weck A, Schlabach MR, Billy E, Mavrakis KJ, Hoffman GR, Belur D, Castelletti D, Frias E, Gampa K, et al. (2017). Project DRIVE: A Compendium of Cancer Dependencies and Synthetic Lethal Relationships Uncovered by Large-Scale, Deep RNAi Screening. Cell 170, 577–592 e510. [DOI] [PubMed] [Google Scholar]
- McKeown MR, Corces MR, Eaton ML, Fiore C, Lee E, Lopez JT, Chen MW, Smith D, Chan SM, Koenig JL, et al. (2017). Superenhancer Analysis Defines Novel Epigenomic Subtypes of Non-APL AML, Including an RARalpha Dependency Targetable by SY-1425, a Potent and Selective RARalpha Agonist. Cancer discovery 7, 1136–1153. [DOI] [PMC free article] [PubMed] [Google Scholar]
- Metzeler KH, Herold T, Rothenberg-Thurley M, Amler S, Sauerland MC, Gorlich D, Schneider S, Konstandin NP, Dufour A, Braundl K, et al. (2016). Spectrum and prognostic relevance of driver gene mutations in acute myeloid leukemia. Blood 128, 686–698. [DOI] [PubMed] [Google Scholar]
- Meyers RM, Bryan JG, McFarland JM, Weir BA, Sizemore AE, Xu H, Dharia NV, Montgomery PG, Cowley GS, Pantel S, et al. (2017). Computational correction of copy number effect improves specificity of CRISPR-Cas9 essentiality screens in cancer cells. Nat Genet 49, 1779–1784. [DOI] [PMC free article] [PubMed] [Google Scholar]
- Nabet B, P OB, Reyes JM, Shieh K, Lin CY, Will CM, Popovic R, Ezponda T, Bradner JE, Golden AA, et al. (2015). Deregulation of the Ras-Erk Signaling Axis Modulates the Enhancer Landscape. Cell reports 12, 1300–1313. [DOI] [PMC free article] [PubMed] [Google Scholar]
- Northcott PA, Lee C, Zichner T, Stutz AM, Erkek S, Kawauchi D, Shih DJ, Hovestadt V, Zapatka M, Sturm D, et al. (2014). Enhancer hijacking activates GFI1 family oncogenes in medulloblastoma. Nature 511, 428–434. [DOI] [PMC free article] [PubMed] [Google Scholar]
- Patel JL, Schumacher JA, Frizzell K, Sorrells S, Shen W, Clayton A, Jattani R, and Kelley TW (2017). Coexisting and cooperating mutations in NPM1-mutated acute myeloid leukemia. Leuk Res 56, 7–12. [DOI] [PubMed] [Google Scholar]
- Patel JP, Gonen M, Figueroa ME, Fernandez H, Sun Z, Racevskis J, Van Vlierberghe P, Dolgalev I, Thomas S, Aminova O, et al. (2012). Prognostic relevance of integrated genetic profiling in acute myeloid leukemia. N Engl J Med 366, 1079–1089. [DOI] [PMC free article] [PubMed] [Google Scholar]
- Ramaswamy K, Forbes L, Minuesa G, Gindin T, Brown F, Kharas MG, Krivtsov AV, Armstrong SA, Still E, de Stanchina E, et al. (2018). Peptidomimetic blockade of MYB in acute myeloid leukemia. Nature communications 9, 110. [DOI] [PMC free article] [PubMed] [Google Scholar]
- Ramsay RG, and Gonda TJ (2008). MYB function in normal and cancer cells. Nat Rev Cancer 8, 523–534. [DOI] [PubMed] [Google Scholar]
- Saint-Andre V, Federation AJ, Lin CY, Abraham BJ, Reddy J, Lee TI, Bradner JE, and Young RA (2016). Models of human core transcriptional regulatory circuitries. Genome research 26, 385–396. [DOI] [PMC free article] [PubMed] [Google Scholar]
- Saito Y, Chapple RH, Lin A, Kitano A, and Nakada D (2015). AMPK Protects Leukemia-Initiating Cells in Myeloid Leukemias from Metabolic Stress in the Bone Marrow. Cell Stem Cell 17, 585–596. [DOI] [PMC free article] [PubMed] [Google Scholar]
- Schlenk RF, Dohner K, Krauter J, Frohling S, Corbacioglu A, Bullinger L, Habdank M, Spath D, Morgan M, Benner A, et al. (2008). Mutations and treatment outcome in cytogenetically normal acute myeloid leukemia. N Engl J Med 358, 1909–1918. [DOI] [PubMed] [Google Scholar]
- Shi J, Whyte WA, Zepeda-Mendoza CJ, Milazzo JP, Shen C, Roe JS, Minder JL, Mercan F, Wang E, Eckersley-Maslin MA, et al. (2013). Role of SWI/SNF in acute leukemia maintenance and enhancer-mediated Myc regulation. Genes & development 27, 2648–2662. [DOI] [PMC free article] [PubMed] [Google Scholar]
- Shi X, Kitano A, Jiang Y, Luu V, Hoegenauer KA, and Nakada D (2018). Clonal expansion and myeloid leukemia progression modeled by multiplex gene editing of murine hematopoietic progenitor cells. Exp Hematol 64, 33–44 e35. [DOI] [PMC free article] [PubMed] [Google Scholar]
- Tyner JW, Tognon CE, Bottomly D, Wilmot B, Kurtz SE, Savage SL, Long N, Schultz AR, Traer E, Abel M, et al. (2018). Functional genomic landscape of acute myeloid leukaemia. Nature 562, 526–531. [DOI] [PMC free article] [PubMed] [Google Scholar]
- Verhaak RG, Wouters BJ, Erpelinck CA, Abbas S, Beverloo HB, Lugthart S, Lowenberg B, Delwel R, and Valk PJ (2009). Prediction of molecular subtypes in acute myeloid leukemia based on gene expression profiling. Haematologica 94, 131–134. [DOI] [PMC free article] [PubMed] [Google Scholar]
- Whyte WA, Orlando DA, Hnisz D, Abraham BJ, Lin CY, Kagey MH, Rahl PB, Lee TI, and Young RA (2013). Master transcription factors and mediator establish super-enhancers at key cell identity genes. Cell 153, 307–319. [DOI] [PMC free article] [PubMed] [Google Scholar]
- Wunderlich M, Chou F, Link KA, Mizukawa B, Perry R, Carroll M, and Mulloy J (2010). AML xenograft efficiency is significantly improved in NOD/SCID-IL2RG mice constitutively expressing human SCF, GM-CSF and IL-3. Leukemia 24, 1785. [DOI] [PMC free article] [PubMed] [Google Scholar]
- Yim SH, Clish CB, and Gladyshev VN (2019). Selenium Deficiency Is Associated with Pro-longevity Mechanisms. Cell reports 27, 2785–2797 e2783. [DOI] [PMC free article] [PubMed] [Google Scholar]
Associated Data
This section collects any data citations, data availability statements, or supplementary materials included in this article.
Supplementary Materials
Table S1. ChIP-seq sample identification and quality control results; related to STAR Methods. ChIP-seq sample identification, data sources, and quality control scores.
Table S2. Superenhancer-associated genes; related to STAR Methods. This table identifies the location of the AML consensus super enhancer associated with each expressed gene and the enhancer specificity results for that enhancer. It also includes the median CERES Avana dependency score and median CCLE mRNA across AML and non-AML cell lines for each gene.
Table S3. AML Consensus Superenhancers; Related to STAR Methods. Location of consensus AML super enhancers and identification of all genes associated with each super enhancer.
Table S6. Oligonucleotides used in the study; Related to STAR Methods. This table list the nucleotides used in the study as sgRNA sequences or for PCR.
Data Availability Statement
All sequencing data used in this study is available from existing archives as listed in Table S1. Custom computer code supporting this paper can be found at https://app.box.com/s/5cw4lkggaxzbkiqu16dpk4wtdbaj99yq