. 2022 Mar 2;11:e72468. doi: 10.7554/eLife.72468

Figure 1. Potency and isoform selectivity of NBI-921352 for human and mouse NaV channels.

Concentration-response curves were generated by automated patch-clamp electrophysiology using the SophionQube. Concentration-response curves were generated for human (A) or mouse (B) NaV channel isoforms heterologously expressed in HEK293 cells. The analysis included only those cells that met pre-specified acceptance criteria for seal quality, current amplitude, and series resistance. Normalized data from all cell recordings at a concentration were grouped together and plotted with GraphPad Prism 8. Details regarding the number of cells analyzed for each NaV channel and concentration can be found in the source data sheet. Error bars indicating the standard error of the mean fraction were plotted for all points, but, in some cases, they were smaller than the data point symbols and, therefore, not visible. The chemical structure of NBI-921352 is shown (C).

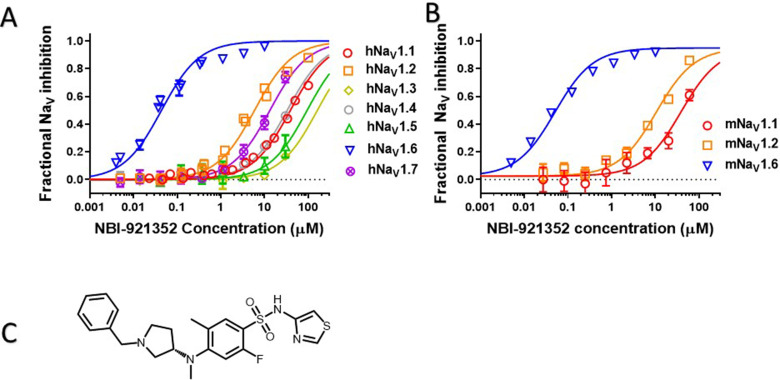
Figure 1—source data 1. Quantification of potency and isoform selectivity of NBI-921352.

Figure 1.

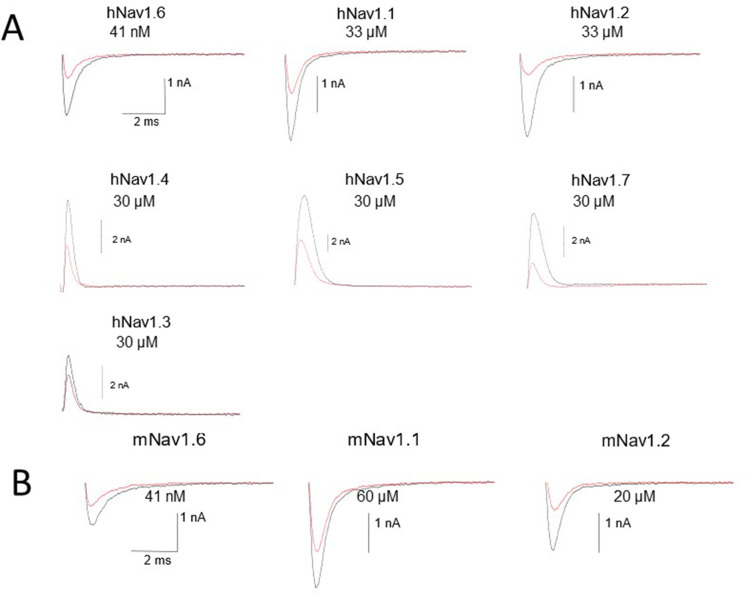
Figure 1—figure supplement 1. Representative raw traces of voltage-clamp recordings of control and the concentrations close to the NBI-921352 IC50 for all tested sodium channel isoforms in Figure 1.

Figure 1—figure supplement 1.

Note that in some cases currents are outward because the sodium gradients were reversed. This was done to improve assay robustness and reproducibility. See methods for details. We have found that current direction does not impact pharmacology for inhibitors, like NBI-921352, that bind the VSD4 site (not shown).
Figure 1—figure supplement 2. Potency of NBI-921352 measured form a holding potential approximating the V0.5 of inactivation for NaV1.

Figure 1—figure supplement 2.

6. For the “V0.5” assay the membrane was held at –62 mV for Nav1.6 and the protocol shown above was applied. The solutions used were the same as for hNav1.6 in the standard assay. The protocol consisted of a 0.04 Hz repeating test pulse to –20 mV for 20ms to assess current inhibition preceded by a brief 2ms recovery pulse to –120 mV that was included to increase stability of the currents over time and boost the current size. The protocol was run in vehicle conditions at 0.1 Hz for 150 seconds compound to establish the baseline for each cell prior to the addition of compound for 10 min at a pulse frequency of 0.04 Hz. Full inhibition was defined by the addition of 300 nM TTX and data were processed in the same way as for the V-45 standard assay described in Figure 1.
Figure 1—figure supplement 2—source data 1. Quantification of potency with alternate voltage protocol.