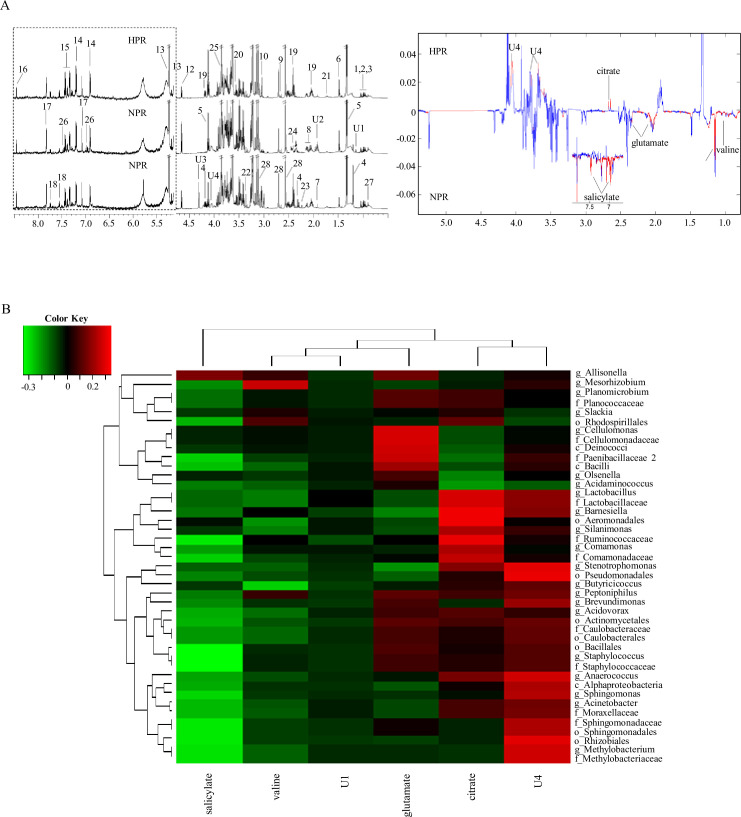
Figure 5. 1H NMR spectra of metabolites from the normal platelet reactivity (NPR) and high platelet reactivity (HPR) groups.
(A) NMR spectrum and signal assignment diagram. There were 30 samples in the NPR group and 30 samples in the HPR group. The dotted line on the left is the signal spectrum amplified 30-fold. Each number in the figure represents a metabolite. The right is a two color loading graph of the nonparametric test (univariate analysis). 1, leucine; 2, isoleucine; 3, valine; 4, 3-hydroxybutyric acid; 5, lactate; 6, alanine; 7, acetate; 8, glutamate; 9, citrate; 10, creatine; 11, creatinine; 12, β-glucose; 13, a-glucose; 14, tyrosine; 15, phenylalanine; 16, formate; 17, histidine; 18, tryptophan; 19, pyroglutamate; 20, glycine; 21, lysine; 22, methanol; 23, acetone; 24, succinate; 25, glucitol; 26, salicylate; 27, 2-Hydroxybutyric acid; 28, EDTA; U1, unknown 1; U2, unknown 2; U3, unknown 3; U4, unknown 4. (B) Correlation analysis between 16S and significantly changed metabolites. The intensity of the color represents the r value (correlation) (negative score, green; positive score, red).

