eLife logoLink to eLife
. 2022 Feb 25;11:e72834. doi: 10.7554/eLife.72834

Architecture and evolution of the cis-regulatory system of the echinoderm kirrelL gene

Jian Ming Khor 1, Charles A Ettensohn 1,
Editors: Kathryn Song Eng Cheah2, Kathryn Song Eng Cheah3
PMCID: PMC8903837  PMID: 35212624

Abstract

The gene regulatory network (GRN) that underlies echinoderm skeletogenesis is a prominent model of GRN architecture and evolution. KirrelL is an essential downstream effector gene in this network and encodes an Ig-superfamily protein required for the fusion of skeletogenic cells and the formation of the skeleton. In this study, we dissected the transcriptional control region of the kirrelL gene of the purple sea urchin, Strongylocentrotus purpuratus. Using plasmid- and bacterial artificial chromosome-based transgenic reporter assays, we identified key cis-regulatory elements (CREs) and transcription factor inputs that regulate Sp-kirrelL, including direct, positive inputs from two key transcription factors in the skeletogenic GRN, Alx1 and Ets1. We next identified kirrelL cis-regulatory regions from seven other echinoderm species that together represent all classes within the phylum. By introducing these heterologous regulatory regions into developing sea urchin embryos we provide evidence of their remarkable conservation across ~500 million years of evolution. We dissected in detail the kirrelL regulatory region of the sea star, Patiria miniata, and demonstrated that it also receives direct inputs from Alx1 and Ets1. Our findings identify kirrelL as a component of the ancestral echinoderm skeletogenic GRN. They support the view that GRN subcircuits, including specific transcription factor–CRE interactions, can remain stable over vast periods of evolutionary history. Lastly, our analysis of kirrelL establishes direct linkages between a developmental GRN and an effector gene that controls a key morphogenetic cell behavior, cell–cell fusion, providing a paradigm for extending the explanatory power of GRNs.

Research organism: S. purpuratus, L. variegatus, P. miniata

Introduction

Evolutionary changes in animal form have occurred through modifications to the developmental programs that give rise to anatomy. These developmental programs can be viewed as gene regulatory networks (GRNs), complex, dynamic networks of interacting regulatory (i.e., transcription factor-encoding) genes that determine the transcriptional states of embryonic cells (Peter and Davidson, 2015). Sea urchins and other echinoderms are prominent models for GRN biology for several reasons: (1) there are well-developed tools for dissecting developmental GRNs in these animals, (2) a large number of species that represent a wide range of evolutionary distances are amenable to study, and (3) there is a rich diversity of developmental modes and morphologies within the phylum (Arnone et al., 2016).

All adult echinoderms possess elaborate, calcified endoskeletons. Most species are maximal indirect developers; that is, they develop via a feeding larva that undergoes metamorphosis to produce the adult. The feeding larvae of echinoids (sea urchins) and ophiuroids (brittle stars) have extensive endoskeletons, holothuroids (sea cucumbers) have rudimentary skeletal elements, and asteroids (sea stars) lack larval skeletal elements entirely. Larval skeletons are thought to be derived within the echinoderms as the feeding larvae of hemichordates (acorn worms), the sister group to echinoderms, and the larvae of crinoids (sea lilies and feather stars), a basal echinoderm clade, lack skeletons. The skeletal cells of larval and adult echinoderms are similar in many respects, supporting the widely accepted view that the larval skeleton arose via co-option of the adult skeletogenic program (Czarkwiani et al., 2013; Gao et al., 2015; Gao and Davidson, 2008; Killian et al., 2010; Mann et al., 2010; Mann et al., 2008; Richardson et al., 1989).

The embryonic skeleton of euechinoid sea urchins, the best studied taxon, is formed by a specialized population of skeletogenic cells known as primary mesenchyme cells (PMCs). These cells are the progeny of the large micromeres (LMs), four cells that arise near the vegetal pole during early cleavage. The GRN that underlies PMC specification is one of the best characterized GRNs in any animal embryo (Oliveri et al., 2008; Shashikant et al., 2018a). This GRN is initially deployed through the activity of a localized maternal protein, Dishevelled, which stabilizes β-catenin in the LM lineage, leading to the early zygotic expression of a repressor, pmar1/micro1 (Logan et al., 1999; Nishimura et al., 2004; Oliveri et al., 2002; Peng and Wikramanayake, 2013; Weitzel et al., 2004). These molecular events lead to the zygotic expression of several regulatory genes selectively in the LM-PMC lineage. Two of the most important of these regulatory genes are alx1 (Ettensohn et al., 2003) and ets1 (Kurokawa et al., 1999), each of which is required for PMC specification and morphogenesis.

After their specification, PMCs undergo a spectacular sequence of morphogenetic behaviors that includes epithelial–mesenchymal transition (EMT), directional cell migration, cell fusion, and biomineral formation. PMCs undergo EMT at the late blastula stage, ingressing from the vegetal plate into the blastocoel. They migrate along the blastocoel wall and gradually arrange themselves in a ring-like pattern near the equator of the embryo. As they migrate, PMCs extend filopodia that fuse with those of neighboring PMCs, giving rise to a cable-like structure that joins the cells in a single, extensive syncytium. Beginning late in gastrulation and continuing throughout the remainder of embryogenesis, PMCs deposit calcified biomineral within the syncytial filopodial cable.

The complex sequence of PMC morphogenetic behaviors is regulated by hundreds of specialized effector proteins. The spatiotemporal expression patterns of these proteins are controlled by the GRN deployed in the LM-PMC lineage. A major current goal is to identify effector proteins that regulate specific PMC behaviors and elucidate the GRN circuitry that controls these genes (see Ettensohn, 2013; Lyons et al., 2012). Dissection of the cis-regulatory elements (CREs) that control essential morphogenetic effector genes, including the identification of specific transcription factor inputs, would directly link them to the relevant circuitry and provide a GRN-level explanation of developmental anatomy. At present, we have only a limited understanding of the cis-regulatory control of three PMC effector genes: two genes (sm30 and sm50) that encode secreted proteins occluded in the biomineral (Makabe et al., 1995; Walters et al., 2008) and a third gene (cyclophilin/cyp1) of unknown function (Amore and Davidson, 2006).

KirrelL is a PMC-specific, Ig domain-containing, transmembrane protein required for cell–cell fusion (Ettensohn and Dey, 2017). The expression and function of the protein have been examined in two sea urchin species, Strongylocentrotus purpuratus and Lytechinus variegatus. In kirrelL morphants, PMCs extend filopodia and migrate but filopodial contacts do not result in fusion; this prevents the formation of the PMC syncytium and results in the secretion of small, unconnected biomineralized elements. In all echinoderms that have been examined, the kirrelL gene lacks introns, raising the possibility that its origin early in echinoderm evolution was a consequence of retrotransposition, a common gene transfer mechanism that results in intronless genes and one that has played a particularly prominent role in the diversification of Ig-domain-containing proteins (Baertsch et al., 2008; Cordaux and Batzer, 2009; Dermody et al., 2009; Farré et al., 2017). The expression pattern of kirrelL is typical of many PMC effector genes . In S. purpuratus, kirrelL expression is first detectable at the blastula stage (~18 hpf) and peaks early in gastrulation (~30 hpf) (Tu et al., 2014). Expression then declines and is followed by a second peak at ~64 hpf, when kirrelL is expressed predominantly at sites of active skeletal rod growth as a consequence of localized, ectoderm-derived cues (Sun and Ettensohn, 2014). RNA-seq studies have shown that Sp-kirrelL, like many PMC effector genes, is positively regulated both by Alx1 and Ets1 (Rafiq et al., 2014). Although the gene has only been studied in detail in sea urchins, a recent study found that kirrelL is also expressed specifically in the embryonic skeletogenic mesenchyme of a brittle star, Amphiura filiformis (Dylus et al., 2018).

In the present study, we used plasmid- and bacterial artificial chromosome (BAC)-based transgenic reporter assays to identify key CREsand transcription factor inputs that regulate kirrelL in the sea urchin, S. purpuratus, directly linking this morphogenetic effector gene to the PMC GRN. In addition, we identified kirrelL cis-regulatory regions in echinoderm species from all major clades within the phylum and found that these regulatory regions drove PMC-specific expression in developing sea urchin embryos, highlighting their striking conservation across 450–500 million years of evolution. We analyzed in detail the kirrelL regulatory region of the sea star, Patiria miniata, and found that this gene, like Sp-kirrelL, receives direct inputs from Alx1 and Ets1. Our findings identify kirrelL as a component of the ancestral echinoderm skeletogenic GRN and strengthen the view that GRN subcircuits, including specific transcription factor–CRE interactions, can remain stable over very long periods of evolutionary history.

Results

The sea urchin Sp-kirrelL cis-regulatory landscape

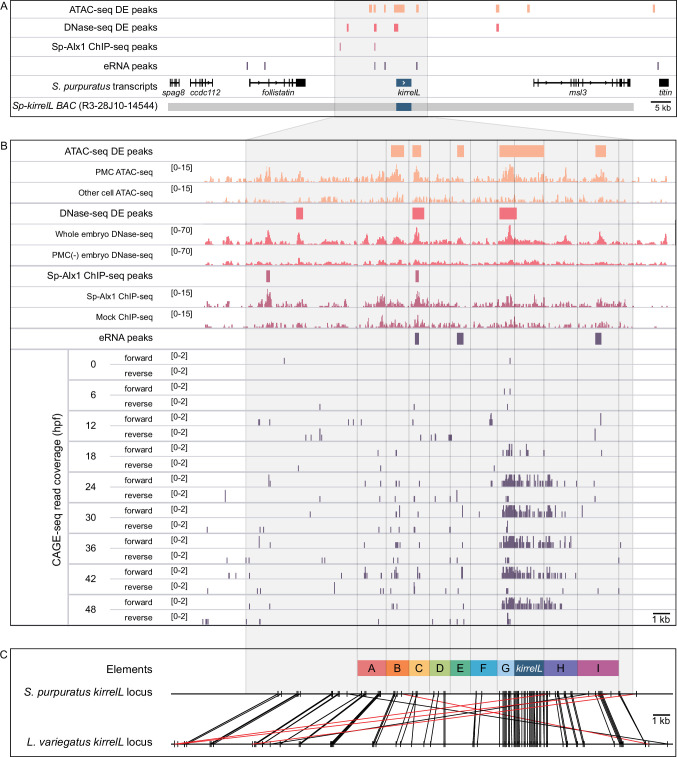
We identified potential Sp-kirrelL CREs based on several criteria. We considered whether candidate regions were (1) hyperaccessible in PMCs relative to other cell types, (2) bound by Alx1, a key transcription factor in the PMC GRN and a positive regulator of Sp-kirrelL, (3) associated with active enhancer RNA (eRNA) expression, and (4) phylogenetically conserved at the level of DNA sequence. In a previous study, ATAC-seq and DNase-seq were used to identify regions of chromatin that are differentially accessible in PMCs relative to other cell types at the mesenchyme blastula stage (Shashikant et al., 2018b). ChIP-seq was used to identify binding sites of Sp-Alx1 at the same developmental stage (Khor et al., 2019). Recently, we used Cap Analysis of Gene Expression Sequencing (CAGE-seq) to profile eRNA expression at nine different stages of early sea urchin embryogenesis (Khor et al., 2021). Significantly, our integration of these different genome-wide datasets revealed several putative CREs located near Sp-kirrelL, some of which were found to share several signatures (Figure 1A). Developmental CAGE-seq profiles of eRNAs also provided additional information regarding temporal patterns of CRE activity (Figure 1B). To assist in identifying candidate CREs regulating the spatiotemporal expression of Sp-kirrelL, we used GenePalette (Smith et al., 2017) to perform phylogenetic footprinting of the S. purpuratus and L. variegatus kirrelL gene loci. Based on cross-species sequence conservation, cell type-specific DNA accessibility, Sp-Alx1-binding, and eRNA expression, we divided the intergenic sequences flanking Sp-kirrelL into nine putative CREs (labeled elements A–I) (Figure 1C). The elements were between 1.0 and 2.4 kb in size, with an average size of 1.5 kb.

Figure 1. Characterization of the transcriptional regulatory landscape surrounding the S. purpuratus kirrelL (Sp-kirrelL) locus.

Figure 1.

(A) Diagram of the Sp-kirrelL locus showing neighboring genes, regions of chromatin differentially accessible in primary mesenchyme cells (PMCs) at the mesenchyme blastula stage (ATAC-seq DE peaks and DNase-seq DE peaks) (Shashikant et al., 2018b), Sp-Alx1-binding sites at the mesenchyme blastula stage (Sp-Alx1 ChIP-seq peaks) (Khor et al., 2019), and enhancer RNA (eRNA) peaks (union of all peaks from the nine developmental stages examined by Khor et al., 2021). (B) Signal obtained from each assay in the vicinity of the Sp-kirrelL locus. The bottom part of the panel shows the expression of eRNAs at the nine developmental stages analyzed by Khor et al., 2021. (C) Phylogenetic footprinting of genomic sequences near S. purpuratus and L. variegatus kirrelL (±10 kb of an exon) using GenePalette. Black lines indicate identical sequences of 15 bp or longer in the same orientation while red lines indicate identical sequences of 15 bp or longer in the opposite orientation. Nine putative cis-regulatory elements (CREs; labeled elements A–I) were identified based on sequence conservation and chromatin signatures.

Characterization of functional Sp-kirrelL CREs

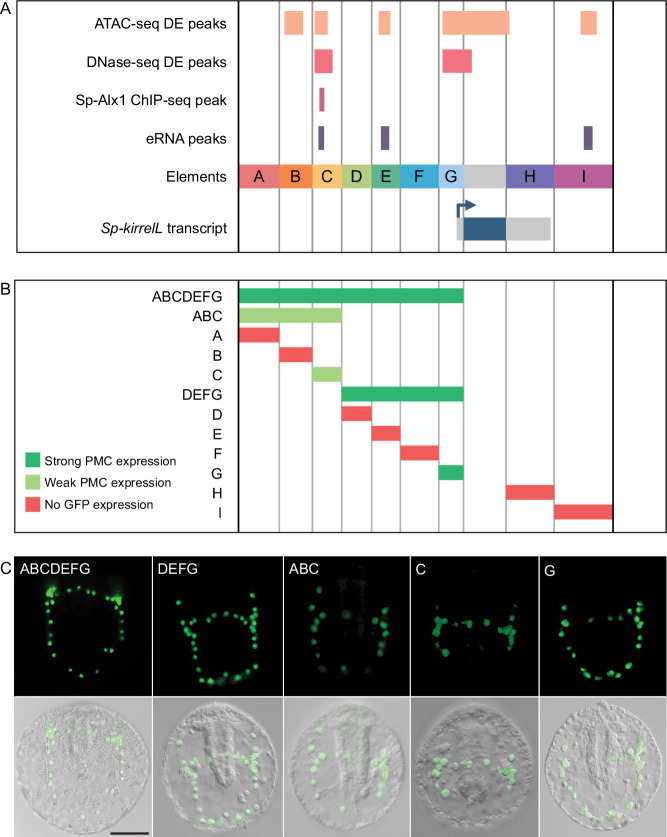
To test the transcriptional regulatory activity of candidate CREs (Figure 2A), we cloned them individually or in combination into the EpGFPII reporter plasmid, which contains a weak, basal sea urchin promoter, derived from the Sp-endo16 gene, upstream of Green Fluorescent Protein (GFP) (see Materials and methods) and injected them into fertilized eggs. We observed that a GFP reporter construct containing upstream elements A–G recapitulated the correct spatial expression pattern of endogenous Sp-kirrelL with minimal ectopic expression (Figure 2B, C and Figure 2—source data 1). Further dissections revealed that a reporter construct containing elements D–G also drove strong GFP expression specifically in PMCs while a construct consisting of elements A–C showed weak GFP expression in PMCs. When elements were tested individually, we found that only elements C and G were able to drive GFP expression in sea urchin embryos. Element G, which is directly upstream of the Sp-kirrelL translational start site and contains part of the Sp-kirrelL 5′ untranslated region (UTR), was observed to drive strong GFP expression specifically in the PMCs. Element C was also observed to drive GFP expression specifically in the PMCs, although fewer embryos expressed detectable levels of the reporter.

Figure 2. Functional analysis of noncoding genomic sequences flanking Sp-kirrelL to identify cis-regulatory elements (CREs).

Figure 2.

(A) Nine putative CREs (labeled elements A–I) were identified based on sequence conservation and previously published datasets (Khor et al., 2021; Khor et al., 2019; Shashikant et al., 2018b). (B) Summary of GFP expression regulated by putative CREs, as assessed by transgenic reporter assays. To be indicated as ‘strong primary mesenchyme cell (PMC) expression’, two criteria were satisfied: (1) more than 1/3 of all GFP-expressing embryos showed expression that was completely restricted to PMCs, and (2) the number of embryos in this class represented >15% of all injected embryos. ‘Weak PMC expression’ was defined similarly except that the number of embryos with expression completely restricted to PMCs represented <15% of all injected embryos. Complete scoring data for all constructs are contained in Figure 2—source data 1. (C) Spatial expression patterns of GFP reporter constructs containing different Sp-kirrelL elements at 48 hr postfertilization (hpf). Top row: GFP fluorescence. Bottom row: GFP fluorescence overlayed onto differential interference contrast (DIC) images. Scale bar: 50 μm.

Figure 2—source data 1. Quantification of GFP expression patterns in embryos injected with reporter constructs.

Identification of direct transcriptional inputs into element C

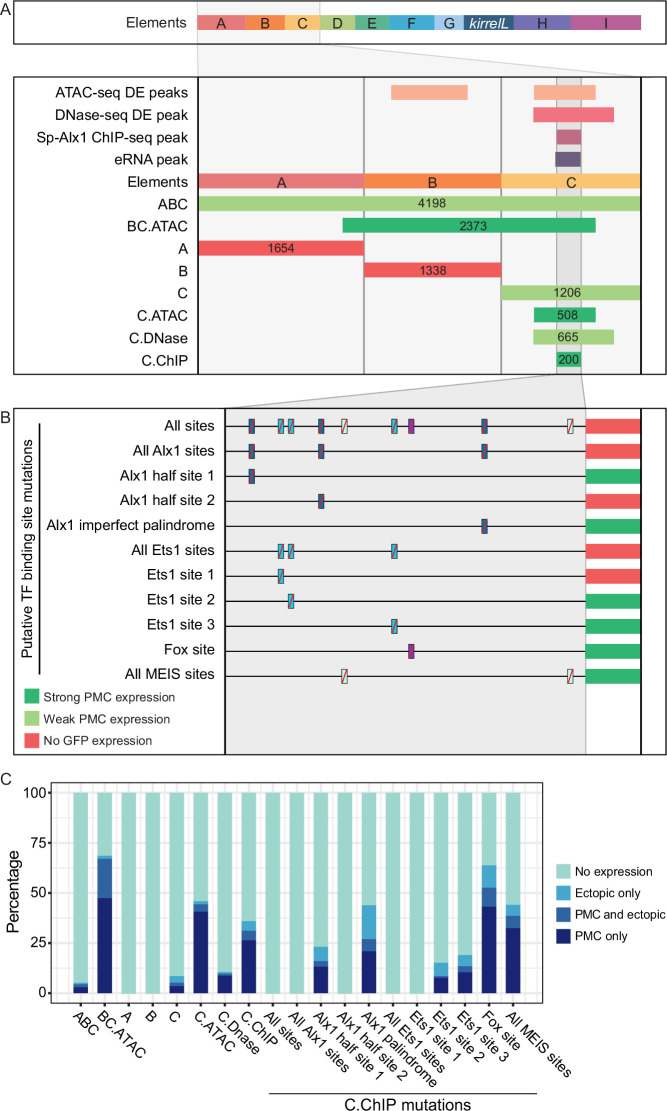
We next focused on the molecular dissection of element C to identify direct transcriptional inputs into this CRE. Element C is noteworthy as it is differentially accessible in the PMCs based on both ATAC-seq and DNase-seq, bound by Sp-Alx1, and associated with eRNA expression (Figure 3A). We first performed a detailed dissection of element C to identify the minimal region that supported strong, PMC-specific GFP expression. We found that a reporter construct containing element C alone showed relatively weak reporter activity, similar to the construct containing elements A–C. In contrast, a larger, overlapping CRE we termed BC.ATAC, which included part, but not all, of element C, exhibited strikingly enhanced GFP expression in PMCs (Figure 3—figure supplement 1A). This difference in activity between element C and BC.ATAC suggested that element C might contain regulatory sites that have greater activity when in close proximity to the promoter.

Figure 3. Molecular dissection of element C and the identification of direct transcriptional inputs.

(A) Summary of transgenic GFP expression regulated by element C truncations using reporter constructs. Serial truncation of element C was performed based on boundaries of peaks defined by chromatin accessibility, Sp-Alx1-binding, and enhancer RNA (eRNA) expression. (B) Summary of GFP expression driven by C.ChIP element mutants. Criteria for strong and weak primary mesenchyme cell (PMC) expression are defined in Figure 2. (C) Stacked bar plot showing a summary of GFP expression patterns of injected embryos scored at 48 hpf. Each spatial expression category is expressed as a percentage of total injected embryos.

Figure 3.

Figure 3—figure supplement 1. Element C truncation and mutational analysis.

Figure 3—figure supplement 1.

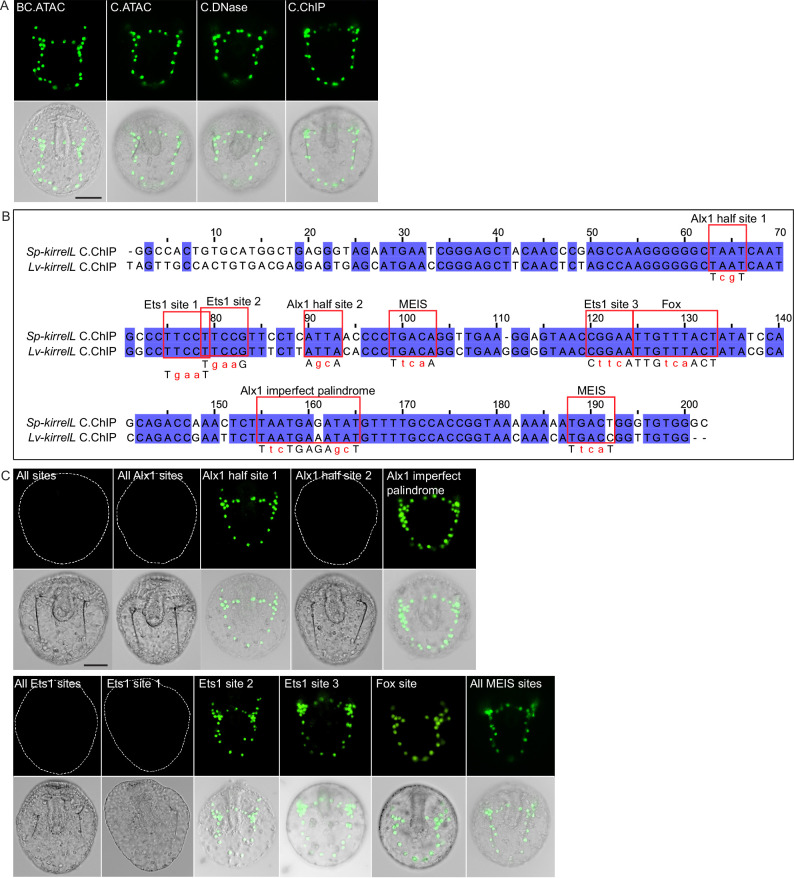
(A) Spatial expression patterns of GFP reporter constructs containing different element C truncations in embryos at 48 hpf. (B) Clustal alignment of Sp-kirrelL and Lv-kirrelL C.ChIP sequences. Violet shading indicates conserved sequences. Red boxes highlight putative transcription factor-binding sites. Mutations generated in binding sites are indicated in red letters below the aligned sequences. (C) Spatial expression patterns of GFP reporter constructs containing different C.ChIP element mutants at 48 hpf. Dotted lines show outlines of embryos that did not show GFP expression. Top rows: GFP fluorescence. Bottom rows: GFP fluorescence overlayed onto differential interference contrast (DIC) images. Scale bar: 50 μm.
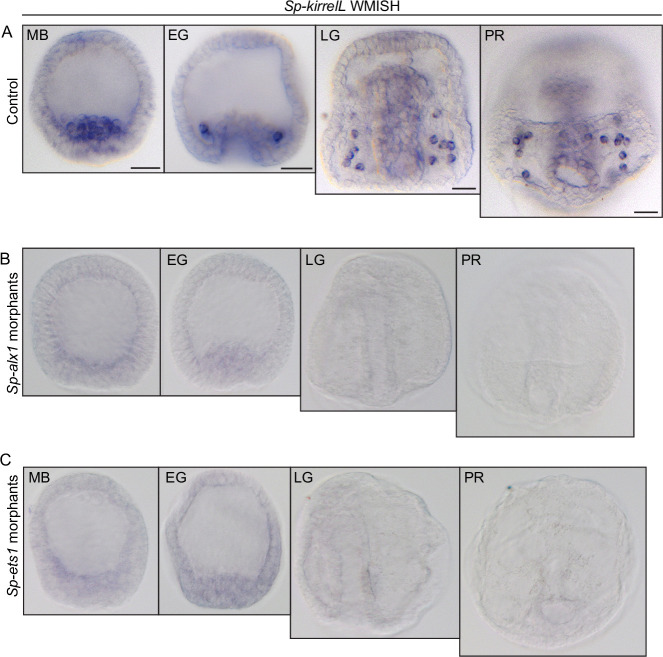
Figure 3—figure supplement 2. Effects of Sp-alx1 and Sp-ets1 knockdown on Sp-kirrelL expression.

Figure 3—figure supplement 2.

(A) Representative whole-mount in situ hybridization (WMISH) images showing Sp-kirrelL expression in the primary mesenchyme cells (PMCs) of uninjected control embryos. (B) Representative WMISH images showing lack of Sp-kirrelL expression in Sp-alx1 morphants. (C) Representative WMISH images showing lack of Sp-kirrelL expression in Sp-ets1 morphants. Scale bar: 20 μm. MB, mesenchyme blastula; EG, early gastrula; LG, late gastrula; PR, prism stage.

To explore this further, we generated several reporter constructs consisting of truncated forms of element C, with boundaries defined by peaks from ATAC-seq (C.ATAC), DNase-seq (C.DNase), and Sp-Alx1 ChIP-seq (C.ChIP). The minimal element C region that showed strong, PMC-specific activity was determined to be C.ChIP. Increasing the distance between the C.ChIP element and the promoter (as in the C.DNase construct) significantly reduced enhancer activity. To predict transcription factor inputs within C.ChIP, we scanned the 200 bp C.ChIP sequence using JASPAR (Mathelier et al., 2016), with a focus on transcription factors known to be expressed at higher levels in PMCs than in other cell types. This analysis identified several candidate Alx1- and Ets1-binding sites (Figure 3B and Figure 3—figure supplement 1B). Consistent with previous RNA-seq analysis which has shown that Sp-kirrelL is sensitive to alx1 and ets1 knockdowns (Rafiq et al., 2014), our whole-mount in situ hybridization (WMISH) analysis of both alx1 and ets1 morphants confirmed that Sp-kirrelL expression declined to undetectable levels (Figure 3—figure supplement 2). Our mutational analysis of C.ChIP revealed that mutations of all putative Alx1- and/or Ets1-binding sites completely abolished GFP expression (Figure 3C and Figure 3—figure supplement 1C). In contrast, constructs containing mutations in putative Fox- or MEIS-binding sites exhibited reporter activity similar to that of the parental construct. Mutations of individual Alx1 and Ets1 sites revealed that Alx1 half site 2 and Ets1 site 1 provided key regulatory inputs.

Analysis of the Sp-kirrelL promoter (element G)

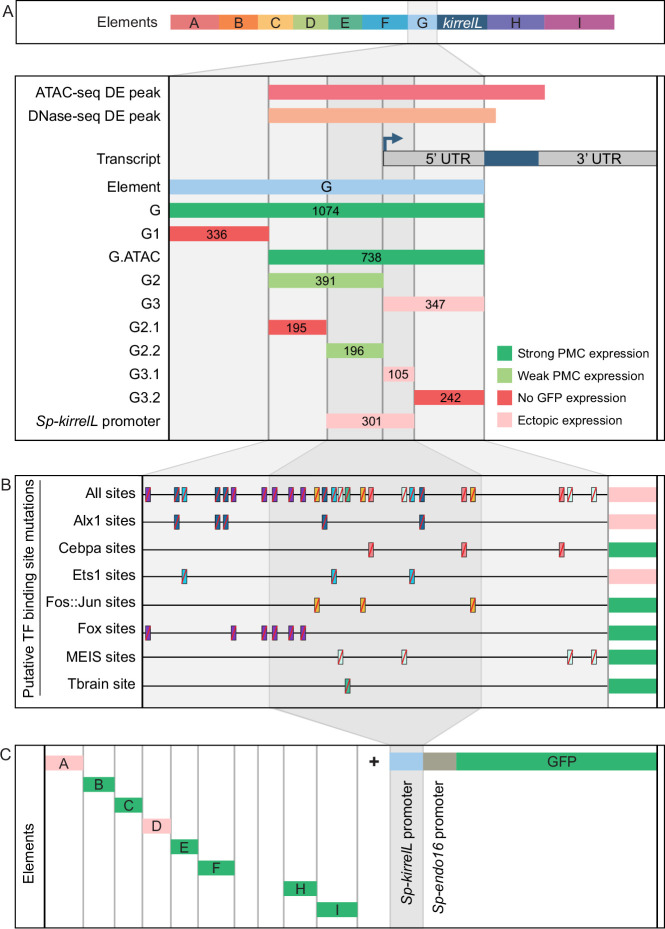
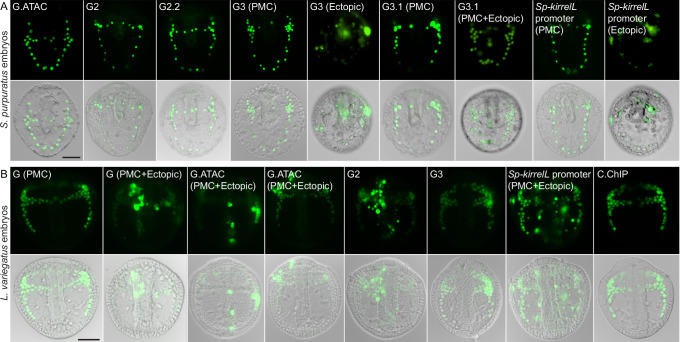
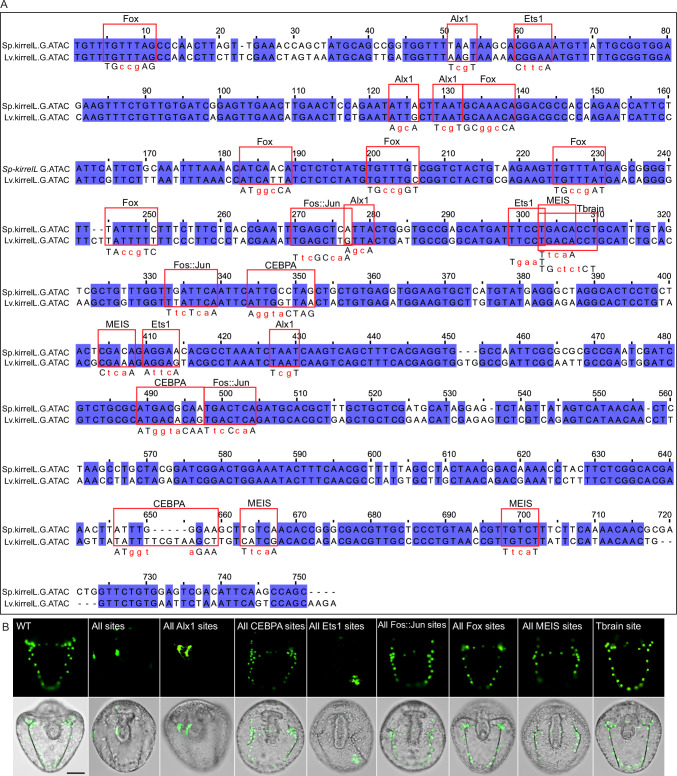
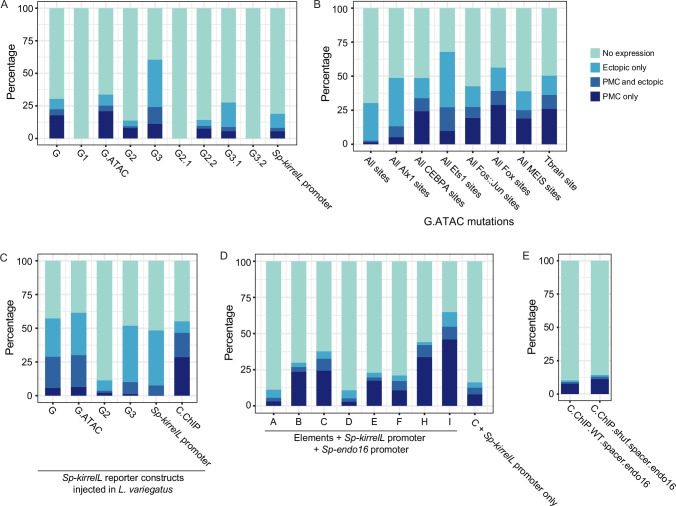
To characterize the native Sp-kirrelL promoter region, we performed a detailed dissection of element G, which contains sequences directly upstream of the Sp-kirrelL translational start site, including the region encoding the Sp-kirrelL 5′-UTR (Figure 4A, Figure 4—figure supplement 1A, and Figure 4—figure supplement 4A). When tested in the EpGFPII plasmid, we found that a 301-bp region surrounding the transcriptional start site, a region we considered to include the Sp-kirrelL core promoter, drove ectopic GFP expression. As shown below, however, the same element failed to drive significant reporter expression in a BAC construct, indicating that the activity of the 310-bp element in EpGFPII was the result of abnormal synergy between the Sp-kirrelL and Sp-endo16 promoters. We next performed mutational analysis of the minimal element G fragment that drove strongest PMC-specific GFP expression (G.ATAC). We determined that this CRE receives direct and positive inputs from Alx1 and Ets1, similar to the C.ChIP element (Figure 4B, Figure 4—figure supplement 2, and Figure 4—figure supplement 4B). For two constructs in which all Alx1- or all Ets1-binding sites were mutated, the difference in the numbers of embryos that exhibited PMC-specific versus ectopic expression as compared to the parental G.ATAC construct (see Figure 2—source data 1) was highly significant by a chi-square test (p < 0.001). Reporter constructs with mutated CEBPA-, Fos::Jun-, Fox-, MEIS-, or Tbrain-binding sites exhibited PMC-specific GFP expression similar to that of the parental construct. We also injected the different Sp-kirrelL element G truncations into fertilized L. variegatus eggs and observed similar expression patterns, indicating that inputs into element G are conserved in these two sea urchin species (Figure 4—figure supplement 1B and Figure 4—figure supplement 4C).

Figure 4. Molecular dissection and mutation of element G.

(A) Summary of GFP expression regulated by element G truncations using EpGFPII reporter constructs. Serial truncation of element G was performed based on boundaries defined by chromatin accessibility and the kirrelL 5′-UTR. Criteria for strong and weak primary mesenchyme cell (PMC) expression are defined in Figure 2. Ectopic expression is defined as majority of injected embryos exhibiting GFP expression in cells other than PMCs. (B) Summary of GFP expression driven by G.ATAC element mutants using EpGFPII reporter constructs. (C) Analysis of element enhancer activity in modified EpGFPII reporter constructs containing the endogenous Sp-kirrelL promoter elements.

Figure 4.

Figure 4—figure supplement 1. Element G truncation and mutational analysis.

Figure 4—figure supplement 1.

(A) Spatial expression patterns of GFP reporter constructs containing element G truncations in S. purpuratus embryos at 48 hpf. (B) Spatial expression patterns of GFP reporter constructs containing element G truncations in L. variegatus embryos at 28 hpf. Representative images of primary mesenchyme cell (PMC)-specific and ectopic GFP expression are shown for some constructs. Top rows: GFP fluorescence. Bottom rows: GFP fluorescence overlayed onto differential interference contrast (DIC) images. Scale bar: 50 μm.
Figure 4—figure supplement 2. Mutational analysis of G.ATAC element.

Figure 4—figure supplement 2.

(A) Clustal alignment of Sp-kirrelL and Lv-kirrelL G.ATAC sequences. Violet shading indicates conserved sequences. Red boxes highlight putative transcription factor-binding sites. Mutations generated in binding sites are indicated in red letters below the aligned sequences. (B) Spatial expression pattern of GFP reporter constructs containing different G.ATAC element mutants. Top row: GFP fluorescence. Bottom row: GFP fluorescence overlayed onto differential interference contrast (DIC) images. Scale bar: 50 μm.
Figure 4—figure supplement 3. Interactions between Sp-kirrelL cis-regulatory elements (CREs) and the endogenous Sp-kirrelL promoter.

Figure 4—figure supplement 3.

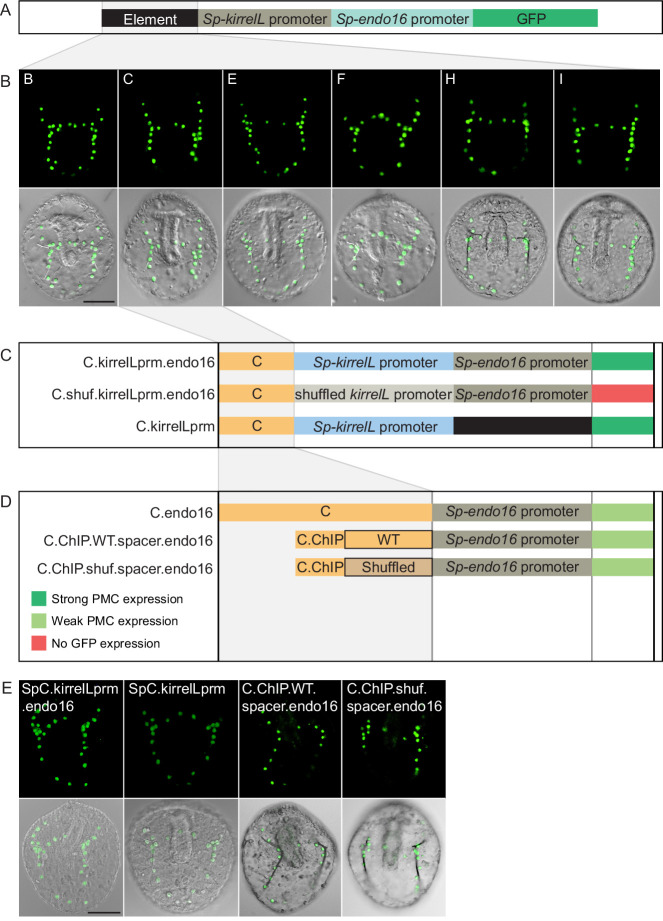
(A) Diagram showing the backbone of a modified, EpGFPII reporter construct containing the endogenous Sp-kirrelL promoter upstream of the Sp-endo16 promoter. (B) Spatial expression patterns of the modified GFP reporter constructs containing the various Sp-kirrelL elements indicated (elements B, C, E, F, H, and I). (C) Analysis of C element enhancer activity in modified EpGFPII reporter constructs. (D) Analysis of C.ChIP element enhancer activity in constructs containing wild-type (WT) or shuffled C element spacer sequences. Criteria for strong and weak primary mesenchyme cell (PMC) expression are defined in Figure 2. (E) Spatial expression patterns of the GFP reporter constructs. Top rows: GFP fluorescence. Bottom rows: GFP fluorescence overlayed onto differential interference contrast (DIC) images. Scale bar: 50 μm.
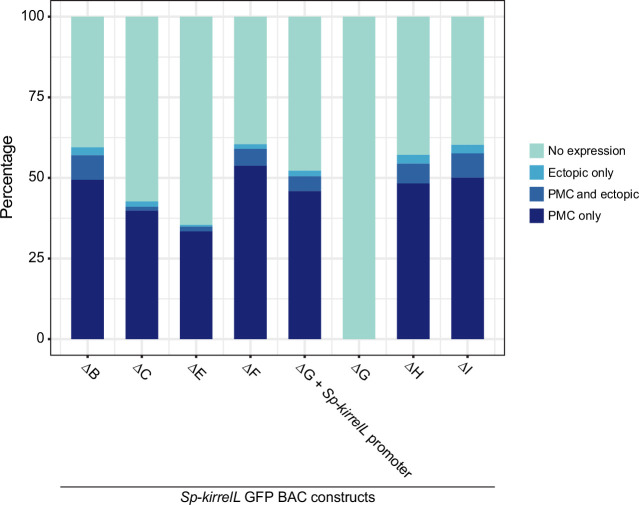
Figure 4—figure supplement 4. Stacked bar plots showing summary of GFP expression patterns of injected embryos scored at 48 hpf.
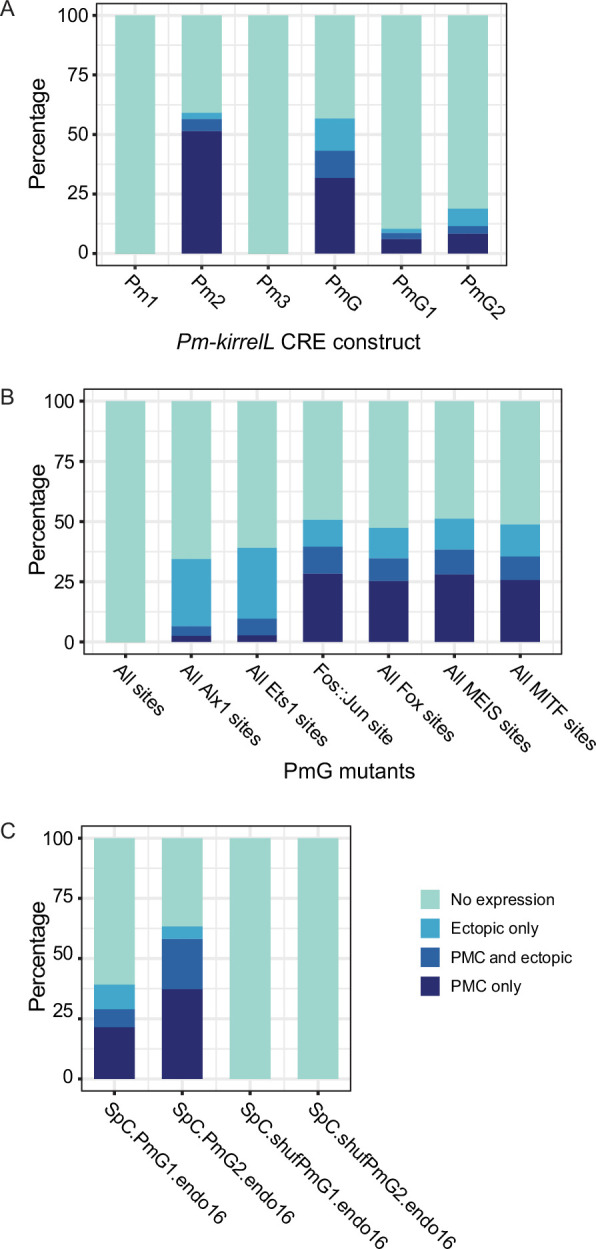
Figure 4—figure supplement 4.

Each spatial expression category is expressed as a percentage of total injected embryos. (A) GFP spatial expression patterns of transgenic embryos injected with element G and truncation of element G mutant reporter constructs. (B) GFP spatial expression patterns of embryos injected with reporter constructs containing G.ATAC and G.ATAC with different transcription factor-binding site mutations. (C) GFP spatial expression patterns of transgenic L. variegatus embryos injected with Sp-kirrelL reporter constructs at 24 hpf. (D) GFP spatial expression patterns of embryos injected with constructs comprising of elements A–G in a modified EpGFPII vector containing the endogenous Sp-kirrelL promoter. (E) GFP spatial expression patterns of embryos injected with reporter constructs containing C.ChIP and wild-type (WT) or shuffled spacer sequences.

Our analysis of the native Sp-kirrelL promoter prompted us to investigate whether the addition of this region to our EpGFPII reporter constructs would allow us to uncover interactions between CREs and the native promoter that would have otherwise been missed. Strikingly, we found that elements B, C, E, F, H, and I were individually able to drive strong PMC-specific GFP expression when cloned adjacent to the Sp-kirrelL promoter, although these elements had previously exhibited minimal activity in the context of the Sp-endo16 promoter alone (Figure 4C, Figure 4—figure supplement 3A, B, and Figure 4—figure supplement 4D; compared to Figure 2). As an example, element C in combination with the Sp-endo16 promoter drove GFP expression in only 8.6% of embryos, the Sp-kirrelL promoter region in combination with the Sp-endo16 promoter drove GFP expression in 19% of the embryos, but the combination of element C with the two promoter elements drove expression in 37.8% of embryos (Figure 2—source data 1). The elevated expression of the latter construct indicated that the its activity was not due solely to the additive activity of the C and SpkirrelL promoter elements interacting independently with the Sp-endo16 promoter (37.8 > 8.6 + 19). In addition, we found that the C element exhibited substantial activity in the context of the Sp-kirrelL promoter alone, in the absence of the Sp-endo16 promoter (Figure 4—figure supplement 3). We also observed that the presence of the native Sp-kirrelL promoter mitigated the need for the C.ChIP element within element C to be adjacent to the promoter for strong PMC-specific GFP expression. We confirmed that enhancer activity was dependent on the sequence of the Sp-kirrelL promoter, as GFP expression was abolished in a construct where the sequence was shuffled (Figure 4—figure supplement 3C).

To test whether the effect of deleting the region between C.ChIP and the promoter was due to the removal of repressor sites or to a change in the spacing between C.ChIP and the promoter, we generated and tested a construct that contained the region in question but in which the sequence of that region was randomly scrambled (Figure 4—figure supplement 3D, E and Figure 4—figure supplement 4E). We found that insertion of this sequence decreased activity compared to when C.ChIP was directly adjacent to the promoter. This supports the view that the principle effect of deleting this region was to decrease the spacing between C.Chip and the promoter rather than removing repressor sites. Taken together, these findings showed that several CREs are capable of functioning in concert specifically with the native Sp-kirrelL promoter and that this can bypass spacing hurdles that are evident when the Sp-endo16 promoter alone is present.

Relative contributions of individual CREs in the context of the entire Sp-kirrelL regulatory apparatus

Our analysis identified multiple CREs in the vicinity of the Sp-kirrelL locus that were capable of driving PMC-specific reporter expression when cloned into plasmids that contained the endogenous Sp-kirrelL promoter. To explore further the relative contributions of these various elements to Sp-kirrelL expression in vivo, we examined their function in the context of the complete transcriptional control system of the gene. For these studies, we utilized a 130-kb BAC that contained the single exon Sp-kirrelL gene, flanked by 65 kb of sequences in each direction. We used recombination-mediated genetic engineering (recombineering) to replace the single Sp-kirrelL exon seamlessly with either GFP or mCherry coding sequence (Figure 5A). We found that Sp.kirrelL.mCherry.BAC faithfully recapitulated the expression of endogenous Sp-kirrelL in the PMCs at 48 hpf with minimal ectopic expression (Figure 5—figure supplement 1). We next generated deletion mutants based on results from our plasmid GFP reporter assays to quantitatively assess the contributions of elements A–G to Sp-kirrelL transcriptional regulation. We found that deletion of elements A–G (ΔCRE.GFP.BAC) completely abolished GFP expression. We also observed that retaining the minimal endogenous Sp-kirrelL promoter (ΔCRE.kirrelLprm.GFP.BAC) did not rescue GFP expression, demonstrating that elements A–G are necessary for PMC-specific Sp-kirrelL expression in the context of the Sp.kirrelL.GFP.BAC consistent with our previous, plasmid-based analysis.

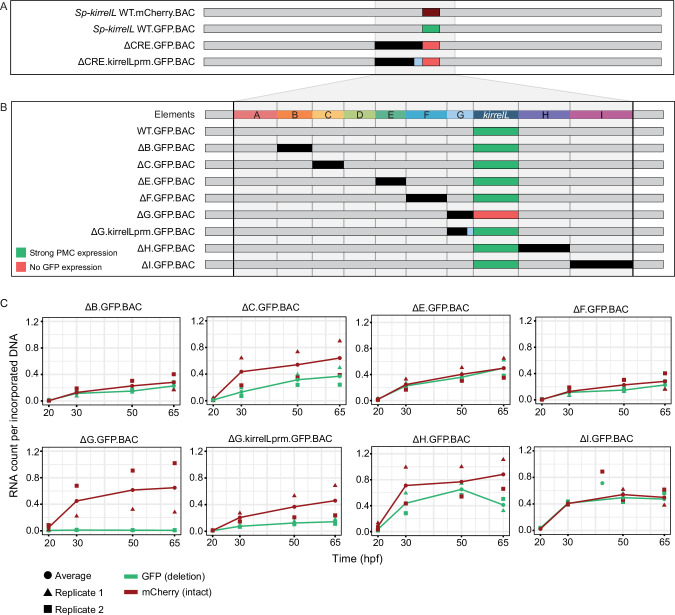
Figure 5. Sp-kirrelL cis-regulatory analysis using BACs.

(A) BAC deletions show that elements A–G are necessary for GFP expression, regardless of the presence of the endogenous Sp-kirrelL core promoter elements. (B) Summary of GFP expression patterns of individual Sp-kirrelL elements using GFP BAC deletions. Criteria for strong primary mesenchyme cell (PMC) expression are defined in Figure 2. (C) Quantitative NanoString analysis of reporter expression in embryos coinjected with parental mCherry and mutant GFP BACs. Embryos were collected at 20, 30, 50, and 65 hpf. The average expression profile for each pair of BAC injection was calculated from NanoString counts of two biological replicates (see Materials and methods).

Figure 5—source data 1. Summary of NanoString analysis.
Figure 5—source data 2. Raw NanoString data for BAC-injected embryos.
Figure 5—source data 3. NanoString analysis probe target sequences.

Figure 5.

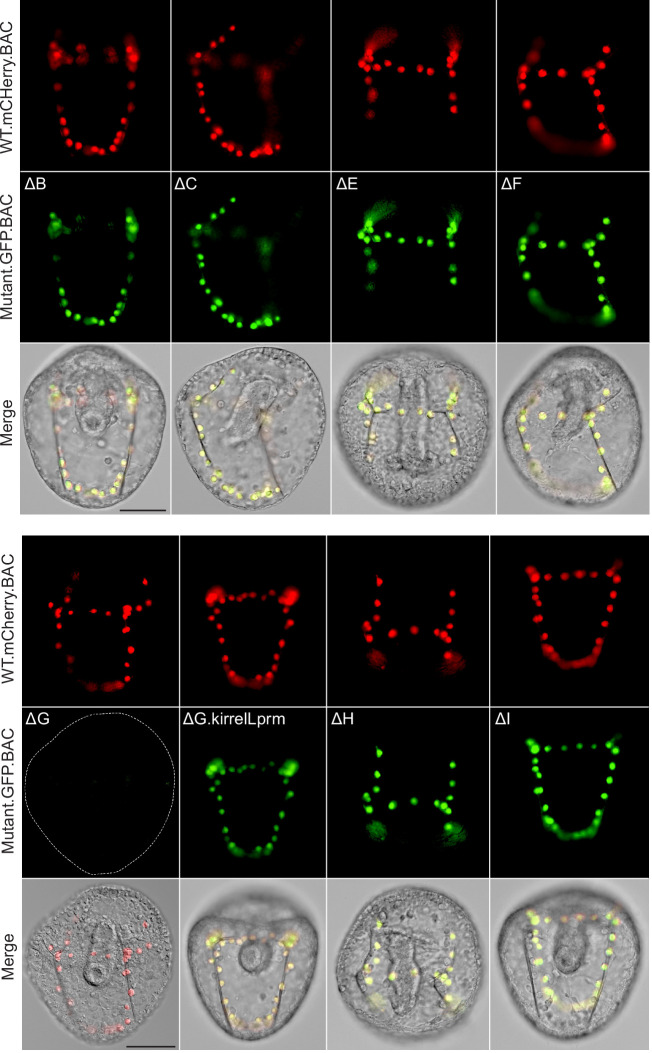
Figure 5—figure supplement 1. Spatial expression patterns of embryos coinjected with parental mCherry and mutant GFP BACs.

Figure 5—figure supplement 1.

Top rows: mCherry fluorescence. Middle rows: GFP fluorescence. Dotted lines show outlines of embryos that did not show GFP expression. Bottom rows: mCherry and GFP fluorescence overlayed onto differential interference contrast (DIC) images. Scale bar: 50 μm.
Figure 5—figure supplement 2. Stacked bar plots showing summary of GFP expression patterns of transgenic embryos injected with Sp-kirrelL GFP BACs containing different element deletions.

Figure 5—figure supplement 2.

Each spatial expression category is expressed as a percentage of total injected embryos.

To directly compare the spatial expression patterns of deletion mutants with that of the parental BAC, we generated BAC mutants containing deletion of individual elements and coinjected them into fertilized eggs with a parental mCherry BAC. We found that a BAC containing deletion of the element G (ΔG.GFP.BAC, which included a deletion of the Sp-kirrelL promoter) abolished GFP expression at 48 hpf (Figure 5B, Figure 5—figure supplement 2). By contrast, deletion of all of element G except for the promoter region (ΔG.kirrelLpromoter.GFP.BAC), resulted in a GFP spatial expression pattern similar to that of the parental mCherry. These findings confirmed the importance of the Sp-kirrelL promoter in supporting PMC-specific expression of the gene and showed that this region is essential even when all distal CREs are present. BACs containing individual deletions of other elements all remained active at 48 hpf and supported PMC-specific reporter expression, pointing to considerable redundancy in the contribution of each element to Sp-kirrelL expression.

To examine the relative contribution of distal CREs more rigorously, we measured levels of reporter transcripts using a NanoString nCounter. For each mutant BAC, we coinjected embryos with mCherry tagged, parental BAC and the GFP-tagged, mutant BAC and quantified the expression level of each reporter gene at four time points (20, 30, 50, and 65 hpf) (Figure 5C and Figure 5—source data 1). We found that deletion of element C resulted in approximately a 50% reduction in expression compared to WT BAC. As we observed previously, GFP expression was completely abolished when element G was deleted (ΔG.GFP.BAC) and this effect was diminished when the Sp-kirrelL promoter was retained (ΔG.kirrelLprm.GFP.BAC). Quantitative analysis revealed, however, that retention of the Sp-kirrelL promoter alone resulted in only a partial rescue of expression, with overall levels reduced substantially compared to the wild-type BAC. We also observed that deletion of element H resulted in decreased expression levels. Deletions of elements A and D were not tested as there was no evidence from our plasmid reporter analysis that these were functional CREs. Taken together, our qualitative and quantitative analyses show that at early stages of embryo development, Sp-kirrelL expression is controlled by multiple CREs, notably the C, G, and H modules, acting in concert with the Sp-kirrelL promoter.

Cross-species analysis of echinoderm kirrelL CREs

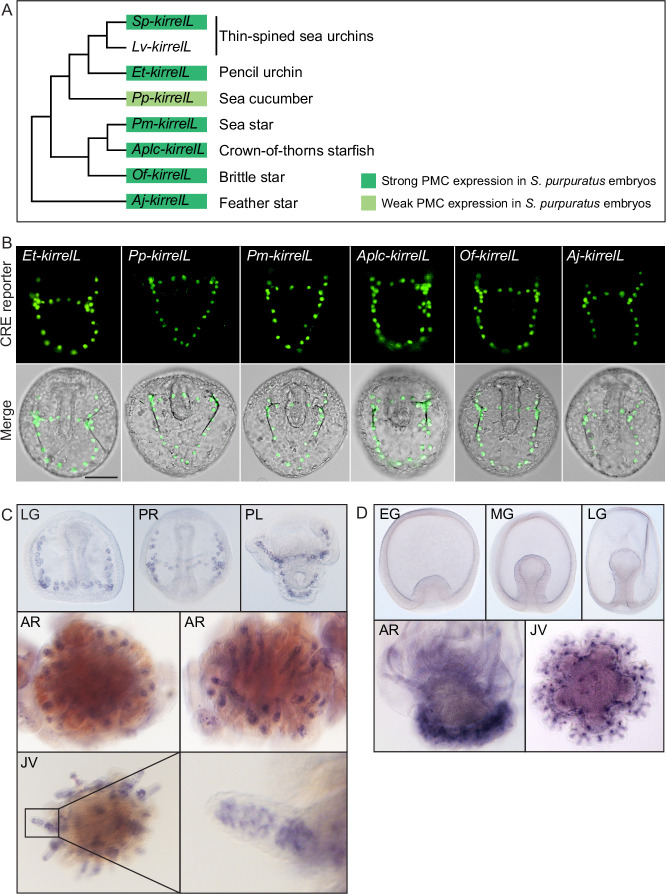
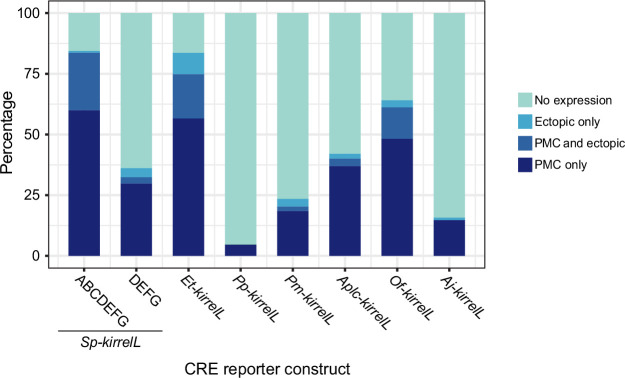
As the noncoding region directly upstream of the translational start site of Sp-kirrelL was found to contain transcriptional control elements, we asked whether sequences upstream of kirrelL genes from other echinoderm classes might contain functionally conserved CREs that have activity in S. purpuratus PMCs. To date, the embryonic expression of kirrelL has been examined in two sea urchins (S. purpuratus and L. variegatus) and a brittle star (A. filiformis) (Dylus et al., 2018; Ettensohn and Dey, 2017); in all three species, embryonic expression is restricted to skeletogenic mesenchyme cells. We cloned ~1- to 2-kb noncoding sequences (see Figure 6—source data 1 and Figure 6—source data 2) directly upstream of the translational start sites of kirrelL genes from Eucidaris tribuloides (pencil urchin), Parastichopus parvimensis (sea cucumber), P. miniata (sea star), Acanthaster planci (crown-of-thorns starfish), Ophionereis fasciata (brittle star), and Anneissia japonica (feather star) into the EpGFPII plasmid and injected them into fertilized S. purpuratus eggs (Figure 6A, Figure 6—figure supplement 1, and Figure 6—figure supplement 2A). Remarkably, we found that all six drove GFP expression in sea urchin embryos, with five out of six exhibiting strong GFP expression selectively in PMCs (Figure 6B and Figure 6—figure supplement 3). Taken together, these observations indicate that kirrelL CREs across echinoderm species are highly conserved in function. We found it particularly striking that kirrelL CREs from deeply divergent echinoderm species that do not form embryonic or larval skeletons (sea stars and feather stars) drive PMC-selective GFP expression in sea urchin embryos.

Figure 6. Cross-species analysis of kirrelL cis-regulatory elements (CREs) from diverse members of the echinoderm phylum.

(A) Phylogenetic relationships of kirrelL genes based on the consensus view of evolutionary relationships among echinoderms. Branch lengths are not drawn to scale. Box colors correspond to expression of GFP in S. purpuratus embryos, driven by noncoding sequences upstream of kirrelL genes of Eucidaris tribuloides (Et-kirrelL), Parastichopus parvimensis (Pp-kirrelL), Patiria miniata (Pm-kirrelL), Acanthaster planci (Aplc-kirrelL), Ophionereis fasciata (Of-kirrelL), and Anneissia japonica (Aj-kirrelL). Criteria for strong and weak primary mesenchyme cell (PMC) expression are defined in Figure 2. (B) Spatial expression patterns of GFP reporter constructs containing kirrelL CREs from other echinoderm species in S. purpuratus embryos at 48 hpf. Top row: GFP fluorescence. Bottom row: GFP fluorescence overlayed onto differential interference contrast (DIC) images. Scale bar: 50 μm. (C) Representative whole-mount in situ hybridization (WMISH) images showing Lv-kirrelL expression during L. variegatus development. (D) Pm-kirrelL expression during P. miniata development. EG, early gastrula; MG, midgastrula; LG, late gastrula; PR, prism stage; PL, pluteus larva; AR, adult rudiment; JV, juvenile stage. All genomic coordinates and DNA sequences for the CREs are shown in Figure 6—source data 2.

Figure 6—source data 1. Sequence coordinates for echinoderm kirrelL cis-regulatory elements (CREs) tested (Arshinoff et al., 2022; Long et al., 2016).
Figure 6—source data 2. DNA sequences for cis-regulatory elements (CREs) validated in this study from Eucidaris tribuloides (Et-kirrelL), Parastichopus parvimensis (Pp-kirrelL), Patiria miniata (Pm-kirrelL), Acanthaster planci (Aplc-kirrelL), Ophionereis fasciata (Of-kirrelL), and Anneissia japonica (Aj-kirrelL).
Figure 6—source data 3. Echinoderm primary mesenchyme cell (PMC)-specific Ig-domain protein sequences from Strongylocentrotus purpuratus (Sp), Lytechinus variegatus (Lv), Eucidaris tribuloides (Et), Parastichopus parvimensis (Pp), Patiria miniata (Pm), Acanthaster planci (Aplc), Ophionereis fasciata (Of), and Anneissia japonica (Aj) used for tree construction.

Figure 6.

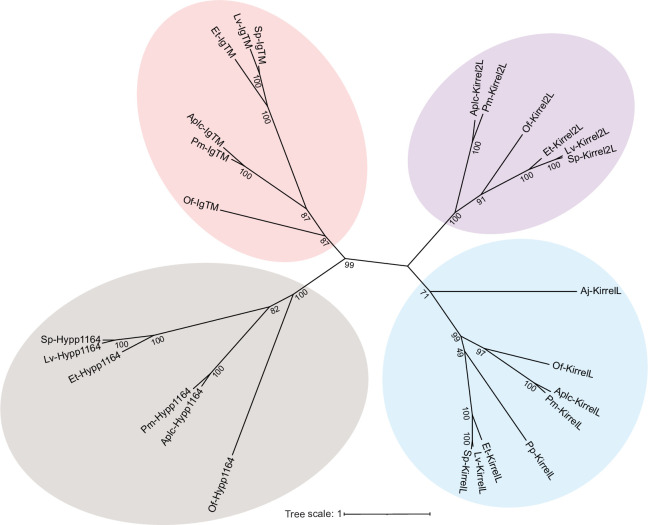
Figure 6—figure supplement 1. Unrooted, maximum likelihood tree showing clustering of primary mesenchyme cell (PMC)-specific Ig-domain proteins from different echinoderm species that represent all classes within the phylum.

Figure 6—figure supplement 1.

The evolutionary history was inferred by using the Maximum Likelihood method and JTT matrix-based model (Jones et al., 1992). There were 26 protein sequences and all positions with less than 90% site coverage were eliminated (partial deletion). There was a total of 463 positions in the final dataset. Evolutionary analyses were conducted in MEGA X (Kumar et al., 2018; Stecher et al., 2020). Only bootstrap values greater than 45 were shown. Bootstrap replicates: 1000. Strongylocentrotus purpuratus (Sp), Lytechinus variegatus (Lv), Eucidaris tribuloides (Et), Parastichopus parvimensis (Pp), Patiria miniata (Pm), Acanthaster planci (Aplc), Ophionereis fasciata (Of), and Anneissia japonica (Aj). All protein sequences used for tree building are shown in Figure 6—source data 3.
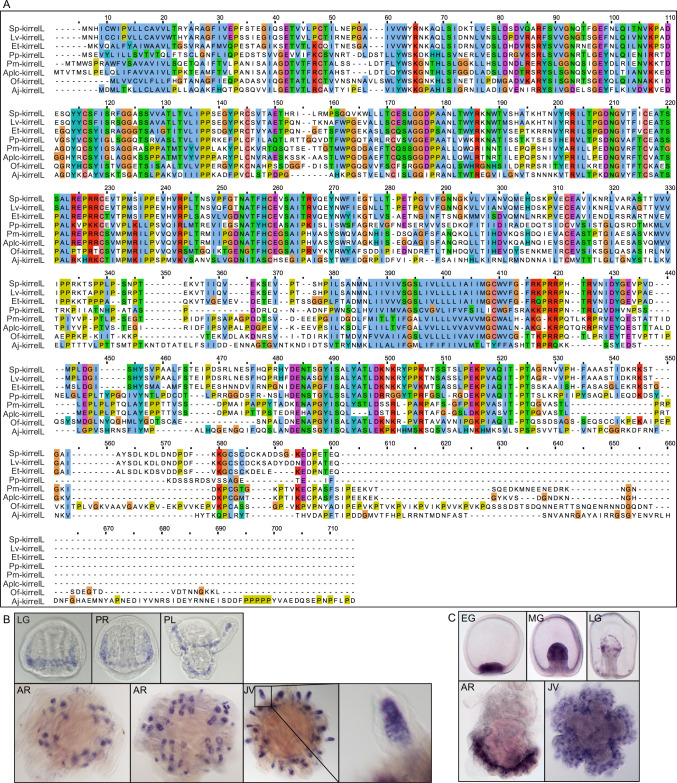
Figure 6—figure supplement 2. Alignment of echinoderm KirrelL proteins and representative whole-mount in situ hybridization (WMISH) images of positive control probes.

Figure 6—figure supplement 2.

(A) Clustal alignment of echinoderm KirrelL proteins from Eucidaris tribuloides (Et-KirrelL), Parastichopus parvimensis (Pp-KirrelL), Patiria miniata (Pm-KirrelL), Acanthaster planci (Aplc-KirrelL), Ophionereis fasciata (Of-KirrelL), and Anneissia japonica (Aj-KirrelL). Colors correspond to the Clustal default residue coloring scheme. (B) Lv-msp130r2 expression during L. variegatus development. (C) Pm-ets1 expression during P. miniata development. EG, early gastrula; MG, midgastrula; LG, late gastrula; PR, prism stage; PL, pluteus larva; AR, adult rudiment; JV, juvenile stage. All protein sequences used for Clustal alignment are shown in Figure 6—source data 3.
Figure 6—figure supplement 3. Stacked bar plots showing summary of GFP expression patterns of transgenic S. purpuratus embryos injected with constructs containing noncoding sequences upstream of kirrelL genes of Eucidaris tribuloides (Et-kirrelL), Parastichopus parvimensis (Pp-kirrelL), Patiria miniata (Pm-kirrelL), Acanthaster planci (Aplc-kirrelL), Ophionereis fasciata (Of-kirrelL), and Anneissia japonica (Aj-kirrelL).

Figure 6—figure supplement 3.

Each spatial expression category is expressed as a percentage of total injected embryos.

Although KirrelL has been shown to be an important morphoeffector gene in the sea urchin embryo, where it plays an essential role in PMC–PMC fusion, its expression in adult sea urchins has not been examined. We observed Lv-kirrelL expression in the skeletogenic centers of the adult rudiment and in the spine of 5-week-old juvenile sea urchins (Figure 6C). The expression pattern of Lv-kirrelL was very similar to that of Lv-msp130r2, a highly expressed biomineralization gene (Figure 6—figure supplement 2B). In contrast, expression of Pm-kirrelL was not detected during early embryonic and larval development in P. miniata, which does not from a larval skeleton (Figure 6D). Pm-kirrelL is, however, expressed in the developing adult rudiment in premetamorphic, late-stage sea star larva and in the adult skeletogenic centers in juvenile sea stars (Figure 6D). As a control, we showed Pm-ets1 expression in the mesenchyme cells during early development and an expression pattern in the adult rudiment and skeletogenic centers in juvenile sea stars that closely resembled that of Pm-kirrelL (Figure 6—figure supplement 2C).

Dissection of a candidate adult skeletogenic CRE

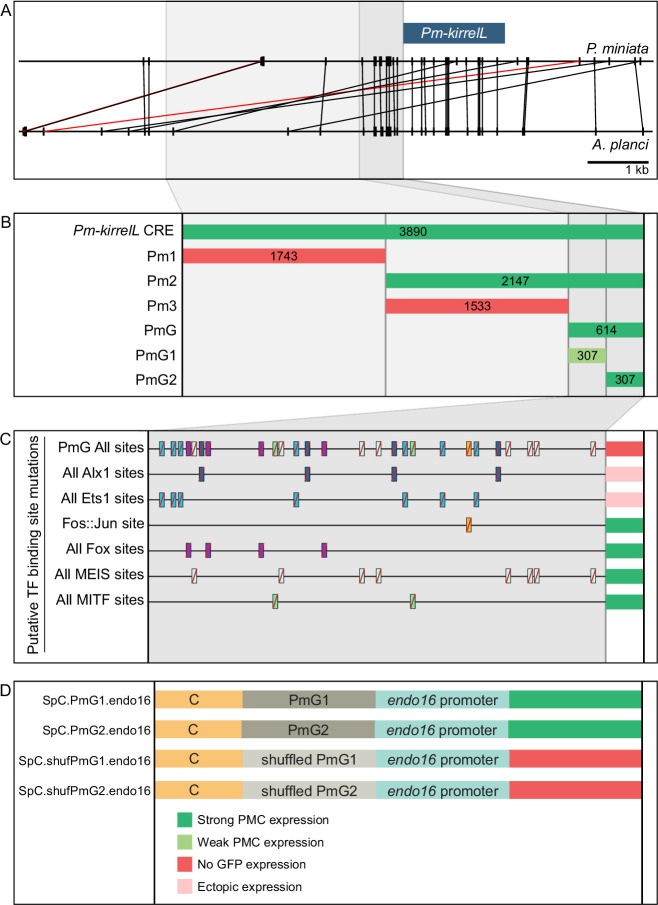
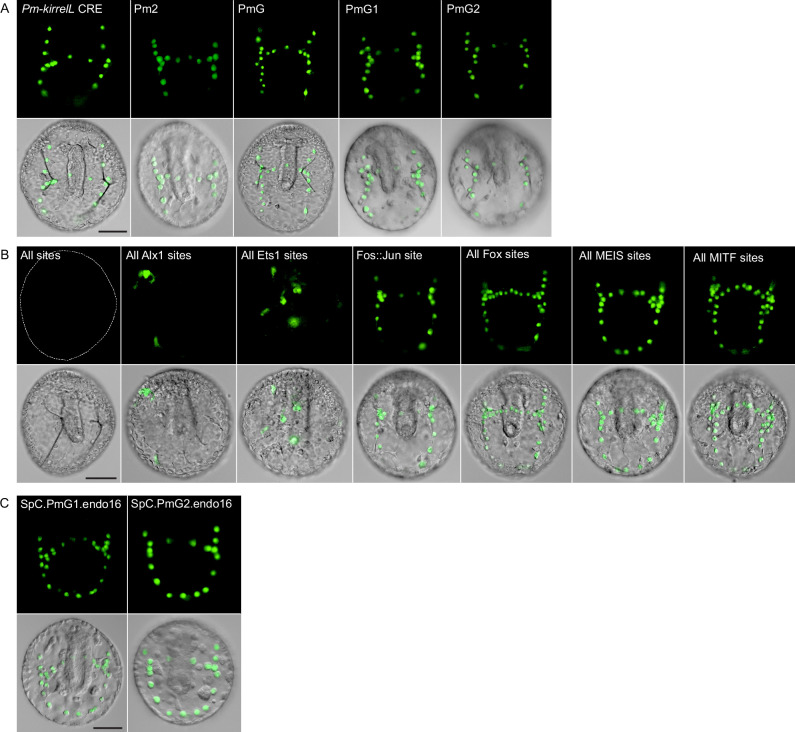
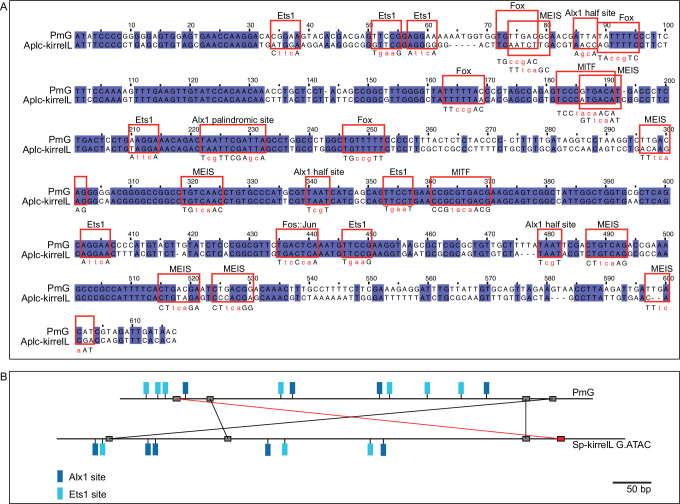
As sea stars do not form a larval skeleton but express kirrelL specifically in adult skeletogenic centers, we exploited the activity of the Pm-kirrelL CRE in sea urchin embryos as a potential proxy for identifying transcriptional inputs that ordinarily control this gene in adult echinoderms (see Discussion). We performed truncations and mutations of the regulatory regions upstream of the Pm-kirrelL gene to identify direct transcriptional inputs (Figure 7A and B). Subdivision of the ~4 kb Pm-kirrelL regulatory region showed that activity was restricted to the proximal region (Pm2), and further analysis revealed that a 614-bp region (PmG) was sufficient to drive strong PMC-specific GFP expression in S. purpuratus embryos (Figure 7B, Figure 7—figure supplement 1A, and Figure 7—figure supplement 2A). Phylogenetic footprinting of genomic sequences from P. miniata and the closely related crown-of-thorns starfish (A. planci) showed substantial similarity in this region (Figure 7A). We performed mutational analysis of the PmG element and found that this CRE receives positive inputs from both Alx1 and Ets1 (Figure 7C, Figure 7—figure supplement 1B, Figure 7—figure supplement 2B, and Figure 7—figure supplement 3A, B), similar to the Sp-kirrelL C and G.ATAC elements. For two constructs in which all Alx1- or all Ets1-binding sites were mutated, the difference in the numbers of embryos that exhibited PMC-specific versus ectopic expression as compared to the parental PmG construct (see Figure 2—source data 1) was highly significant by a chi-square test (p < 0.001).

Figure 7. Functional analysis of noncoding genomic sequences upstream of Pm-kirrelL to identify cis-regulatory elements (CREs).

(A) Phylogenetic footprinting of genomic sequences near P. miniata and A. planci kirrelL using GenePalette. Black lines indicate identical sequences of 13 bp or longer in the same orientation while red lines indicate identical sequences of 13 bp or longer in the opposite orientation. (B) Summary of GFP expression regulated by noncoding sequences upstream of the Pm-kirrelL translational start site. (C) Summary of GFP expression driven by PmG element mutants. (D) Summary of GFP expression regulated by chimeric reporter constructs containing Sp-kirrelL element C and Pm-kirrelL G1 or G2 elements. Criteria for strong and weak primary mesenchyme cell (PMC) expression are defined in Figure 2. Ectopic expression is defined as majority of injected embryos exhibiting GFP expression in cells other than PMCs.

Figure 7.

Figure 7—figure supplement 1. Sea star Pm-kirrelL cis-regulatory element (CRE) truncation and mutational analysis.

Figure 7—figure supplement 1.

(A) Spatial expression patterns of GFP reporter constructs containing Pm-kirrelL truncations in S. purpuratus embryos at 48 hpf. (B) Spatial expression patterns of GFP reporter constructs containing sea star PmG element mutants in S. purpuratus embryos at 48 hpf. (C) Spatial expression patterns of chimeric reporter constructs containing Sp-kirrelL element C and Pm-kirrelL G1 or G2 elements. Dotted lines show outlines of embryos that did not show GFP expression. Top rows: GFP fluorescence. Bottom rows: GFP fluorescence overlayed onto differential interference contrast (DIC) images. Scale bar: 50 μm.
Figure 7—figure supplement 2. Stacked bar plots showing summary of GFP expression patterns of injected embryos scored at 48 hpf.

Figure 7—figure supplement 2.

Each spatial expression category is expressed as a percentage of total injected embryos. (A) GFP spatial expression patterns of transgenic embryos injected with Pm-kirrelL cis-regulatory element (CRE) reporter constructs. (B) GFP spatial expression patterns of embryos injected with PmG transcription factor-binding site mutant constructs. (C) GFP spatial expression patterns of embryos injected with constructs containing Sp-kirrelL C element with wild-type (WT) or shuffled Pm-kirrelL PmG1 or PmG2.
Figure 7—figure supplement 3. Mutational analysis of the sea star P. miniata kirrelL element G (PmG).

Figure 7—figure supplement 3.

(A) Clustal alignment of PmG and homologous sequences from crown-of-thorns starfish A. planci kirrelL element G (Aplc-kirrelL.G). Red boxes highlight putative transcription factor-binding sites. Sequences in red indicate transcription factor-binding site mutations that were generated. (B) Phylogenetic footprinting of PmG and Sp-kirrelL G.ATAC using GenePalette. Black lines indicate identical sequences of 9 bp or longer in the same orientation while red lines indicate identical sequences of 9 bp or longer in the opposite orientation.
Figure 7—figure supplement 4. Effects of Sp-alx1 and Sp-ets1 knockdown on transgenic Sp-kirrelL cis-regulatory element (CRE) reporter construct expression.

Figure 7—figure supplement 4.

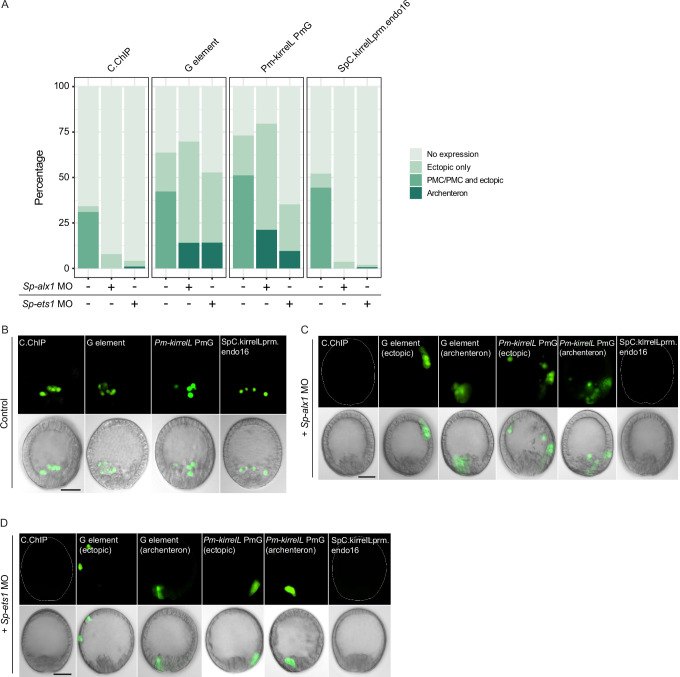
(A) Stacked bar plot showing a summary of GFP expression patterns of embryos coinjected with morpholino and reporter constructs. Each spatial expression category is expressed as a percentage of total injected embryos. Representative images of primary mesenchyme cell (PMC)-specific and ectopic GFP expression in control embryos (B), Sp-alx1 morphants (C), and Sp-ets1 morphants (D). Dotted lines show outlines of embryos that did not exhibit GFP expression. Top row: GFP fluorescence. Bottom row: GFP fluorescence overlayed onto differential interference contrast (DIC) images. Scale bar: 20 μm.

We next asked whether PmG1 and PmG2 elements, which are located near the Pm-kirrelL transcriptional start site, could interact with distal Sp-kirrelL elements, thereby substituting for the endogenous Sp-kirrelL promoter. For this analysis, we generated chimeric EpGFPII reporter constructs that contained the sea urchin Sp-kirrelL element C (SpC) adjacent to the sea star PmG1 or PmG2 element (Figure 7D). We found that PmG1 and PmG2 were both interchangeable with the Sp-kirrelL promoter and that interactions between SpC and PmG1 or PmG2 supported strong PMC-specific GFP expression in S. purpuratus embryos (Figure 7—figure supplement 1C and Figure 7—figure supplement 2C). PmG1 and PmG2 each conferred a roughly similar increase in expression frequency and specificity to element C as the Sp-kirrelL promoter region (Figure 2—source data 1). In a construct containing a PmG2 element with shuffled sequence, GFP expression was abolished. Additionally, we examined the effects of Sp-alx1 and Sp-ets1 knockdown on the activity of the P. miniata regulatory region and the S. purpuratus C and G elements (Figure 7—figure supplement 4). We confirmed that knockdown of Alx1 or Ets1 expression substantially suppresses the activity of all constructs in PMCs. These observations highlight a striking conservation of sequence and function in kirrelL promoters from deeply divergent echinoderm species.

Discussion

Linking developmental GRNs to morphogenesis

Recent studies with echinoderms have elucidated the architecture of developmental GRNs, including the GRN deployed specifically in embryonic skeletogenic mesenchyme of sea urchins (Shashikant et al., 2018a). Although these studies have focused largely on interactions among regulatory genes that constitute the core of such networks, the importance of GRNs from a developmental perspective is that they underlie the dramatic anatomical changes that characterize embryogenesis (Ettensohn, 2013; Smith et al., 2018). In that respect, GRNs have considerable power in explaining the transformation of genotype into phenotype. Moreover, if GRNs are to be useful in understanding the evolution of morphology, currently a major goal of comparative GRN biology, the developmental mechanisms by which these genetic networks drive morphology must be addressed. This work seeks to partially fill this conceptual gap by elucidating the transcriptional control of Sp-kirrelL, an effector gene required for cell–cell fusion, an important morphogenetic behavior of PMCs.

The cis-regulatory apparatus of Sp-kirrelL

The combinatorial control of CRE function is important for driving complex gene expression patterns during animal development. In the present study, we identified key regulatory elements and transcription factor inputs that control Sp-kirrelL expression. Using plasmid reporter constructs, we identified seven CREs (elements B, C, E, F, G, H, and I) that were individually sufficient to drive strong PMC-specific GFP expression when placed adjacent to the native Sp-kirrelL promoter. Most of these same elements failed to drive reporter expression at detectable levels, however, when cloned directly adjacent to the 140-bp Sp-endo16 core promoter, a component of EpGFPII, a vector widely used for cis-regulatory analysis in sea urchins. As proximal promoter elements have been shown to tether more distal elements in other organisms (Calhoun et al., 2002), we hypothesize that such tethering activity is present in the 301-bp Sp-kirrelL promoter element contained in element G. Tethering activity would also account for the fact the regulatory sites in the C element (i.e., those contained in C.ATAC and C.ChIP) must be in close proximity to the Sp-endo16 promoter to activate transcription, while these same sites can function at a greater distance when working in concert with the endogenous Sp-kirrelL promoter. These findings highlight the potential limitations of transgenic reporter assays that rely exclusively on exogenous and/or core promoters.

As multiple CREs were capable of supporting PMC-specific reporter expression in combination with the Sp-kirrelL promoter, we performed BAC deletion analysis to determine the relative contributions of these elements to Sp-kirrelL expression. We quantified reporter expression using a newly developed, Nanostring-based assay that allowed us to measure the extent of transgene incorporation and reporter expression. We found that a single deletion of elements A–G entirely abolished GFP expression, even in the presence of the native Sp-kirrelL promoter, pointing to this region as the major regulatory apparatus of the gene and demonstrating that any CREs outside this region (including elements H and I) are insufficient to support transcription during embryogenesis. Consistent with plasmid reporter assays, our quantitative BAC analysis confirmed that elements C and G both make major contributions to Sp-kirrelL expression. Furthermore, we confirmed that the Sp-kirrelL native promoter is required for BAC reporter activity, also consistent with our plasmid reporter assays and with the hypothesis that the CREs are brought into physical contact with the promoter by chromatin looping during transcription. We observed that deletion of element H, which consisted of the Sp-kirrelL 3′-UTR, also resulted in decreased expression of the BAC reporter at 30 and 65 hpf. Although an exogenous polyadenylation site was inserted at the 3′ end of the reporter coding sequence during BAC recombineering and was therefore present in all constructs, we cannot exclude the possibility that transcription extended beyond this site and that deletion of the 3′-UTR influenced the processing or stability of the Sp-kirrelL transcript rather than transcription.

Elements B, E, F, and I each drove PMC-specific reporter expression in plasmid constructs that contained the Sp-kirrelL promoter, but deletion of these elements individually from the Sp-kirrelL BAC did not quantitatively affect reporter expression at the developmental stages we examined. There are several possible explanations for this. First, these CREs may have no regulatory function in vivo. According to this view, the transcriptional activity of these elements in plasmid constructs was an artifact of bringing them in close proximity to the native Sp-kirrelL promoter. This view is inconsistent, however, with the fact that most of these elements (B, E, and I) contain other signatures of enhancer activity. All three elements are hyperaccessible in PMCs relative to other cell types at 24 hpf as assayed by ATAC-seq, and elements E and I are also associated with eRNA signal during early development (Figure 1). Moreover, these elements exhibited some degree of promoter specificity in our reporter assays; that is, they were active in combination with the Sp-kirrelL promoter but not the Sp-endo16 core promoter. These findings suggest that some or all of these elements ordinarily have a regulatory function. They may modulate the precision of Sp-kirrelL expression during early development in subtle ways that our assays did not detect (Lagha et al., 2012) or they may be entirely redundant; that is, deletion of any one of these elements may result in the complete assumption of its function by other elements. This might be the case, for example, if functionally equivalent CREs ordinarily share the Sp-kirrelL promoter. In support of this hypothesis, many examples of functionally redundant enhancers have been described in other model systems (Kvon et al., 2021). Lastly, although these elements are associated with eRNA expression and cell type-specific accessibility early in embryogenesis, their primary function may be to regulate Sp-kirrelL expression during stages of development later than those assayed in this study.

Coregulation of elements C and G by Alx1 and Ets1

The results of both plasmid- and BAC-based reporter assays showed that elements C and G provide crucial inputs into Sp-kirrelL. Detailed dissection of these key elements identified consensus Ets1- and Alx1-binding sites that were essential for activity. This finding was consistent with previous evidence that perturbation of alx1 or ets1 function using antisense morpholinos results in a dramatic reduction of Sp-kirrelL expression (Rafiq et al., 2014). Moreover, ChIP-seq studies have shown that Alx1 binds directly to both elements (Khor et al., 2019). We cannot, however, exclude the possibility that other ETS and homeodomain family members expressed in PMCs (e.g., Erg and Alx4) also bind to these sites. Interestingly, although paired-class homeodomain proteins (including Alx1-related proteins found in vertebrates) are thought to regulate transcription primarily through their binding to palindromic sites that contain inverted TAAT sequences (e.g., ATTANNNTAAT), we identified a half site (ATTA) in element C that was required for activity. This finding supports other recent work which has shown that half sites play a more prominent role in the transcriptional activity of Alx1 than was previously appreciated (Guerrero-Santoro et al., 2021).

Based on gene knockdown studies and the epistatic gene relationships they reveal, Oliveri et al., 2008 proposed that several PMC effector genes are regulated through a feed-forward circuit involving Alx1 and Ets1. They showed that Ets1 positively regulates alx1 and that both regulatory inputs are necessary to drive expression of several biomineralization-related genes. Our findings support such a model and extend it by demonstrating that the topology of this feed-forward regulation is very simple – both Alx1 and Ets1 provide direct, positive inputs into CREs associated with Sp-kirrelL. We identified dual, direct inputs into two different CREs, one associated with the promoter (element G) and a more distal element (element C). Evidence from other recent studies suggest that direct coregulation by Alx1 and Ets1 is a widespread mechanism for controlling PMC effector gene expression. Genome-wide analysis of Sp-Alx1 ChIP-seq peaks located near effector gene targets showed that both Alx1 and Ets1 consensus binding sites were highly enriched in these regions (Khor et al., 2019) and both Alx1- and Ets1-binding sites are enriched in regions of chromatin that are hyperaccessible in PMCs relative to other cell types (Shashikant et al., 2018b). Our analysis of Sp-kirrelL reveals that feed-forward regulation by Alx1 and Ets1 controls not only the expression of biomineralization-related genes but also genes that regulate PMC behavior, thereby integrating these cellular activities.

Davidson, 1986 proposed that sea urchins, ascidians, nematodes, and several other animal groups develop by a so-called ‘Type I’ mechanism, a mode of development characterized by the early embryonic expression of terminal differentiation genes. A prediction of this model is that Type I embryos deploy developmental GRNs that are relatively shallow; that is, there are few regulatory layers between cell specification and cell differentiation. The cis-regulatory control of Sp-kirrelL by Alx1 and Ets1 supports this prediction; both transcription factors are activated during early embryogenesis and provide direct, positive inputs into Sp-kirrelL. Although mutations of other putative transcription factor-binding sites in elements C and G did not result in any noticeable effects on reporter expression in our studies, it should be noted that perdurance of GFP mRNA or protein following activation by early regulatory inputs such as Alx1 and Ets1 might have masked effects of such mutations on later stages of embryogenesis.

Evolutionary conservation of echinoderm kirrelL CREs

All adult echinoderms have elaborate, calcitic endoskeletons, but larval skeletal elements are found only in echinoids, ophiuroids, and holothuroids (the latter form only a very rudimentary larval skeleton). It is widely believed that the adult skeleton was present in the most recent common ancestor of all echinoderms and that larval skeletons arose subsequently through a developmental redeployment of the adult program (see reviews by Cary and Hinman, 2017; Koga et al., 2014; Shashikant et al., 2018a). It is debated, however, whether this redeployment occurred only once, with a subsequent loss of larval skeletons in asteroids, or more than once, with larval skeletons appearing independently in several groups. Our studies establish kirrelL as a component of the ancestral echinoderm skeletogenic GRN, which also included alx1, ets1, and vegfr-10-Ig (Erkenbrack and Thompson, 2019; Shashikant et al., 2018a).

There is abundant evidence that mutations in cis-regulatory sequences contribute to phenotypic evolution (Rebeiz and Tsiantis, 2017; Wray, 2007). At the same time, there are examples of evolutionarily conserved GRN topologies and transcription factor-binding sites, often between relatively recently diverged taxa (e.g., mice and humans) but sometimes more deeply conserved (Rebeiz et al., 2015). In the present study, we showed that noncoding sequences upstream of the translational start sites of kirrelL genes from a diverse collection of echinoderms supported PMC-specific reporter expression in sea urchin embryos. These echinoderms included a crinoid (A. japonica) and two sea stars (A. planci and P. miniata), taxa that diverged from echinoids 450–500 million years ago (Paul and Smith, 1984; Pisani et al., 2012). The deep evolutionary separation of these groups reveals a remarkable conservation of the kirrelL regulatory apparatus over this vast time period. To our knowledge, this is only the second reported case of conserved regulatory element function among deeply divergent echinoderms (Hinman et al., 2007). Although the amino acid sequences of KirrelL proteins are well conserved within the phylum (Figure 6—figure supplement 2A), the sequences of the upstream regulatory regions we identified are more divergent. Despite limited nucleotide sequence conservation, dissection of the Pm-kirrelL regulatory region provided evidence that in sea stars, as in sea urchins, Alx1 and Ets1 provide direct, positive inputs into kirrelL. Moreover, we showed that regulatory elements directly upstream of the Pm-kirrelL translation start site could substitute for the native Sp-kirrelL promoter in supporting the activity of the S. purpuratus C element, an effect that we hypothesize reflects a deep conservation of the binding sites and proteins that mediate CRE-promoter tethering.

The embryonic skeletogenic GRN of sea urchins has been elucidated in considerable detail, but analysis of the ancestral, adult program has this far been limited to comparative gene expression studies, as there are several technical hurdles to molecular perturbations of adult echinoderms. Because sea stars do not express kirrelL at embryonic stages and lack a larval skeleton, but express kirrelL in adult skeletogenic centers, we conclude that the function of the sea star kirrelL cis-regulatory system is to control the transcription of this gene in the adult. Thus, our identification of Alx1 and Ets1 inputs into the Pm-kirrelL regulatory region provides evidence that these inputs are required in skeletal cells of the adult sea star, consistent with the finding that both Ets1 and Alx1 are expressed selectively by these cells (Gao and Davidson, 2008). We cannot exclude the possibility that the regulatory interactions we detected in the context of the S. purpuratus embryo are vestiges of an ancient, larval skeletogenic program that has since been lost in sea stars, if indeed this was the evolutionary trajectory of larval skeletogenesis within echinoderms. This interpretation, however, would require the evolutionary conservation of the relevant regulatory DNA sequences over a vast period of time despite their complete lack of function, a scenario that seems very unlikely. We propose instead that our findings provide the first glimpse of functional gene interactions in the ancestral, adult echinoderm skeletogenic program and highlight the remarkable conservation of this program in adults and embryos. As Ets1 is expressed in the embryonic mesenchyme of modern sea stars (Koga et al., 2010; McCauley et al., 2010), our findings support the view that a major event in the co-option of the adult skeletogenic GRN into the embryo was a heterochronic shift in the expression of Alx1. This would have been sufficient to transfer a large part of the skeletogenic GRN into the embryo, as the transcription of many key effector genes, including kirrelL, was already directly linked to Alx1 and Ets1 expression. Direct analysis of CRE structure and function in the adult skeletogenic centers of sea stars and sea urchins will be required to more fully elucidate the architecture of the ancestral network.

Materials and methods

Animals

Adult S. purpuratus and P. miniata were acquired from Patrick Leahy (California Institute of Technology, USA). Adult L. variegatus were acquired from the Duke University Marine Laboratory (Beaufort, NC, USA) and from Pelagic Corp. (Sugarloaf Key, FL, USA). Spawning of gametes was induced by intracoelomic injection of 0.5 M KCl. S. purpuratus and P. miniata embryos were cultured in artificial seawater (ASW) at 15°C in temperature-controlled incubators while L. variegatus embryos were cultured at 19–24°C. Late-stage L. variegatus and P. miniata larvae were fed with Rhodomonas lens algae, accompanied by water changes every other day.

Generation of cis-regulatory reporter constructs

Phylogenetic footprinting between echinoderm kirrelL loci was performed using GenePalette (Smith et al., 2017) with a sliding window size of 13–15 bp. GFP reporter constructs were generated by cloning putative CREs into the EpGFPII plasmid, which contains the basal promoter of Sp-endo16 (Cameron et al., 2004). Putative Sp-kirrelL CREs were amplified from S. purpuratus genomic DNA using primers with restriction site overhangs (see Figure 6—source data 1). CREs with mutations of putative transcription factor-binding sites and putative CREs from echinoderm species were synthesized as gBlock gene fragments with flanking restriction sites by Integrated DNA Technologies (Coralville, IA, USA). Sequences of putative CREs from echinoderm species (other than sea urchins) were located directly upstream of the kirrelL gene translational start sites (see Figure 6—source data 2; Arshinoff et al., 2022; Long et al., 2016).

BAC recombineering

Sp-KirrelL BAC-GFP reporter constructs were generated from a parental BAC (R3-28J10-14544) according to established recombineering protocols (Buckley et al., 2018). The recombineering cassettes were synthesized by Integrated DNA Technologies (Coralville, IA, USA). The cassettes contained GFP coding sequence, SV40 terminator sequence, a kanamycin resistance gene between two flippase recognition target sites and flanking homologous arms. The recombineering cassettes were transformed into EL250 cells carrying the parental BAC (pBACe3.6 vector harboring Sp-kirrelL and flanking genomic sequences) and recombinase genes were derepressed via heat shock. EL250 cells with recombinant BACs were selected based on kanamycin resistance. To remove the kanamycin resistance gene, expression of flippase (flp) recombinase enzyme was induced using L-(+)-arabinose and colonies with the kanamycin resistance gene removed were identified by replica plating. BACs without kanamycin resistance gene were subsequently electroporated and propagated in DH10β cells.

Microinjection

Microinjection of reporter constructs was performed following established protocols (Arnone et al., 2004). Prior to injection, reporter constructs were linearized and mixed with carrier DNA that was prepared by overnight HindIII digestion of S. purpuratus or L. variegatus genomic DNA. BAC and plasmid constructs were linearized with AscI and KpnI restriction enzymes, respectively. Each 20 µl injection solution contained 100 ng linearized DNA, 500 ng carrier DNA, 0.12 M KCl, 20% glycerol, 0.1% Texas Red dextran in DNAse-free, sterile water. S. purpuratus embryos were cultured for 48 hpf and L. variegatus were cultured for 28 hpf before being mounted for live imaging. Embryos were scored to determine the total number of injected embryos (indicated by the presence of Texas Red dextran), the number of embryos showing PMC-specific GFP expression, the number of embryos showing PMC and ectopic GFP expression, and the number of embryos with only ectopic GFP expression. Microinjection of morpholinos (MOs) (Gene Tools, LLC, Philomath, OR, USA) into fertilized sea urchin eggs was performed as described (Cheers and Ettensohn, 2004). MO sequences (5′– 3′) were: Sp-alx1 MO, TATTGAGTTAAGTCTCGGCACGACA; Sp-ets1 MO, GAACAGTGCATAGACGCCATGATTG. MOs were injected at concentrations of 3 mM (Sp-alx1 MO) and 2 mM (Sp-ets1 MO).

NanoString analysis

Direct quantitative measurement of GFP and mCherry RNA transcripts and incorporated DNA was performed using the Nanostring nCounter Elements XT protocol. Briefly, a pair of target-specific oligonucleotide pairs (Probes A and B) complementary to each target gene and transcript were synthesized by Integrated DNA Technologies (Coralville, IA, USA). Probes A and B also included short tails complementary to NanoString Reporter Tags and Universal Capture Tags, respectively. RNA targets included GFP, mCherry, and several S. purpuratus housekeeping genes (foxJ1, hlf, kazL, and rasprp3) that represented a range of transcript abundances and that were expressed at constant levels over the developmental time window of interest. DNA targets included GFP, mCherry, several endogenous, single-copy genes (hypp_1164, hypp_1901, hypp_2956, hypp_592, kirrelL), and one multicopy gene (pmar1). DNA probes were complementary to the noncoding DNA strand to avoid hybridization to RNA. Probe sequences are available in Figure 5—source data 3. For detection, we used the NanoString Elements XT Reporter Tag Set-12 and Universal Capture Tag.

Embryos injected with parental and mutant BACs were harvested at 20, 30, 50, and 65 hpf using the Qiagen AllPrep DNA/DNA micro kit. An additional on-column DNase treatment was included in the RNA recovery process to remove contaminating DNA. Genomic DNA extracted was sonicated using a Bioruptor Pico (Diagenode) for 6 min (30 s ON, 30 s OFF) at 4°C to obtain ~200 bp fragments (confirmed using an Agilent Bioanalyzer). Sonicated DNA was extracted using ethanol precipitation. GFP or mCherry RNA counts were first normalized to housekeeping transcript counts. DNA counts were normalized to single-copy gene counts to obtain number of incorporated DNA per nucleus. To obtain RNA count per incorporated DNA for each sample, normalized RNA counts were divided by normalized incorporated DNA counts (Figure 5—source data 1 and Figure 5—source data 2).

Whole-mount in situ hybridization

DNA templates for RNA probe synthesis were amplified with reverse primers that contained T3 promoter. Invitrogen MEGAscript T3 Transcription Kit was then used to amplify digoxigenin-labeled RNA from the DNA templates. WMISH was performed as previously described (Ettensohn et al., 2007), with minor modifications. Embryos were collected fixed at the desired stage and fixed 4% (paraformaldehyde PFA) in ASW for 1 hr at room temperature. The embryos were then washed twice in ASW and permeabilized and stored in with 100% methanol. Embryos were then rehydrated and incubated with 1 ng/µl RNA probe overnight at 55°C. The following day, the embryos were incubated in blocking buffer (1% BSA (bovine serum albumin) and 2% horse serum in PBST (phosphate-buffered saline containing 0.05% Tween-20)) and then in blocking buffer with 1:2000 α-DIG-AP antibody. Excess antibody was washed away and color reaction for alkaline phosphatase was carried out.

Acknowledgements

We are grateful to Dr. Jennifer Guerrero-Santoro for operating the NanoString nCounter. This work was supported by grants from the National Institutes of Health (R24-OD023046) and the National Science Foundation (IOS2004952), both to C.A.E.

Funding Statement

The funders had no role in study design, data collection, and interpretation, or the decision to submit the work for publication.

Contributor Information

Charles A Ettensohn, Email: ettensohn@cmu.edu.

Kathryn Song Eng Cheah, University of Hong Kong, Hong Kong.

Kathryn Song Eng Cheah, University of Hong Kong, Hong Kong.

Funding Information

This paper was supported by the following grants:

  • National Institutes of Health R24-OD023046 to Charles A Ettensohn.

  • National Science Foundation IOS2004952 to Charles A Ettensohn.

Additional information

Competing interests

No competing interests declared.

Author contributions

Conceptualization, Data curation, Formal analysis, Investigation, Methodology, Resources, Validation, Visualization, Writing - original draft.

Conceptualization, Funding acquisition, Supervision, Writing - original draft, Writing - review and editing.

Additional files

Transparent reporting form

Data availability

All raw numerical data used in this study are contained in the manuscript.

The following previously published datasets were used:

Shashikant T, Ettensohn CA, Khor JM. 2018. Global analysis of primary mesenchyme cell cis-regulatory modules by chromatin accessibility profiling. NCBI Gene Expression Omnibus. GSE96927

Khor JM, Guerrero-Santoro J, Douglas W, Ettensohn CA. 2021. Global patterns of enhancer activity during sea urchin embryogenesis assessed by eRNA profiling. NCBI Gene Expression Omnibus. GSE169227

Khor JM, Guerrero-Santoro J, Ettensohn CA. 2019. Genome-wide identification of binding sites and gene targets of Alx1, a pivotal regulator of echinoderm skeletogenesis. NCBI Gene Expression Omnibus. GSE131370

References

  1. Amore G, Davidson EH. cis-Regulatory control of cyclophilin, a member of the ETS-DRI skeletogenic gene battery in the sea urchin embryo. Developmental Biology. 2006;293:555–564. doi: 10.1016/j.ydbio.2006.02.024. [DOI] [PubMed] [Google Scholar]
  2. Arnone MI, Dmochowski IJ, Gache C. Using Reporter Genes to Study Cis-Regulatory ElementsMethods in Cell Biology. Elsevier; 2004. [DOI] [PubMed] [Google Scholar]
  3. Arnone MI, Andrikou C, Annunziata R. Echinoderm systems for gene regulatory studies in evolution and development. Current Opinion in Genetics & Development. 2016;39:129–137. doi: 10.1016/j.gde.2016.05.027. [DOI] [PubMed] [Google Scholar]
  4. Arshinoff BI, Cary GA, Karimi K, Foley S, Agalakov S, Delgado F, Lotay VS, Ku CJ, Pells TJ, Beatman TR, Kim E, Cameron RA, Vize PD, Telmer CA, Croce JC, Ettensohn CA, Hinman VF. Echinobase: leveraging an extant model organism database to build a knowledgebase supporting research on the genomics and biology of echinoderms. Nucleic Acids Research. 2022;50:D970–D979. doi: 10.1093/nar/gkab1005. [DOI] [PMC free article] [PubMed] [Google Scholar]
  5. Baertsch R, Diekhans M, Kent WJ, Haussler D, Brosius J. Retrocopy contributions to the evolution of the human genome. BMC Genomics. 2008;9:466. doi: 10.1186/1471-2164-9-466. [DOI] [PMC free article] [PubMed] [Google Scholar]
  6. Buckley KM, Dong P, Cameron RA, Rast JP. Bacterial artificial chromosomes as recombinant reporter constructs to investigate gene expression and regulation in echinoderms. Briefings in Functional Genomics. 2018;17:362–371. doi: 10.1093/bfgp/elx031. [DOI] [PMC free article] [PubMed] [Google Scholar]
  7. Calhoun VC, Stathopoulos A, Levine M. Promoter-proximal tethering elements regulate enhancer-promoter specificity in the Drosophila Antennapedia complex. PNAS. 2002;99:9243–9247. doi: 10.1073/pnas.142291299. [DOI] [PMC free article] [PubMed] [Google Scholar]
  8. Cameron RA, Oliveri P, Wyllie J, Davidson EH. cis-Regulatory activity of randomly chosen genomic fragments from the sea urchin. Gene Expression Patterns. 2004;4:205–213. doi: 10.1016/j.modgep.2003.08.007. [DOI] [PubMed] [Google Scholar]
  9. Cary GA, Hinman VF. Echinoderm development and evolution in the post-genomic era. Developmental Biology. 2017;427:203–211. doi: 10.1016/j.ydbio.2017.02.003. [DOI] [PubMed] [Google Scholar]
  10. Cheers MS, Ettensohn CA. Rapid microinjection of fertilized eggs. Methods in Cell Biology. 2004;74:287–310. doi: 10.1016/s0091-679x(04)74013-3. [DOI] [PubMed] [Google Scholar]
  11. Cordaux R, Batzer MA. The impact of retrotransposons on human genome evolution. Nature Reviews. Genetics. 2009;10:691–703. doi: 10.1038/nrg2640. [DOI] [PMC free article] [PubMed] [Google Scholar]
  12. Czarkwiani A, Dylus DV, Oliveri P. Expression of skeletogenic genes during arm regeneration in the brittle star Amphiura filiformis. Gene Expression Patterns. 2013;13:464–472. doi: 10.1016/j.gep.2013.09.002. [DOI] [PMC free article] [PubMed] [Google Scholar]
  13. Davidson EH. Gene Activity in Early Development. Orlando: Academic Press; 1986. [DOI] [Google Scholar]
  14. Dermody TS, Kirchner E, Guglielmi KM, Stehle T. Immunoglobulin superfamily virus receptors and the evolution of adaptive immunity. PLOS Pathogens. 2009;5:e1000481. doi: 10.1371/journal.ppat.1000481. [DOI] [PMC free article] [PubMed] [Google Scholar]
  15. Dylus DV, Czarkwiani A, Blowes LM, Elphick MR, Oliveri P. Developmental transcriptomics of the brittle star Amphiura filiformis reveals gene regulatory network rewiring in echinoderm larval skeleton evolution. Genome Biology. 2018;19:26. doi: 10.1186/s13059-018-1402-8. [DOI] [PMC free article] [PubMed] [Google Scholar]
  16. Erkenbrack EM, Thompson JR. Cell type phylogenetics informs the evolutionary origin of echinoderm larval skeletogenic cell identity. Communications Biology. 2019;2:160. doi: 10.1038/s42003-019-0417-3. [DOI] [PMC free article] [PubMed] [Google Scholar]
  17. Ettensohn CA, Illies MR, Oliveri P, De Jong DL. Alx1, a member of the Cart1/Alx3/Alx4 subfamily of Paired-class homeodomain proteins, is an essential component of the gene network controlling skeletogenic fate specification in the sea urchin embryo. Development (Cambridge, England) 2003;130:2917–2928. doi: 10.1242/dev.00511. [DOI] [PubMed] [Google Scholar]
  18. Ettensohn CA, Kitazawa C, Cheers MS, Leonard JD, Sharma T. Gene regulatory networks and developmental plasticity in the early sea urchin embryo: alternative deployment of the skeletogenic gene regulatory network. Development (Cambridge, England) 2007;134:3077–3087. doi: 10.1242/dev.009092. [DOI] [PubMed] [Google Scholar]
  19. Ettensohn CA. Encoding anatomy: developmental gene regulatory networks and morphogenesis. Genesis (New York, N.Y. 2013;51:383–409. doi: 10.1002/dvg.22380. [DOI] [PubMed] [Google Scholar]
  20. Ettensohn CA, Dey D. KirrelL, a member of the Ig-domain superfamily of adhesion proteins, is essential for fusion of primary mesenchyme cells in the sea urchin embryo. Developmental Biology. 2017;421:258–270. doi: 10.1016/j.ydbio.2016.11.006. [DOI] [PubMed] [Google Scholar]
  21. Farré D, Martínez-Vicente P, Engel P, Angulo A. Immunoglobulin superfamily members encoded by viruses and their multiple roles in immune evasion. European Journal of Immunology. 2017;47:780–796. doi: 10.1002/eji.201746984. [DOI] [PubMed] [Google Scholar]
  22. Gao F, Davidson EH. Transfer of a large gene regulatory apparatus to a new developmental address in echinoid evolution. PNAS. 2008;105:6091–6096. doi: 10.1073/pnas.0801201105. [DOI] [PMC free article] [PubMed] [Google Scholar]
  23. Gao F, Thompson JR, Petsios E, Erkenbrack E, Moats RA, Bottjer DJ, Davidson EH. Juvenile skeletogenesis in anciently diverged sea urchin clades. Developmental Biology. 2015;400:148–158. doi: 10.1016/j.ydbio.2015.01.017. [DOI] [PubMed] [Google Scholar]
  24. Guerrero-Santoro J, Khor JM, Açıkbaş AH, Jaynes JB, Ettensohn CA. Analysis of the DNA-binding properties of Alx1, an evolutionarily conserved regulator of skeletogenesis in echinoderms. The Journal of Biological Chemistry. 2021;297:100901. doi: 10.1016/j.jbc.2021.100901. [DOI] [PMC free article] [PubMed] [Google Scholar]
  25. Hinman VF, Nguyen A, Davidson EH. Caught in the evolutionary act: precise cis-regulatory basis of difference in the organization of gene networks of sea stars and sea urchins. Developmental Biology. 2007;312:584–595. doi: 10.1016/j.ydbio.2007.09.006. [DOI] [PubMed] [Google Scholar]
  26. Jones DT, Taylor WR, Thornton JM. The rapid generation of mutation data matrices from protein sequences. Bioinformatics. 1992;8:275–282. doi: 10.1093/bioinformatics/8.3.275. [DOI] [PubMed] [Google Scholar]
  27. Khor JM, Guerrero-Santoro J, Ettensohn CA. Genome-wide identification of binding sites and gene targets of Alx1, a pivotal regulator of echinoderm skeletogenesis. Development (Cambridge, England) 2019;146:dev180653. doi: 10.1242/dev.180653. [DOI] [PubMed] [Google Scholar]
  28. Khor JM, Guerrero-Santoro J, Douglas W, Ettensohn CA. Global patterns of enhancer activity during sea urchin embryogenesis assessed by eRNA profiling. Genome Research. 2021;31:1680–1692. doi: 10.1101/gr.275684.121. [DOI] [PMC free article] [PubMed] [Google Scholar]
  29. Killian CE, Croker L, Wilt FH. SpSM30 gene family expression patterns in embryonic and adult biomineralized tissues of the sea urchin, Strongylocentrotus purpuratus. Gene Expression Patterns. 2010;10:135–139. doi: 10.1016/j.gep.2010.01.002. [DOI] [PubMed] [Google Scholar]
  30. Koga H, Matsubara M, Fujitani H, Miyamoto N, Komatsu M, Kiyomoto M, Akasaka K, Wada H. Functional evolution of Ets in echinoderms with focus on the evolution of echinoderm larval skeletons. Development Genes and Evolution. 2010;220:107–115. doi: 10.1007/s00427-010-0333-5. [DOI] [PubMed] [Google Scholar]
  31. Koga H, Morino Y, Wada H. The echinoderm larval skeleton as a possible model system for experimental evolutionary biology. Genesis (New York, N.Y. 2014;52:186–192. doi: 10.1002/dvg.22758. [DOI] [PubMed] [Google Scholar]
  32. Kumar S, Stecher G, Li M, Knyaz C, Tamura K. MEGA X: Molecular Evolutionary Genetics Analysis across Computing Platforms. Molecular Biology and Evolution. 2018;35:1547–1549. doi: 10.1093/molbev/msy096. [DOI] [PMC free article] [PubMed] [Google Scholar]
  33. Kurokawa D, Kitajima T, Mitsunaga-Nakatsubo K, Amemiya S, Shimada H, Akasaka K. HpEts, an ets-related transcription factor implicated in primary mesenchyme cell differentiation in the sea urchin embryo. Mechanisms of Development. 1999;80:41–52. doi: 10.1016/s0925-4773(98)00192-0. [DOI] [PubMed] [Google Scholar]
  34. Kvon EZ, Waymack R, Gad M, Wunderlich Z. Enhancer redundancy in development and disease. Nature Reviews. Genetics. 2021;22:324–336. doi: 10.1038/s41576-020-00311-x. [DOI] [PMC free article] [PubMed] [Google Scholar]
  35. Lagha M, Bothma JP, Levine M. Mechanisms of transcriptional precision in animal development. Trends in Genetics. 2012;28:409–416. doi: 10.1016/j.tig.2012.03.006. [DOI] [PMC free article] [PubMed] [Google Scholar]
  36. Logan CY, Miller JR, Ferkowicz MJ, McClay DR. Nuclear beta-catenin is required to specify vegetal cell fates in the sea urchin embryo. Development (Cambridge, England) 1999;126:345–357. doi: 10.1242/dev.126.2.345. [DOI] [PubMed] [Google Scholar]
  37. Long KA, Nossa CW, Sewell MA, Putnam NH, Ryan JF. Low coverage sequencing of three echinoderm genomes: the brittle star Ophionereis fasciata, the sea star Patiriella regularis, and the sea cucumber Australostichopus mollis. GigaScience. 2016;5:20. doi: 10.1186/s13742-016-0125-6. [DOI] [PMC free article] [PubMed] [Google Scholar]
  38. Lyons DC, Kaltenbach SL, McClay DR. Morphogenesis in sea urchin embryos: linking cellular events to gene regulatory network states. Wiley Interdisciplinary Reviews. Developmental Biology. 2012;1:231–252. doi: 10.1002/wdev.18. [DOI] [PMC free article] [PubMed] [Google Scholar]
  39. Makabe KW, Kirchhamer CV, Britten RJ, Davidson EH. Cis-regulatory control of the SM50 gene, an early marker of skeletogenic lineage specification in the sea urchin embryo. Development (Cambridge, England) 1995;121:1957–1970. doi: 10.1242/dev.121.7.1957. [DOI] [PubMed] [Google Scholar]
  40. Mann K, Poustka AJ, Mann M. The sea urchin (Strongylocentrotus purpuratus) test and spine proteomes. Proteome Science. 2008;6:22. doi: 10.1186/1477-5956-6-22. [DOI] [PMC free article] [PubMed] [Google Scholar]
  41. Mann K, Wilt FH, Poustka AJ. Proteomic analysis of sea urchin (Strongylocentrotus purpuratus) spicule matrix. Proteome Science. 2010;8:33. doi: 10.1186/1477-5956-8-33. [DOI] [PMC free article] [PubMed] [Google Scholar]
  42. Mathelier A, Fornes O, Arenillas DJ, Chen CY, Denay G, Lee J, Shi W, Shyr C, Tan G, Worsley-Hunt R, Zhang AW, Parcy F, Lenhard B, Sandelin A, Wasserman WW. JASPAR 2016: a major expansion and update of the open-access database of transcription factor binding profiles. Nucleic Acids Research. 2016;44:D110–D115. doi: 10.1093/nar/gkv1176. [DOI] [PMC free article] [PubMed] [Google Scholar]
  43. McCauley BS, Weideman EP, Hinman VF. A conserved gene regulatory network subcircuit drives different developmental fates in the vegetal pole of highly divergent echinoderm embryos. Developmental Biology. 2010;340:200–208. doi: 10.1016/j.ydbio.2009.11.020. [DOI] [PubMed] [Google Scholar]
  44. Nishimura Y, Sato T, Morita Y, Yamazaki A, Akasaka K, Yamaguchi M. Structure, regulation, and function of micro1 in the sea urchin Hemicentrotus pulcherrimus. Development Genes and Evolution. 2004;214:525–536. doi: 10.1007/s00427-004-0442-0. [DOI] [PubMed] [Google Scholar]
  45. Oliveri P, Carrick DM, Davidson EH. A regulatory gene network that directs micromere specification in the sea urchin embryo. Developmental Biology. 2002;246:209–228. doi: 10.1006/dbio.2002.0627. [DOI] [PubMed] [Google Scholar]
  46. Oliveri P, Tu Q, Davidson EH. Global regulatory logic for specification of an embryonic cell lineage. PNAS. 2008;105:5955–5962. doi: 10.1073/pnas.0711220105. [DOI] [PMC free article] [PubMed] [Google Scholar]
  47. Paul CRC, Smith AB. The early radiation and phylogeny of echinoderms. Biological Reviews. 1984;59:443–481. doi: 10.1111/j.1469-185X.1984.tb00411.x. [DOI] [Google Scholar]
  48. Peng CJ, Wikramanayake AH. Differential regulation of disheveled in a novel vegetal cortical domain in sea urchin eggs and embryos: implications for the localized activation of canonical Wnt signaling. PLOS ONE. 2013;8:e80693. doi: 10.1371/journal.pone.0080693. [DOI] [PMC free article] [PubMed] [Google Scholar]
  49. Peter IS, Davidson EH. Genomic control process: development and evolution. London, UK ; San Diego, CA, USA: Academic Press is an imprint of Elsevier; 2015. [Google Scholar]
  50. Pisani D, Feuda R, Peterson KJ, Smith AB. Resolving phylogenetic signal from noise when divergence is rapid: A new look at the old problem of echinoderm class relationships. Molecular Phylogenetics and Evolution. 2012;62:27–34. doi: 10.1016/j.ympev.2011.08.028. [DOI] [PubMed] [Google Scholar]
  51. Rafiq K, Shashikant T, McManus CJ, Ettensohn CA. Genome-wide analysis of the skeletogenic gene regulatory network of sea urchins. Development (Cambridge, England) 2014;141:2542. doi: 10.1242/dev.112763. [DOI] [PubMed] [Google Scholar]
  52. Rebeiz M, Patel NH, Hinman VF. Unraveling the Tangled Skein: The Evolution of Transcriptional Regulatory Networks in Development. Annual Review of Genomics and Human Genetics. 2015;16:103–131. doi: 10.1146/annurev-genom-091212-153423. [DOI] [PMC free article] [PubMed] [Google Scholar]
  53. Rebeiz M, Tsiantis M. Enhancer evolution and the origins of morphological novelty. Current Opinion in Genetics & Development. 2017;45:115–123. doi: 10.1016/j.gde.2017.04.006. [DOI] [PMC free article] [PubMed] [Google Scholar]
  54. Richardson W, Kitajima T, Wilt F, Benson S. Expression of an embryonic spicule matrix gene in calcified tissues of adult sea urchins. Developmental Biology. 1989;132:266–269. doi: 10.1016/0012-1606(89)90222-4. [DOI] [PubMed] [Google Scholar]
  55. Shashikant T, Khor JM, Ettensohn CA. From genome to anatomy: The architecture and evolution of the skeletogenic gene regulatory network of sea urchins and other echinoderms. Genesis (New York, N.Y) 2018a;56:e23253. doi: 10.1002/dvg.23253. [DOI] [PMC free article] [PubMed] [Google Scholar]
  56. Shashikant T, Khor JM, Ettensohn CA. Global analysis of primary mesenchyme cell cis-regulatory modules by chromatin accessibility profiling. BMC Genomics. 2018b;19:206. doi: 10.1186/s12864-018-4542-z. [DOI] [PMC free article] [PubMed] [Google Scholar]
  57. Smith AF, Posakony JW, Rebeiz M. Automated tools for comparative sequence analysis of genic regions using the GenePalette application. Developmental Biology. 2017;429:158–164. doi: 10.1016/j.ydbio.2017.06.033. [DOI] [PMC free article] [PubMed] [Google Scholar]
  58. Smith SJ, Rebeiz M, Davidson L. From pattern to process: studies at the interface of gene regulatory networks, morphogenesis, and evolution. Current Opinion in Genetics & Development. 2018;51:103–110. doi: 10.1016/j.gde.2018.08.004. [DOI] [PMC free article] [PubMed] [Google Scholar]
  59. Stecher G, Tamura K, Kumar S. Molecular Evolutionary Genetics Analysis (MEGA) for macOS. Molecular Biology and Evolution. 2020;37:1237–1239. doi: 10.1093/molbev/msz312. [DOI] [PMC free article] [PubMed] [Google Scholar]
  60. Sun Z, Ettensohn CA. Signal-dependent regulation of the sea urchin skeletogenic gene regulatory network. Gene Expression Patterns. 2014;16:93–103. doi: 10.1016/j.gep.2014.10.002. [DOI] [PubMed] [Google Scholar]
  61. Tu Q, Cameron RA, Davidson EH. Quantitative developmental transcriptomes of the sea urchin Strongylocentrotus purpuratus. Developmental Biology. 2014;385:160–167. doi: 10.1016/j.ydbio.2013.11.019. [DOI] [PMC free article] [PubMed] [Google Scholar]
  62. Walters J, Binkley E, Haygood R, Romano LA. Evolutionary analysis of the cis-regulatory region of the spicule matrix gene SM50 in strongylocentrotid sea urchins. Developmental Biology. 2008;315:567–578. doi: 10.1016/j.ydbio.2008.01.007. [DOI] [PubMed] [Google Scholar]
  63. Weitzel HE, Illies MR, Byrum CA, Xu R, Wikramanayake AH, Ettensohn CA. Differential stability of beta-catenin along the animal-vegetal axis of the sea urchin embryo mediated by dishevelled. Development (Cambridge, England) 2004;131:2947–2956. doi: 10.1242/dev.01152. [DOI] [PubMed] [Google Scholar]
  64. Wray GA. The evolutionary significance of cis-regulatory mutations. Nature Reviews. Genetics. 2007;8:206–216. doi: 10.1038/nrg2063. [DOI] [PubMed] [Google Scholar]

Editor's evaluation

Kathryn Song Eng Cheah 1

In this manuscript, Khor et al. examine the transcriptional regulation of kirrelL, a gene whose protein product is required for cell-cell fusion during the morphogenesis of the sea urchin larval skeleton. They establish a putative direct link between a developmental gene regulatory network driving cell fate commitment and an effector protein enabling a key behavior of the specified cell type, thereby strengthening the explanatory power of a well-established GRN model. It places a key morphoregulatory gene, kirrelL, into the extensively studied gene regulatory network of sea urchins and reveals deep evolutionary conservation of regulatory element function. This study should be of broad, general interest for developmental biologists.

Decision letter

Editor: Kathryn Song Eng Cheah1

In the interests of transparency, eLife publishes the most substantive revision requests and the accompanying author responses.

Decision letter after peer review:

Thank you for submitting your article "Architecture and evolution of the cis-regulatory system of the echinoderm kirrelL gene" for consideration by eLife. Your article has been reviewed by 3 peer reviewers, and the evaluation has been overseen by a Reviewing Editor and Kathryn Cheah as the Senior Editor. The reviewers have opted to remain anonymous.

The reviewers have discussed their reviews with one another, and the Reviewing Editor has drafted this to help you prepare a revised submission. The reviewers are in general agreement that the manuscript warrants publication in eLife. However, the reviewers have also requested some additional experiments and edits to improve the study and the manuscript. We suggest the authors address all of the issues raised by the individual reviewers, giving special attention to the essential revisions listed below.

Essential revisions:

1) The reviewers feel that is it necessary to validate RNA-seq results with qPCR or in situ hybridization when possible, and so agree that it would be appropriate for the authors to knock down Alx1 in S. purpuratus embryos both to confirm that kirrelL expression decreases and to show that the activity of the P. miniata CRE is affected. Likewise, the reviewers feel that it will be important for the authors to show that Alx1 knockdown affects the activity of elements C and G to rule out the possibility that other transcription factors' binding to these sites underlies their importance.

2) The reviewers agree that the authors' data suggests that the Sp-kirrelL promoter is necessary for the BAC construct to be expressed. However, they believe that the authors need to revise the statement in line 252, where it is stated that endo16prm+Sp-kirrelLprm drives ectopic expression, and that this suggests the kirrelL promoter is a strong, ubiquitous promoter. The reviewers think the conclusion the authors draw from this reporter assay contradicts their BAC experiment showing that the promoter alone (without the other elements) cannot drive expression.

3) The reviewers also agree that it is important for the authors to analyze sequence conservation of the studied species' kirrelL cis-regulatory elements to support the claim of conserved sequence and function.

Reviewer #1:

In this manuscript, Khor et al. examine the transcriptional regulation of kirrelL, a gene whose protein product is required for cell-cell fusion during the morphogenesis of the sea urchin larval skeleton. They identify cis-regulatory elements of Sp-kirrelL that contain putative binding sites for Alx1 and Ets1, two transcription factors that specify the cellular precursors of the larval skeleton, and show that mutating these sites abrogates one element's ability to drive reporter expression and alters the spatial pattern of the other. This putative direct link between a developmental gene regulatory network driving cell fate commitment and an effector protein enabling a key behavior of the specified cell type would strengthen the explanatory power of a well-established GRN model, making this study of interest for developmental biologists broadly.

The authors' selection of candidate cis-regulatory regions is well-grounded in functional genomic data showing that several of these regions possess signatures of active cis-regulatory elements. A reporter construct containing all of the chosen regions (A-G) is expressed specifically in primary mesenchyme cells in the majority of expressing, injected embryos, consistent with the PMC-specific expression pattern of Sp-kirrelL, confirming that this genomic region very likely contains enhancers of Sp-kirrelL. A thorough dissection of A-G identifies two regions individually able to drive PMC-specific expression when placed in front of a basal promoter, albeit at low frequency, leading the authors to investigate the trans-regulation of these elements. Elements C's loss of activity upon mutation of a single Alx site or a single Ets site is an exciting finding. It is interesting as well that mutating Alx or Ets sites within G causes it to drive ectopic activity. If, as these data suggest, Alx1 and Ets1 directly regulate the expression of Sp-kirrelL, this would be one of few sea urchin studies that have shown a direct and functional cis-regulatory link from a fate-specifying gene to an effector gene expressed in the differentiated cell (others are Amore and Davidson Dev. Biol. 2006 and Calestani and Rogers Dev. Biol. 2010, though the latter relies on mutation of putative binding sites only). Additionally, the high resolution at which the function of kirrelL is understood-we know the specific cell behavior it is needed for-is strong justification for studying the regulation of this gene, and therefore these findings on kirrelL's regulation are an important contribution to understanding of PMC morphogenesis. However, to confirm that Alx1 and Ets1 directly regulate Sp-kirrelL, it is necessary to show that knockdown of either factor alters Sp-kirrelL's expression, since the putative binding sites the authors identify could be bound by other transcription factors. Characterizing the effects of Alx1 and Ets1 knockdown on cis-regulatory element reporter activity could also further support the authors' conclusions.

The analysis of individual cis-regulatory elements' necessity for Sp-kirrelL expression using bacterial artificial chromosome deletions is a well-justified approach to understanding these elements' functions. Elements C, G and H each contribute to transcription in a BAC context and therefore likely contribute non-redundantly to endogenous Sp-kirrelL expression, though statistical analysis of the Nanostring data is needed to confirm the significance of these effects.

Aiming to test whether the Alx/Ets-kirrelL cis-regulatory link proposed for S. purpuratus is conserved in skeletal development of other echinoderm species, the authors characterize the expression of kirrelL in the sea star P. miniata and perform a heterologous reporter experiment showing that mutating putative Alx and Ets sites in a region upstream of Pm-kirrelL abolishes the region's ability to drive PMC-specific reporter expression. This result and the fact that Pm-kirrelL, Alx1 and Ets1 are expressed in PMCs in P. miniata are consistent with the authors' claim that Alx1 and Ets1 regulate kirrelL in P. miniata. However, given that the trans environments of S. purpuratus embryos and P. miniata larvae likely differ, the evidence shown so far is not compelling support for this claim. Showing that knockdown of Alx1 or Ets1 in S. purpuratus embryos alters the activity of the Pm-kirrelL CRE is necessary to support the assertion that these proteins regulate this element in its native species and developmental context.

Comments for the authors:

Evidence for direct regulation by Alx1 and Ets1:

As raised in the public review, experiments testing how perturbing Alx1 and Ets1 expression affects Sp-kirrelL expression are needed to confirm that (1) binding of Alx1 and Ets1 (and not another factor) to the altered CRE sites underlies these sites' importance and (2) that this interaction consequential for the expression of Sp-kirrelL. The authors raise the former issue in lines 552-554. Though Rafiq et al. (2014) provide evidence for the latter in RNA-seq data, this should be validated with in situ hybridization, which will also allow reveal any changes in spatial expression of kirrelL (e.g. ectopic expression, which seems plausible given that mutating certain sites leads to ectopic reporter activity). An analogous experiment with the Pm-kirrelL CRE is necessary to support the claim that Alx1 and Ets1 regulate Pm-kirrelL.

Reporter assay data:

– Why is there so much variation in the number of embryos injected per construct?

– Does element C consistently fail to drive reporter expression in the vegetal-most PMCs, as in the image in Figure 2C? If so, this should be noted.

– Please state in the caption of Figure 2 the exact percent of GFP+ embryos that needed to have PMC-specific expression for a construct to be classified as strong or weak PMC expression (I assume 50%). Furthermore, by the criteria for being classified as "ectopic expression" in Figure 4, C.ChIP.Alx1palindrome should fall into this category. These classification criteria should be applied consistently to all figures.

– To support the conclusion that mutating putative Alx1 or Ets1 binding sites alters the spatial activity of the Sp-kirrelL promoter and of PmG (lines 254-255 and 435-7 state that these elements receive positive inputs from Alx1 and Ets1), the fraction of expressing embryos that display ectopic activity should be compared statistically between the wild-type and mutant construct for the Sp-kirrelL promoter and for PmG.

– Please state sample sizes for the experiment in which S. purpuratus CRE constructs were injected into L. variegatus embryos (of which images are shown in Figure S2B).

Nanostring data:

– Supplemental Table S1 appears to be missing expression pattern data for all but one of the BACs. These data are necessary to support the statements made in lines 336-343 on the spatial activity patterns of the deletion constructs.

– Statements comparing expression levels driven by the wild-type BAC and a particular deletion BAC (the authors make such statements for constructs ∆C.GFP.BAC, ∆G.kirrelLprm.GFP.BAC, and ∆H.GFP.BAC in lines 348-355) should be supported with statistical analysis of the nanostring data presented in figure 5C. This is especially necessary given that the normalized RNA counts for some replicates and time points are quite similar between the compared constructs (e.g. ∆C.GFP.BAC and the wild-type BAC at 50 hpf).

Suggestion for presentation of data:

The figures in their current form succeed in condensing the results of many reporter assays into a visually digestible form. However, conveying the results of each assay using a single parameter (strong, weak, or no PMC expression, or ectopic expression) whose value is determined using thresholds for percent of GFP+ embryos and percent of GFP+ embryos with PMC-specific expression hides interesting differences in constructs’ activity. For example, though C.ChIP, C.ChIP.Alx1halfsite1 and C.ChIP.Alx1palindrome are all categorized as “strong PMC expression”, the mutant constructs drive reporter activity in PMCs only less frequently and in ectopic locations more frequently than the wild-type construct, suggesting that these sites may be relevant for proper Sp-kirrelL expression.

I would suggest making bar plots depicting the spatial pattern category data in Supplemental Table S1 and placing these in the supplemental figures, or in the main figures where the data are most relevant or exciting (e.g. site mutations leading to ectopic activity). I would also consider graphically depicting for each construct the proportion of embryos showing expression. These figures would aid readers in making comparisons within these data, which may be of interest to those studying cis-regulation broadly.

Issue with interpretation of data relating to Sp-kirrelL promoter:

The claim in line 251, that the Sp-kirrelL promoter is a strong, ubiquitous promoter, is contradicted by the result in Figure 5a and lines 326-328 that a BAC containing the promoter only does not drive any expression. The latter result suggests that the Sp-kirrelL promoter lacks the ability to drive transcription without additional enhancer elements, and that the strong activity of the Sp-kirrelL promoter + endo16 promoter construct is due to synergistic activity of the Sp-kirrelL and endo16 promoters.

Issue pertaining to claim of enhancer-promoter-specific interactions:

The statement "several CREs are capable of interacting specifically with the native Sp-kirrelL promoter” (274-276) should be rephrased and clarified. I would not use the word “interact” to describe an observation about the output of a combination of two CREs because this word suggests physical CRE-promoter looping, for which no direct evidence is presented. Wording like “super-additive/synergistic activity” would be more clear.

Furthermore, in claiming that pairs of elements interact specifically/display super-additive activity, the authors rightfully state that, e.g., B+sp-kirrelLprm+endo16prm displays activity while B+endo16prm does not drive any reporter expression. However, given that sp-kirrelLprm+endo16prm itself drives expression, the activity of B+sp-kirrelLprm+endo16prm must be greater than the sum of the activities of B+endo16prm and sp-kirrelLprm+endo16prm in order to state that B and sp-kirrelLprm interact super-additively. In other words, the activity of kirrelLprm+endo16prm must be taken into account.

Considering this activity, it does appear that B, C, E, F, H and I do act super-additively with Sp-kirrelLprm, considering at least one of the metrics of % of embryos expressing and % with PMC-specific expression (e.g. C+endo16prm drives GFP expression in 8.6% of embryos, Sp-kirrelLprm+endo16prm drives expression in 19%, and C+Sp-kirrelLprm+endo16prm drives expression in 37.8%, which is greater than 19+8.6). A+Sp-kirrelLprm+endo16prm and D+Sp-kirrelLprm+endo16prm, on the other hand, drive GFP expression both with less frequency and less PMC specificity than Sp-kirrelLprm+endo16prm, so I do not think it can be said that these elements interact specifically with kirrelLprm, and it seems that they do not have enhancer activity and may not be functional elements at all. If this is why BAC deletion constructs were not made for A and D, this should be explicitly stated.

It is interesting that several X+Sp-kirrelLprm+endo16prm combinations are more PMC-specific than Sp-kirrelLprm+endo16prm alone. This suggests that some of these elements may not only be enhancers, but also have silencer activity necessary to drive kirrelL expression in the proper spatial pattern. It is an interesting finding, in line with Gisselbrecht et al. Mol. Cell. (2020)'s finding that many silencers are enhancers in alternate tissue contexts, that should be highlighted.

Finally, the interpretation in lines 269-271 that "the presence of the native Sp-kirrelL promoter mitigated the need for the C.ChIP element within element C to be adjacent to the promoter for strong PMC-specific GFP expression" (and restated in 274-276) is not strongly supported. Placing a spacer sequence with no enhancer or silencer activity in between C.ChIP and the promoter, and showing that this decreases activity as compared to when C.ChIP is adjacent to the promoter, would support this. However, the current data leave open the possibility that the part of element C downstream of C.ChIP contains sites for repressive factors, especially given that there is such a large difference in the activity of C.DNase and C.ATAC even though the former is only ~150 bp longer.

While these may seem like small points, being precise with the interpretation of the wealth of reporter assay and BAC data in this study will elevate the study's contribution to the field of cis-regulation.

kirrelL gene/protein tree:

Ettensohn and Dey Dev. Biol. (2017) show a protein tree in which Sp-kirrelL, Lv-kirrelL and Pm-kirrelL cluster together within a set of transmembrane Ig-domain proteins, but I have not found such an analysis for the sequences of kirrelL proteins in the other species whose kirrelL cis-regulatory regions are tested for activity in this manuscript. This is necessary to confirm the identity of these kirrelL genes. If such an analysis has been published, that paper should be cited.

Description of cross-species experiments:

The sequences or coordinates of the putative kirrelL CREs from multiple species tested in reporter assays should be provided. When describing the cross-species CRE reporter experiments (lines 376-381), please explicitly state the species for which the expression pattern of kirrelL is unknown, as this is relevant to the interpretation of these experiments. Also, the choice to examine the expression of kirrelL in the adult rudiment of L. variegatus rather than that of S. purpuratus needs to be explained.

Finally, when presenting the results of the promoter swap experiment, I would explicitly state that PmG1 and PmG2 each confer a roughly similar increase in expression frequency and specificity to C+endo16prm as Sp-kirrelLprm does to more clearly convey that PmG1 and G2 can substitute for Sp-kirrelLprm in a meaningful way.

Reviewer #2:

The embryonic gene regulatory network (GRN) of sea urchins has been studied in considerable detail, providing numerous insights into how GRNs contribute to the development and evolution of phenotype. This study is significant because it places kirrelL, an important morphoeffector gene, into the GRN, thus providing an important link between early regulatory interactions that pattern the embryo and specify cell fate and later interactions that activate the genes that carry out morphogenesis. Through detailed experimental analyses, the authors identified the cis-regulatory elements that control the precise spatial and temporal pattern of kirrelL transcription and two transcription factors that act as positive inputs. A strength of the study is the combination of plasmid-based and BAC-based expression assays that dissect in detail the contribution of individual and combinations of regulatory elements, as well as targeted deletion of predicted transcription factor binding sites. Minor weaknesses are that most of these experiments used a heterologous basal promoter rather than the kirrelL basal promoter and that they were not designed to detect repressive interactions. Despite these minor concerns, the results identify the principal cis-regulatory elements and trans inputs that control kirrelL expression in the sea urchin embryo. A second set of experiments tested the ability of the 5' flanking region of the kirrelL gene from other echinoderm species to drive reporter gene expression. The species tested include members of distantly related groups and ones whose larvae do not produce a skeleton. The results show that the 5' upstream region contains regulatory elements that activate spatially and temporally correct transcription in the sea urchin embryo. Although regulatory element that have been conserved in function over comparable time scales have been described in other groups of animals, this seems to be the first well-documented example from echinoderms. The authors describe this as a case of "striking conservation of sequence and function" although it is not clear from the evidence presented that sequence conservation is actually involved. The authors show evidence of limited sequence conservation in noncoding regions around kirrelL between two sea urchins and between two sea stars, but no evidence for sequence conservation among the major groups of echinoderms. Even in the more closely related species there is no evidence that the small patches of similar sequences are actually the basis for conserved regulatory function. An interesting finding is that even species whose larvae lack a skeleton contain a 5' flanking region that can drive spatially and temporally accurate transcription in the sea urchin embryo. This finding led to the discovery of an enhancer that directs expression in the adult skeleton within the 5' flanking region of sea stars. Together, these results hint that some of the transcription factors that activate kirrelL transcription in embryos also perform that function during skeletogenesis in adult echinoderms.

Overall, this is a beautifully conducted study. The results are presented very clearly in both text and figures. Some specific questions and concerns follow below (numbers refer to line numbers in the manuscript):

178. What is the justification for using the core promoter of a different gene for these experiments? Given that some enhancers show selectivity for nearby core promoters (at least in other systems), this seems like an odd choice.

Figure 2B. I couldn't find any information about the number of replicates for these experiments, or any of the subsequent reporter assays presented in subsequent figures. A detailed tabulation for every separate experiment is not necessary, but a general statement about the number of replicates in a typical experiment would be very reassuring.

196-198. The explicit criteria for defining "strong" and "weak" expression are helpful. That said, it wasn't immediately obvious from Figure 2C how these differ when looking at the images for ABC and C (weak) versus the other constructs (strong). The weak constructs look a bit out of focus but that could simply be the weaker signal. How consistent are these differences among embryos and from replicate to replicate?

212-214. Could this result also be explained by the presence of binding sites for repressors in ABC that BC.ATAC lacks?

249-250. What was the basis for considering this region to be the core promoter?

251-252. Are these features (strong, ubiquitous) true of the core promoter that was used for the experiments? If not, the earlier concern about choice of core promoter for the experiments is even more acute.

265-268. This is an interesting result. What does it imply mechanistically?

342. Why so much redundancy? This is touched on only briefly in the Discussion but seems like an important result.

352-354. Is there any indication here (or in the previous results) of ectopic expression?

More generally: The experiments do not seem geared to detect possible repressive functions for any of the regulatory elements. Are there reasons for thinking that repressive functions would not be needed? What keeps kirrelL from being transcribed outside of the single cell type where it is expressed?

Figure 5: modifying the key in the lower left as follows might help make it easier to interpret panel C: GFP (deletion) mCherry (intact)

376: Mention the extent of region tested here so that readers don't need to consult other parts of the paper to understand the basic experimental design. If not exactly the same region in all of the species, mention that, too.

383-384. The results support function being highly conserved. What about sequence? It looks like there is some patchy short sequence conservation between two sea urchins (Figure 1C) and two sea stars (Figure 7A). What about between these groups?

In the literature "conserved regulatory element" more commonly applies to sequence than function. To avoid confusion, qualify "conserved" throughout the manuscript to clarify whether sequence or function is being discussed.

447-448. Is there evidence for sequence conservation (and see above)?

622-623. Is this sentence intended to mean that specific binding sites are conserved? Or that binding sites for the same transcription factors are present? This is an important distinction. There is evidence from other systems that individual binding sites can turn over while conserving regulatory element function. That seems much more plausible in this case than super-strong conservation of tiny patches of sequence.

There are examples from other groups (especially vertebrates) where a regulatory element shows conserved function among highly divergent species. It would be helpful to mention this in the Discussion to provide some context. Is this the first reported case of conserved regulatory element function among deeply divergent echinoderms? If so, this is worth mentioning explicitly, again for context.

Reviewer #3:

In an earlier paper this group showed that KirrelL is a protein necessary for syncytial fusion of skeletal cells in the sea urchin larva. Knowledge of the gene regulatory network driving expression of KirrelL showed that two transcription factors, Alx1 and Ets1 are drivers of KirrelL expression. The analysis in this paper accomplishes two goals: they uncover much of the cis-regulatory apparatus that drives KirrelL expression exclusively in the skeletogenic cells of the sea urchin larva, and they also demonstrate an unusually long period of relative conservation of the enhancer and basal promoter driving KirrelL expression.

The paper is very clearly written and illustrated. The illustrations are quite effective in showing the outcome of the experiments along the way, and each experiment is accompanied by a fluorescent read-out in the larva to show the specificity of expression of a construct. There are several surprises in the paper. The one that was most unusual to this reviewer was the deep conservation. They obtained cis-regulatory sequences from KirrelL genes in other classes of Echinoderms, including those that have no larval skeleton. These sequences were used to build constructs upstream of GFP. The constructs were injected into sea urchin eggs (S. purpuratus), and even those that have no larval skeleton, like sea stars, have a cis regulatory region that drives gene expression in skeletogenic cells in S. purpuratus, indicating a conservation of more than 500 million years. They go on to show that the sea star expresses KirrelL in the adult skeleton, apparently using the same cis-regulatory region. The paper will be of interest to several communities. It will be of strong interest to the echinoderm development community. It will also be of interest to those interested in evolution of cis-regulatory regions and their contribution to evolutionary change.

Finally, the fact that the gene is expressed in larvae that have skeletons and the same cis regulatory region drives the expression of the gene in adults of species that have no larval skeletons is a most interesting observation.

Comments for the authors:

The paper is really well written and logically presented. If it were simply a cis regulatory story on a random gene I would have recommended a lower level journal. However, here the impressive conservation of the cis regulatory region elevates the paper quite significantly. Still, they don't show anything of the cis-regulatory region sequences, and these would help improve the paper – is the conservation actually small islands perhaps the Alx1 and Ets binding regions? Is it the basal promoter primarily? Or is the entire region fairly well conserved? The answer to those questions will be helped with the sequences. I point out that illustrating the protein sequences across the phylum is OK but is not really the focus of this paper. The other point that I think needs better quantification is the call that anything above 15% expression is considered "strong". I realize that these kind of reporter assays sometimes have a low percentage read-out, but the question is whether some elements are stronger than others. I ask simply the question about the strongest of the so-called strong vs the weakest of the so-called strong.

There are several components of the paper that would benefit from some revision to help me understand some of the interpretations.

1. In Figure 1 showing ATAC-seq, DNAse hypersensitivity, ChIP seq data how did you call the peaks? Some, especially G, the promoter, are obvious but others are less so, and still others look similar to peaks you called as enhancers.

2. You indicate that in scoring expression that greater than 15% of the embryos expressing a construct is strong expression. I understand some of the many reasons why 85% might not express. But, I would also like to know if some are stronger than others. For example is ABCDEFG stronger than DEFG and is that stronger than G? Also in Figure 2 I notice that C is indicated as weaker. The embryo illustrated has fewer fluorescent PMCs than other embryos in this panel with stronger promoters. Is it possible that element C somehow operates in a restricted number of cell bodies rather than all of them? After all, you show in other papers that there are mRNAs that are expressed in a restricted subset of PMCs even within the syncytium. Along the same line, although you indicate that Ets1 sites 2 and 3, when mutated, still allow for expression. Your images of those show stronger expression of GFP in the ventrolateral clusters than the spread of expression when all three Ets sites are control. Is that, or could that be meaningful?

3. The data in Figure 5 I find to be most valuable to the paper. That includes the nanostring data to indicate contributions relative to an mCherry control construct which is most informative.

4. The data on other species is most interesting. I see you have an alignment of the KirrelL proteins of the several species but that isn't really the story. You don't have anything to indicate the relative alignment of the same cis regulatory regions. The real question is how are those related? Are their islands of high conservation as seen earlier by Cameron and Davidson? Are there indels outside the areas that must be conserved enough to drive expression in S. purpuratus? It seems to me that these are the sequences of interest. Yes, there is demonstrated similarity in the KirrelL protein sequence but this paper is all about the cis regulation.

eLife. 2022 Feb 25;11:e72834. doi: 10.7554/eLife.72834.sa2

Author response


Essential revisions:

1) The reviewers feel that is it necessary to validate RNA-seq results with qPCR or in situ hybridization when possible, and so agree that it would be appropriate for the authors to knock down Alx1 in S. purpuratus embryos both to confirm that kirrelL expression decreases and to show that the activity of the P. miniata CRE is affected. Likewise, the reviewers feel that it will be important for the authors to show that Alx1 knockdown affects the activity of elements C and G to rule out the possibility that other transcription factors' binding to these sites underlies their importance.

As requested, we have carried out additional studies examining the effects of Sp-alx1 knockdown on the activity of the P. miniata regulatory region and the S. purpuratus C and G elements. These data are shown in new Figure 7—figure supplement 4. The results of these studies confirm that knockdown of Alx1 or Ets1 expression substantially suppresses the activity of all four constructs. (Line 378-382)

With respect to the effect of Alx1 on kirrelL expression, the key observations already published are: (1) both kirrelL and alx1 are expressed only in PMCs and (2) RNAseq data (from S. purpuratus) show that kirrelL expression declines dramatically (to <2% of control levels) in Alx1 morphants (Rafiq et al., 2014). These RNAseq data show conclusively that Alx1 is a positive regulator of kirrelL expression, at least in the species we have used here (S. purpuratus). Nevertheless, we have carried out additional WMISH analysis of both Alx1 and Ets1 morphants and confirmed that Sp-kirrelL expression declines to undetectable levels in these morphants. These results are shown in new Figure 3—figure supplement 2. (Line 204-208)

2) The reviewers agree that the authors' data suggests that the Sp-kirrelL promoter is necessary for the BAC construct to be expressed. However, they believe that the authors need to revise the statement in line 252, where it is stated that endo16prm+Sp-kirrelLprm drives ectopic expression, and that this suggests the kirrelL promoter is a strong, ubiquitous promoter. The reviewers think the conclusion the authors draw from this reporter assay contradicts their BAC experiment showing that the promoter alone (without the other elements) cannot drive expression.

We thank the reviewers for detecting this discrepancy. Based on their comments, we went back and re-tested the BAC construct that lacks elements A-G except for the 301 bp promoter region (∆CRE.kirrelLprm.GFP.BAC) and confirmed that it is not expressed at significant levels, demonstrating that the promoter alone is relatively inactive. In the context of the EpGFPII plasmid, however, the same 310 bp fragment drives significant ectopic expression. In agreement with Reviewer 1, we conclude that in the plasmid construct there is some unexplained and abnormal synergy between the two promoters. We have modified the Results to state: “When tested in the EpGFPII plasmid, we found that a 301 bp region surrounding the transcriptional start site, a region we considered to include the Sp-kirrelL core promoter, drove ectopic GFP expression. As shown below, however, the same element failed to drive significant reporter expression in a BAC construct, indicating that the activity of the 310 bp element in EpGFPII was the result of abnormal synergy between the Sp-kirrelL and Sp-endo16 promoters.” (Line 218-224)

3) The reviewers also agree that it is important for the authors to analyze sequence conservation of the studied species' kirrelL cis-regulatory elements to support the claim of conserved sequence and function.

We thank the reviewers for requesting this additional analysis. In the original submission, we included comparisons of the C and G modules of S. purpuratus and L. variegatus (these sequence comparisons are now found in Figure 3—figure supplement 1 and Figure 4—figure supplement 2). In the revised manuscript, we have added a comparison of the P. miniata and S. purpuratus regulatory regions (see new Figure 7—figure supplement 2) and short statements in the Methods and Results sections based on this analysis. The essential finding is that these sequences are highly divergent, which is perhaps not surprising given the vast evolutionary distance between the two species (>450 million years). Consensus Alx1 and Ets1 binding sites are present in both, but their number and spacing are not conserved and there are no large blocks of conserved sequence in the two regions. In contrast, the regulatory regions of two sea stars, P. miniata and A. plancii, are much more highly conserved, and we have added a detailed comparison of these two sequences in Figure 7—figure supplement 2.

Reviewer #1:

[…] Evidence for direct regulation by Alx1 and Ets1:

As raised in the public review, experiments testing how perturbing Alx1 and Ets1 expression affects Sp-kirrelL expression are needed to confirm that (1) binding of Alx1 and Ets1 (and not another factor) to the altered CRE sites underlies these sites' importance and (2) that this interaction consequential for the expression of Sp-kirrelL. The authors raise the former issue in lines 552-554. Though Rafiq et al. (2014) provide evidence for the latter in RNA-seq data, this should be validated with in situ hybridization, which will also allow reveal any changes in spatial expression of kirrelL (e.g. ectopic expression, which seems plausible given that mutating certain sites leads to ectopic reporter activity). An analogous experiment with the Pm-kirrelL CRE is necessary to support the claim that Alx1 and Ets1 regulate Pm-kirrelL.

Please see our response to the Editor’s letter (Point 1). We have carried out additional studies examining the effects of Sp-alx1 knockdown on the activity of the P. miniata regulatory region and S. purpuratus C and G elements, and on Sp-kirrelL expression.

Reporter assay data:

– Why is there so much variation in the number of embryos injected per construct?

For most constructs, we scored 100 to 200 injected embryos. In some cases, however, we performed additional trials if expression was weak, and we needed to inject more embryos in order to get a reasonable number that expressed detectable levels of GFP and could be scored for spatial expression. Also, in some cases, reporter constructs were used as internal controls in later experiments to allow direct comparisons with other constructs. In such cases, data were pooled from many replicates and the number of injected embryos is especially large.

– Does element C consistently fail to drive reporter expression in the vegetal-most PMCs, as in the image in Figure 2C? If so, this should be noted.

As we note below in response to Reviewer 3, our microscopic analysis of transgenic embryos was carried out at 48 hpf, which is soon after PMC fusion is complete. Because GFP protein diffuses rapidly throughout the PMC syncytium, the entire PMC network is labeled in the embryos shown in Figures 2, 6, Figure 3—figure supplement 1, Figure 4—figure supplement 1, 2, 3, Figure 5—figure supplement 1, Figure 7—figure supplement 1, 4, despite the mosaic incorporation of transgenes in sea urchin embryos. In the case of the embryo injected with the C construct shown in Figure 2, this embryo has an unusually small number of PMCs and the dorsal part of the syncytial ring (located at the bottom of the embryo as shown) is missing. All the PMC cell bodies are labeled with GFP, however, as one can see if the lower (DIC) image is compared to the image showing GFP fluorescence.

– Please state in the caption of Figure 2 the exact percent of GFP+ embryos that needed to have PMC-specific expression for a construct to be classified as strong or weak PMC expression (I assume 50%). Furthermore, by the criteria for being classified as "ectopic expression" in Figure 4, C.ChIP.Alx1palindrome should fall into this category. These classification criteria should be applied consistently to all figures.

To score embryos, we first identified every injected embryo based on the fluorescence of the dextran that was co-injected with the constructs. We scored as “expressing” every embryo that had any cells with detectable GFP (or mCherry) fluorescence. Each expressing embryo was then classified into one of 3 bins, depending on whether reporter expression was confined entirely to the PMC syncytium (PMC only), entirely to other cells (ectopic only), or a combination of the two (PMC + ectopic). A comprehensive table showing the data from all constructs is included as Figure 2 – source data 1.

For Figure 2 and similar figures, to be shown as “strong PMC expression”, we required (1) that the “PMC only” class be the largest of the 3 expression classes (i.e., we required that >1/3 of GFP-expressing embryos exhibit expression only in PMCs) and (2) that this expression class represented >15% of all injected embryos. We felt that the 1/3 cutoff was sufficiently stringent because typically many other embryos exhibited expression in the PMC syncytium but also had 1 or 2 ectopic cells labeled, and so fell into the “PMC + ectopic” class. To be classified as “weak PMC expression” we also required that the “PMC only” class be the largest of the 3 expression classes, but in this case the class represented <15% of all injected embryos, reflecting lower overall levels of expression. We have modified the legend to Figure 2 to make this scoring scheme clearer.

– To support the conclusion that mutating putative Alx1 or Ets1 binding sites alters the spatial activity of the Sp-kirrelL promoter and of PmG (lines 254-255 and 435-7 state that these elements receive positive inputs from Alx1 and Ets1), the fraction of expressing embryos that display ectopic activity should be compared statistically between the wild-type and mutant construct for the Sp-kirrelL promoter and for PmG.

Figure 2 – source data 1 shows that most embryos injected with the parental G.ATAC construct exhibit PMC–specific expression, while most embryos injected with G.ATAC (Axl1 sites mutated) or G.ATAC (Ets1 sites mutated) exhibit ectopic expression (i.e., only ectopic or PMC + ectopic). For each mutant construct, the difference in the distribution of embryos in these in these two phenotypic classes as compared to the parental construct is highly significant as by a chi-square test (P<0.001). The differences between the parental PmG construct and each of the two mutant constructs (all Alx1 sites mutated or all Ets1 sites mutated) are even more dramatic and are also highly significant by a chi-square test (p<0.001). We have added relevant statements to the text. (Line 228-231)

– Please state sample sizes for the experiment in which S. purpuratus CRE constructs were injected into L. variegatus embryos (of which images are shown in Figure S2B).

This information is now shown in Figure 2 – source data 1.

Nanostring data:

– Supplemental Table S1 appears to be missing expression pattern data for all but one of the BACs. These data are necessary to support the statements made in lines 336-343 on the spatial activity patterns of the deletion constructs.

This information is now shown in Figure 2 – source data 1.

– Statements comparing expression levels driven by the wild-type BAC and a particular deletion BAC (the authors make such statements for constructs ∆C.GFP.BAC, ∆G.kirrelLprm.GFP.BAC, and ∆H.GFP.BAC in lines 348-355) should be supported with statistical analysis of the nanostring data presented in figure 5C. This is especially necessary given that the normalized RNA counts for some replicates and time points are quite similar between the compared constructs (e.g. ∆C.GFP.BAC and the wild-type BAC at 50 hpf).

The Nanostring experiments were laborious and, unfortunately, we only have 2 biological replicates of the time-course data for each of the eight BAC constructs tested. This means that our statistical power is low and only in the most extreme cases (like ∆G.GFP.BAC) does a simple test like a t-test support with high confidence a difference in the mean expression level between the parental and mutant constructs at any individual time point. For the two most important constructs that we emphasize in the text (∆C.GFP.BAC and ∆G.kirrelLprm.GFP.BAC), we think the overall trend is very convincing, since the expression level of the mutant construct is invariably lower than the co-injected parental construct, at every time point and in both replicates. It can be seen, however, that for both ∆C.GFP.BAC and ∆G.kirrelLprm.GFP.BAC, one trial consistently showed higher overall expression (i.e., of both the parental and mutant constructs) than the other, perhaps due to the random nature of the BAC integration, variation between egg batches, differences in injection volume, or other factors. This creates enough difference in the expression values between the two replicates that statistical analyses we’ve explored don’t support differences between the mutant and parental BACs at high confidence levels. For example, area-under-the-curve comparisons between mutant and parental constructs yields p-values of 0.08 and 0.12 for the ∆G.kirrelLprm.GFP.BAC and ∆C.GFP.BAC, respectively, so not at the usual 0.05 threshold (but not too far off). We can include these p-values, if the reviewers feel they are useful.

Suggestion for presentation of data:

The figures in their current form succeed in condensing the results of many reporter assays into a visually digestible form. However, conveying the results of each assay using a single parameter (strong, weak, or no PMC expression, or ectopic expression) whose value is determined using thresholds for percent of GFP+ embryos and percent of GFP+ embryos with PMC-specific expression hides interesting differences in constructs' activity. For example, though C.ChIP, C.ChIP.Alx1halfsite1 and C.ChIP.Alx1palindrome are all categorized as "strong PMC expression", the mutant constructs drive reporter activity in PMCs only less frequently and in ectopic locations more frequently than the wild-type construct, suggesting that these sites may be relevant for proper Sp-kirrelL expression.

I would suggest making bar plots depicting the spatial pattern category data in Supplemental Table S1 and placing these in the supplemental figures, or in the main figures where the data are most relevant or exciting (e.g. site mutations leading to ectopic activity). I would also consider graphically depicting for each construct the proportion of embryos showing expression. These figures would aid readers in making comparisons within these data, which may be of interest to those studying cis-regulation broadly.

We thank the reviewer for this valuable suggestion, and we have modified the figures as recommended. Bar plots of the most important data are now found in the main figures and the other bar plots are in the relevant supplemental figures. The proportion of embryos showing expression is also indicated in the bar plots. All the raw data are found in Figure 2 – source data 1.

Issue with interpretation of data relating to Sp-kirrelL promoter:

The claim in line 251, that the Sp-kirrelL promoter is a strong, ubiquitous promoter, is contradicted by the result in Figure 5a and lines 326-328 that a BAC containing the promoter only does not drive any expression. The latter result suggests that the Sp-kirrelL promoter lacks the ability to drive transcription without additional enhancer elements, and that the strong activity of the Sp-kirrelL promoter + endo16 promoter construct is due to synergistic activity of the Sp-kirrelL and endo16 promoters.

We agree and thank the reviewer for detecting this. Please see our response to Point #2 of the Essential Revisions outlined in the Editor’s letter.

Issue pertaining to claim of enhancer-promoter-specific interactions:

The statement "several CREs are capable of interacting specifically with the native Sp-kirrelL promoter" (274-276) should be rephrased and clarified. I would not use the word "interact" to describe an observation about the output of a combination of two CREs because this word suggests physical CRE-promoter looping, for which no direct evidence is presented. Wording like "super-additive/synergistic activity" would be more clear.

We have changed “interacting” to “functioning in concert”. (Line 259)

Furthermore, in claiming that pairs of elements interact specifically/display super-additive activity, the authors rightfully state that, e.g., B+sp-kirrelLprm+endo16prm displays activity while B+endo16prm does not drive any reporter expression. However, given that sp-kirrelLprm+endo16prm itself drives expression, the activity of B+sp-kirrelLprm+endo16prm must be greater than the sum of the activities of B+endo16prm and sp-kirrelLprm+endo16prm in order to state that B and sp-kirrelLprm interact super-additively. In other words, the activity of kirrelLprm+endo16prm must be taken into account.

Considering this activity, it does appear that B, C, E, F, H and I do act super-additively with Sp-kirrelLprm, considering at least one of the metrics of % of embryos expressing and % with PMC-specific expression (e.g. C+endo16prm drives GFP expression in 8.6% of embryos, Sp-kirrelLprm+endo16prm drives expression in 19%, and C+Sp-kirrelLprm+endo16prm drives expression in 37.8%, which is greater than 19+8.6). A+Sp-kirrelLprm+endo16prm and D+Sp-kirrelLprm+endo16prm, on the other hand, drive GFP expression both with less frequency and less PMC specificity than Sp-kirrelLprm+endo16prm, so I do not think it can be said that these elements interact specifically with kirrelLprm, and it seems that they do not have enhancer activity and may not be functional elements at all. If this is why BAC deletion constructs were not made for A and D, this should be explicitly stated.

We agree with the reviewer’s assessment and so never claim in the manuscript that A and D are functional elements. We have added a statement to the BAC results stating that deletions of A and D were not tested as there was no indication from the plasmid reporter analysis that they were functional elements.

It is interesting that several X+Sp-kirrelLprm+endo16prm combinations are more PMC-specific than Sp-kirrelLprm+endo16prm alone. This suggests that some of these elements may not only be enhancers, but also have silencer activity necessary to drive kirrelL expression in the proper spatial pattern. It is an interesting finding, in line with Gisselbrecht et al. Mol. Cell. (2020)'s finding that many silencers are enhancers in alternate tissue contexts, that should be highlighted.

This is an interesting point, but we hesitate to push it as the tandem arrangement of promoters in the kirrelLprm+endo16prm construct is unusual.

Finally, the interpretation in lines 269-271 that "the presence of the native Sp-kirrelL promoter mitigated the need for the C.ChIP element within element C to be adjacent to the promoter for strong PMC-specific GFP expression" (and restated in 274-276) is not strongly supported. Placing a spacer sequence with no enhancer or silencer activity in between C.ChIP and the promoter, and showing that this decreases activity as compared to when C.ChIP is adjacent to the promoter, would support this. However, the current data leave open the possibility that the part of element C downstream of C.ChIP contains sites for repressive factors, especially given that there is such a large difference in the activity of C.DNase and C.ATAC even though the former is only ~150 bp longer.

We hadn’t considered this interpretation and thank both Reviewers 1 and 3 for raising the point. To test whether the effect of deleting the region between C.ChIP and the promoter was due to the removal of repressor sites or to a change in the spacing between C.ChIP and the promoter (our original interpretation), we generated and tested a new construct that contained the region in question but in which the sequence of that region was randomly scrambled. We found that insertion of this sequence decreased activity compared to when C.ChIP was directly adjacent to the promoter. This strongly supports the view that the principle effect of deleting this region was to decrease the spacing between C.Chip and the promoter rather than removing repressor sites. These new data are shown in new Figure 4—figure supplement 3D,E. (Line 250-258)

kirrelL gene/protein tree:

Ettensohn and Dey Dev. Biol. (2017) show a protein tree in which Sp-kirrelL, Lv-kirrelL and Pm-kirrelL cluster together within a set of transmembrane Ig-domain proteins, but I have not found such an analysis for the sequences of kirrelL proteins in the other species whose kirrelL cis-regulatory regions are tested for activity in this manuscript. This is necessary to confirm the identity of these kirrelL genes. If such an analysis has been published, that paper should be cited.

We have generated a new protein tree containing the additional echinoderm KirrelL protein sequences, all of which cluster convincingly with the sea urchin KirrelL proteins, and have included it as Figure 6—figure supplement 1.

Description of cross-species experiments:

The sequences or coordinates of the putative kirrelL CREs from multiple species tested in reporter assays should be provided.

We have added this information in new Figure 6 – source data 2.

When describing the cross-species CRE reporter experiments (lines 376-381), please explicitly state the species for which the expression pattern of kirrelL is unknown, as this is relevant to the interpretation of these experiments.

We have added the following sentence: “To date, the embryonic expression of kirrelL has been examined in two sea urchins (S. purpuratus and L. variegatus) and a brittle star (A. filiformis) (Ettensohn and Dey, 2017; Dylus et al., 2018); in all three species, embryonic expression is restricted to skeletogenic mesenchyme cells.” (Line 316-319)

Also, the choice to examine the expression of kirrelL in the adult rudiment of L. variegatus rather than that of S. purpuratus needs to be explained.

We chose to work with L. variegatus here because this species can be raised through feeding larval stages much more quickly and easily than S. purpuratus. KirrelL expression and function has been characterized just as thoroughly in L. variegatus as in S. purpuratus (Ettensohn and Dey, 2017).

Finally, when presenting the results of the promoter swap experiment, I would explicitly state that PmG1 and PmG2 each confer a roughly similar increase in expression frequency and specificity to C+endo16prm as Sp-kirrelLprm does to more clearly convey that PmG1 and G2 can substitute for Sp-kirrelLprm in a meaningful way.

This statement has been added. (Line 375-377)

Reviewer #2:

[…] Overall, this is a beautifully conducted study. The results are presented very clearly in both text and figures. Some specific questions and concerns follow below (numbers refer to line numbers in the manuscript):

178. What is the justification for using the core promoter of a different gene for these experiments? Given that some enhancers show selectivity for nearby core promoters (at least in other systems), this seems like an odd choice.

In our initial experiments, we chose to use the EpGFPII reporter because this plasmid, originally developed in Eric Davidson’s lab, has been very widely used for cis-regulatory studies in sea urchins. EpGFPII was designed with a basal sea urchin core promoter (from the endo16 gene) that by itself does not drive appreciable reporter expression but that can be activated by many sea urchin enhancers. This reporter plasmid has proven very useful for comparing the activity of CREs in the context of a consistent and “neutral” core promoter element. On the other hand, the reviewer is absolutely correct that some enhancers show selectivity for promoters; for example, by tethering to specific elements in the proximal promoter region. As described in the paper, during the course of our work we did indeed uncover evidence of specific interactions between the endogenous kirrelL promoter region and distal CREs.

Figure 2B. I couldn't find any information about the number of replicates for these experiments, or any of the subsequent reporter assays presented in subsequent figures. A detailed tabulation for every separate experiment is not necessary, but a general statement about the number of replicates in a typical experiment would be very reassuring.

There’s a wide range here over the different constructs tested so it’s difficult to generalize. For constructs that were expressed very robustly and for which a single replicate yielded very large numbers of GFP-expressing embryos, we sometimes performed only a single trial. For constructs that yielded lower numbers of GFP-expressing embryos, however, multiple trials were needed to confirm a lack of expression or to produce enough GFP-expressing embryos to score a spatial expression pattern. Lastly, some constructs were used repeatedly as internal controls for the analysis of other constructs and so were injected 5-10 times. This is why in Figure 2 – source data 1 the number of injected embryos varies considerably from construct to construct. For what it’s worth, Figure 2 – source data 1 also shows that >20,000 injected embryos were scored during the course of this study.

196-198. The explicit criteria for defining "strong" and "weak" expression are helpful. That said, it wasn't immediately obvious from Figure 2C how these differ when looking at the images for ABC and C (weak) versus the other constructs (strong). The weak constructs look a bit out of focus but that could simply be the weaker signal. How consistent are these differences among embryos and from replicate to replicate?

The “weak PMC” and “strong PMC” designations are not based on our qualitative assessment of the intensity of the fluorescence. First, we scored as “expressing” every embryo that had any cells with detectable GFP (or mCherry) fluorescence. Unavoidably, this was limited by the sensitivity of our particular imaging system, but we used the same imaging system and parameters throughout our analysis (i.e., for all replicates). In addition, the scoring was all done by the same individual (J. Khor) who scored living embryos and was therefore able to focus through each specimen. It is important to note that the images in the paper show only single focal planes, and some cells are therefore out of focus. Next, all cells that exhibited detectable levels of fluorescence were scored for expression territory (PMC only, ectopic only, or PMC + ectopic), which provided a reliable estimate of the PMC-specificity of reporter expression. The determination of “weak” vs. “strong” PMC expression was based on the fraction of injected embryos that showed detectable levels of expression that was completely restricted to PMCs (no ectopic expression). If this value was <15% of injected embryos the construct was classified as “weak,” and if the value was >15%, the construct was classified as “strong”. Thus, our scoring did not require that we qualitatively guess at whether the intensity of the fluorescence was “weak” or “strong” in any individual embryo. We’re confident that variation in the intensity of the fluorescence was captured by our scoring system, as we found that constructs that produced qualitatively very faint fluorescence always fell into the bin of “weak PMC” expression, presumably because many embryos had low levels of expression that were below the detection limit of our imaging system.

212-214. Could this result also be explained by the presence of binding sites for repressors in ABC that BC.ATAC lacks?

We hadn’t considered this interpretation and thank both Reviewers 1 and 3 for raising the point. To test whether the effect of deleting the region between C.ChIP and the promoter was due to the removal of repressor sites or to a change in the spacing between C.ChIP and the promoter (our original interpretation), we generated and tested a new construct that contained the region in question but in which the sequence of that region was randomly scrambled. We found that insertion of this sequence decreased activity compared to when C.ChIP was directly adjacent to the promoter. This strongly supports the view that the principle effect of deleting this region was to decrease the spacing between C.Chip and the promoter rather than removing repressor sites. These new data are shown in new Figure 4—figure supplement 3. (Line 250-258)

249-250. What was the basis for considering this region to be the core promoter?

In the literature, core promoters are usually described as flanking the transcriptional start site by +/- 50 bp. We seem to have been a bit too generous here at ~300 bp and so have altered to text to read: “We found that a 301 bp region surrounding the transcriptional start site, a region we considered to include the Sp-kirrelL core promoter…”. (Line 219-221)

251-252. Are these features (strong, ubiquitous) true of the core promoter that was used for the experiments? If not, the earlier concern about choice of core promoter for the experiments is even more acute.

Please see our response to Point #2 of the Essential Revisions required by the Editor.

265-268. This is an interesting result. What does it imply mechanistically?

We discuss the evolutionary conservation of echinoderm kirrelL cis-regulatory CREs in the last section of the Discussion.

342. Why so much redundancy? This is touched on only briefly in the Discussion but seems like an important result.

We discuss this redundancy at length in the last paragraph of the section in the Discussion titled “The cis-regulatory apparatus of Sp-kirrelL.” We have also added a sentence citing a recent review on enhancer redundancy. (Line 457-459)

352-354. Is there any indication here (or in the previous results) of ectopic expression?

More generally: The experiments do not seem geared to detect possible repressive functions for any of the regulatory elements. Are there reasons for thinking that repressive functions would not be needed? What keeps kirrelL from being transcribed outside of the single cell type where it is expressed?

Most of our analysis involved light microscopic observations of live transgenic embryos, which does allow us to detect ectopic expression and therefore to identify to CREs that might act to repress kirrelL expression in non-PMC territories. In general, we found no evidence of such repressive elements. We believe the cell type-specific expression of kirrelL is explained by the fact that two essential, positive regulators, Alx1 and Ets1, are co-expressed only in the PMC lineage and not in any other cells of the embryo. Alx1 is activated early in cleavage and is entirely restricted to the large micromere-PMC lineage throughout development. Ets1 is initially expressed specifically in the PMC lineage, although it is later expressed by a subset of non-skeletogenic mesoderm cells. Our mutational analysis of element C indicates that direct inputs from both Ets1 and Alx1 are required for activity (i.e., the two TFs act combinatorially, not redundantly), because mutation of either Alx1 half-site 2 or Ets1 site 1 abolishes the activity of the C element.

Figure 5: modifying the key in the lower left as follows might help make it easier to interpret panel C: GFP (deletion) mCherry (intact).

This change has been made and clarifies the figure.

376: Mention the extent of region tested here so that readers don't need to consult other parts of the paper to understand the basic experimental design. If not exactly the same region in all of the species, mention that, too.

We’ve added a statement here mentioning that we tested regions ~1-2 kb in size directly upstream of the translational start codon and have added a new table (Figure 6 – source data 2) that shows the precise genomic coordinates of the regions that were used. (Line 320-321)

383-384. The results support function being highly conserved. What about sequence? It looks like there is some patchy short sequence conservation between two sea urchins (Figure 1C) and two sea stars (Figure 7A). What about between these groups?

We thank the reviewer for recommending additional analysis here. The results have been added to the revised manuscript, as described in our response to the Editor’s letter (above).

In the literature "conserved regulatory element" more commonly applies to sequence than function. To avoid confusion, qualify "conserved" throughout the manuscript to clarify whether sequence or function is being discussed.

We thank the reviewer for catching this and have clarified our use of “conserved” throughout the manuscript.

447-448. Is there evidence for sequence conservation (and see above)?

Please see above.

622-623. Is this sentence intended to mean that specific binding sites are conserved? Or that binding sites for the same transcription factors are present? This is an important distinction. There is evidence from other systems that individual binding sites can turn over while conserving regulatory element function. That seems much more plausible in this case than super-strong conservation of tiny patches of sequence.

This sentence is intended to suggest that the same transcription factors likely mediate tethering between the C element and the promoter in both urchins and sea stars and that binding sites for these same proteins exist in both taxa. Of course, the order and spacing are probably very different and, as the reviewer points out, it is certainly possible that the specific sequences might have diverged to some extent, although they would still need to bind the same proteins and so would have to be at least partially conserved.

There are examples from other groups (especially vertebrates) where a regulatory element shows conserved function among highly divergent species. It would be helpful to mention this in the Discussion to provide some context. Is this the first reported case of conserved regulatory element function among deeply divergent echinoderms? If so, this is worth mentioning explicitly, again for context.

We mention the conservation of regulatory elements in other organisms in Paragraph 2 of the section on “Evolutionary conservation of echinoderm kirrelL CREs,” and cite a useful review by Rebeiz et al. Hinman et al. (2007) carried out cross-specific experiments and argued that the function of a module of Otx (OtxG) module is conserved in sea stars and sea urchins. Although we think our data are more thorough and compelling, we’ve added a sentence to the Discussion citing the Hinman paper and referring to our study as the second reported case.

Reviewer #3:

[…] The paper is really well written and logically presented. If it were simply a cis regulatory story on a random gene I would have recommended a lower level journal. However, here the impressive conservation of the cis regulatory region elevates the paper quite significantly. Still, they don't show anything of the cis-regulatory region sequences, and these would help improve the paper – is the conservation actually small islands perhaps the Alx1 and Ets binding regions? Is it the basal promoter primarily? Or is the entire region fairly well conserved? The answer to those questions will be helped with the sequences. I point out that illustrating the protein sequences across the phylum is OK but is not really the focus of this paper.

We thank the reviewer for recommending additional analysis here. Additional information regarding CRE sequence conservation has been added to the revised manuscript, as described in our response to the Editor’s letter (above).

The other point that I think needs better quantification is the call that anything above 15% expression is considered "strong". I realize that these kind of reporter assays sometimes have a low percentage read-out, but the question is whether some elements are stronger than others. I ask simply the question about the strongest of the so-called strong vs the weakest of the so-called strong.

We agree with the reviewer that the binning we applied to the reporter data is an abstraction and almost certainly obscures some differences between constructs, but this kind of semi-quantitative scoring system was the only feasible option we could come up with given the large number of constructs we tested. We were concerned about making the assessment too granular and perhaps less reliable, so we chose to separate the constructs that showed PMC-specific expression into only two bins (“strong” and “weak”). The 15% cutoff was chosen arbitrarily, but whatever the threshold there will always be constructs that fall just above and below the boundary.

There are several components of the paper that would benefit from some revision to help me understand some of the interpretations.

1. In Figure 1 showing ATAC-seq, DNAse hypersensitivity, ChIP seq data how did you call the peaks? Some, especially G, the promoter, are obvious but others are less so, and still others look similar to peaks you called as enhancers.

The ATAC-seq, DNase-seq, ChIP-seq,and eRNA peaks shown in Figure 1 were identified in previous published studies by Shashikant et al. (2018), Khor et al. (2019), and Khor et al., (2021), which are cited in the Figure 1 legend. In each case, the specific parameters used for peak-calling can be found in those publications.

2. You indicate that in scoring expression that greater than 15% of the embryos expressing a construct is strong expression. I understand some of the many reasons why 85% might not express. But, I would also like to know if some are stronger than others. For example is ABCDEFG stronger than DEFG and is that stronger than G? Also in Figure 2 I notice that C is indicated as weaker. The embryo illustrated has fewer fluorescent PMCs than other embryos in this panel with stronger promoters. Is it possible that element C somehow operates in a restricted number of cell bodies rather than all of them? After all, you show in other papers that there are mRNAs that are expressed in a restricted subset of PMCs even within the syncytium. Along the same line, although you indicate that Ets1 sites 2 and 3, when mutated, still allow for expression. Your images of those show stronger expression of GFP in the ventrolateral clusters than the spread of expression when all three Ets sites are control. Is that, or could that be meaningful?

With respect to the second part of the Reviewer’s comment, our microscopic analysis of transgenic embryos was carried out at 48 hpf, which is soon after PMC fusion is complete. Because GFP protein diffuses rapidly throughout the PMC syncytium, the entire PMC network is labeled in the embryos shown in Figures 1, 2, 6, S1-S5, and S7, despite the mosaic incorporation of transgenes in sea urchin embryos. This diffusion of GFP also means that possible regional variations in kirrelL expression during late development cannot be reliably detected using this reporter protein. The possibility that there is region-specific transcriptional regulation of kirrelL and other PMC effector genes at late embryonic stages is indeed very interesting to us and we are working on this problem separately, but this analysis will require the use of different (non-diffusible) reporter proteins.

Also, please note that our scoring did not require that we qualitatively estimate whether the intensity of the fluorescence in any individual embryo was “weak” or “strong”. We scored as positive every embryo that had any cells with detectable GFP (or mCherry) fluorescence. This was limited by the sensitivity of our particular imaging system, but we used the same imaging system and imaging parameters throughout our analysis (i.e., for all replicates). In addition, the scoring was all done by the same individual (J. Khor) who scored living embryos and was therefore able to focus through each specimen (note that the images in the paper show only single focal planes, and some cells are therefore out of focus). The determination of “weak” vs. “strong” PMC expression was based on the fraction of injected embryos that showed detectable levels of fluorescence (if this value was <15% of injected embryos the construct was classified as “weak,” and if the value was >15%, the construct was classified as “strong”). We’re confident that intensity of the fluorescence was captured by our scoring system, as we found that constructs that produced qualitatively faint fluorescence consistently fell into the bin of “weak” expression, presumably because many embryos had low levels of reporter protein that were below the detection limit of the imaging system. This qualitative scoring system definitely isn’t perfect, but the very large number of constructs we tested precluded us from more rigorously measuring the level of expression of each construct and we did use a quantitative approach (Nanostring) for the key BAC constructs.

3. The data in Figure 5 I find to be most valuable to the paper. That includes the nanostring data to indicate contributions relative to an mCherry control construct which is most informative.

No changes required.

4. The data on other species is most interesting. I see you have an alignment of the KirrelL proteins of the several species but that isn't really the story. You don't have anything to indicate the relative alignment of the same cis regulatory regions. The real question is how are those related? Are their islands of high conservation as seen earlier by Cameron and Davidson? Are there indels outside the areas that must be conserved enough to drive expression in S. purpuratus? It seems to me that these are the sequences of interest. Yes, there is demonstrated similarity in the KirrelL protein sequence but this paper is all about the cis regulation.

We thank the reviewer for recommending additional analysis here. Additional information regarding CRE sequence conservation has been added to the revised manuscript, as described in our response to the Editor’s letter.

Associated Data

    This section collects any data citations, data availability statements, or supplementary materials included in this article.

    Data Citations

    1. Shashikant T, Ettensohn CA, Khor JM. 2018. Global analysis of primary mesenchyme cell cis-regulatory modules by chromatin accessibility profiling. NCBI Gene Expression Omnibus. GSE96927 [DOI] [PMC free article] [PubMed]
    2. Khor JM, Guerrero-Santoro J, Douglas W, Ettensohn CA. 2021. Global patterns of enhancer activity during sea urchin embryogenesis assessed by eRNA profiling. NCBI Gene Expression Omnibus. GSE169227 [DOI] [PMC free article] [PubMed]
    3. Khor JM, Guerrero-Santoro J, Ettensohn CA. 2019. Genome-wide identification of binding sites and gene targets of Alx1, a pivotal regulator of echinoderm skeletogenesis. NCBI Gene Expression Omnibus. GSE131370 [DOI] [PubMed]

    Supplementary Materials

    Figure 2—source data 1. Quantification of GFP expression patterns in embryos injected with reporter constructs.
    Figure 5—source data 1. Summary of NanoString analysis.
    Figure 5—source data 2. Raw NanoString data for BAC-injected embryos.
    Figure 5—source data 3. NanoString analysis probe target sequences.
    Figure 6—source data 1. Sequence coordinates for echinoderm kirrelL cis-regulatory elements (CREs) tested (Arshinoff et al., 2022; Long et al., 2016).
    Figure 6—source data 2. DNA sequences for cis-regulatory elements (CREs) validated in this study from Eucidaris tribuloides (Et-kirrelL), Parastichopus parvimensis (Pp-kirrelL), Patiria miniata (Pm-kirrelL), Acanthaster planci (Aplc-kirrelL), Ophionereis fasciata (Of-kirrelL), and Anneissia japonica (Aj-kirrelL).
    Figure 6—source data 3. Echinoderm primary mesenchyme cell (PMC)-specific Ig-domain protein sequences from Strongylocentrotus purpuratus (Sp), Lytechinus variegatus (Lv), Eucidaris tribuloides (Et), Parastichopus parvimensis (Pp), Patiria miniata (Pm), Acanthaster planci (Aplc), Ophionereis fasciata (Of), and Anneissia japonica (Aj) used for tree construction.
    Transparent reporting form

    Data Availability Statement

    All raw numerical data used in this study are contained in the manuscript.

    The following previously published datasets were used:

    Shashikant T, Ettensohn CA, Khor JM. 2018. Global analysis of primary mesenchyme cell cis-regulatory modules by chromatin accessibility profiling. NCBI Gene Expression Omnibus. GSE96927

    Khor JM, Guerrero-Santoro J, Douglas W, Ettensohn CA. 2021. Global patterns of enhancer activity during sea urchin embryogenesis assessed by eRNA profiling. NCBI Gene Expression Omnibus. GSE169227

    Khor JM, Guerrero-Santoro J, Ettensohn CA. 2019. Genome-wide identification of binding sites and gene targets of Alx1, a pivotal regulator of echinoderm skeletogenesis. NCBI Gene Expression Omnibus. GSE131370


    Articles from eLife are provided here courtesy of eLife Sciences Publications, Ltd

    RESOURCES