Abstract
Objective:
To test the null hypothesis that the form and size of the pharyngeal airways in preadolescents do not differ among various skeletal patterns.
Materials and Methods:
Sixty healthy children (mean age, 11.79 ± 1.11 years) were divided into three groups by anteroposterior jaw relationships. Using cone-beam computed tomography, the inclination and the volume of the pharyngeal airway were measured and compared with craniocervical angles and cephalometric variables.
Results:
Children with Class II malocclusion have a larger angle between the FH plane and midplane of the oropharyngeal airway (ang-OA) compared with children with Class I and III malocclusion (P < .01). Ang-OA was significantly correlated with craniocervical angle (ang-cc) and anteroposterior variables, mainly ANB angle, Pog-N perpendicular (P < .01). Airway volume had a positive correlation with facial depth (P < .01).
Conclusion:
Children with Class II malocclusion have more backward orientation and smaller volume of the pharyngeal airway than do children with Class I and III malocclusion. Inclination of the oropharyngeal airway might be a key factor in determining the form of the entire pharyngeal airway and is related to head posture.
Keywords: Pharyngeal airway form, Anteroposterior facial patterns, Children, CBCT
INTRODUCTION
The pharyngeal airway (PA) is composed of three parts: the nasopharynx, oropharynx, and hypopharynx. The nasopharyngeal airway (NA) is a cone-shaped tube that consists of muscles and mucosa. It also includes the adenoid, a complex network of lymphatic tissues located in the posterior area.1 In growing children, predisposing factors, repeated infection, or inflammation usually lead to adenoid hypertrophy and constriction of the posterior airway.1 Children with narrowed NAs tend to use mouth breathing because of partially impaired nasal respiration function.2 The oropharyngeal airway (OA) lies between the soft palate and the hyoid bone. Many reports have demonstrated a relationship between various malocclusion patterns and variations in the size and form of the oropharyngeal airway caused by palate and/or tongue position.3–6
Most previous studies of the pharyngeal airway, head posture, and malocclusion, as well as facial morphology, have been carried out using a two-dimensional (2D) lateral cephalogram.7,8 Superimposition of the left and right images in the projection of a three-dimensional (3D) structure onto a 2D plane leads to errors, and the left-to-right width of the upper airway is not visible in 2D film. For these reasons, it is difficult to obtain precise sizes of the NA and to reproduce the soft tissue structures accurately from lateral cephalograms alone.9,10
Cone-beam computed tomography (CBCT) provides 3D-reconstructed images from multiple sequential planar projection images. It is possible to visualize sites of interest by adjusting the image orientation and rotation; CBCT has different gray-level intensities that allow visualization of soft tissue as well as hard tissue with different tissue densities. It also allows visualization of internal anatomic structures, such as the airway, independently by eliminating external structures.11,12 Furthermore, CBCT allows linear, angular, and planar as well as volumetric analyses.13
Recent quantitative 3D assessment of the pharyngeal airway revealed that the relationships between pharyngeal airway form and head posture or facial pattern among children with Class I, II, and III malocclusion are controversial.3,14,15
Using 3D PA measurements, we investigated the factors determining PA form and sought to identify significant relationships between airway form and craniofacial morphology in children. The null hypothesis was that the form and size of the PA do not differ among anteroposterior skeletal patterns in preadolescents.
MATERIALS AND METHODS
Subjects
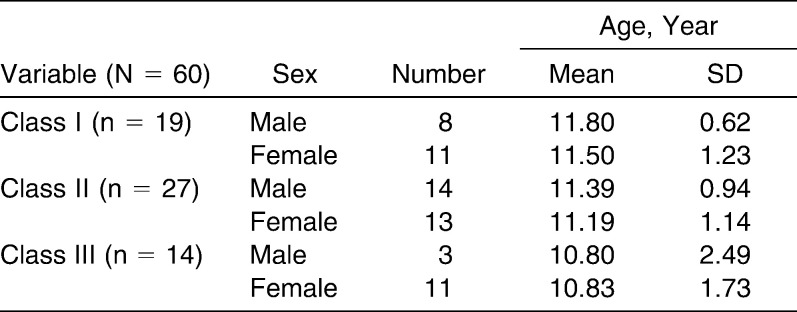
This study protocol was approved by the Ethics Review Committee at Kangdong Sacred Heart Hospital, Hallym University Medical Center, and informed consent was obtained from all parents of patients in this study (IRB 10-047). The study included CBCT scans of 60 healthy growing children (24 boys and 36 girls) aged 10 to 13 years (mean age, 11.79 ± 1.11 years) who visited the Department of Orthodontics of Kangdong Sacred Heart Hospital, Hallym University Medical Center, Seoul, Korea, for orthodontic treatment between December 2008 and April 2010. The sample was divided into three groups (Class I: 1° ≤ ANB < 4°, Class I molar relation; Class II: ANB ≥ 4°, Class II molar relation; Class III: ANB < 1°, Class III molar relation; Table 1). Children with congenital anomalies such as cleft lip and palate were excluded. Subjects who had adenoidectomy or tonsillectomy or symptoms of respiratory pathology were also excluded.
Table 1.
Distribution of Subjects According to Anteroposterior Skeletal Patterns
Methods
In this study, each patient was seated in a chair with his or her head in its natural position (mirror position)8 for CBCT. Patients were asked to bite with maximum intercuspation but not to swallow or breathe and not to move their heads or tongues. All CBCT images were obtained with the Master 3D dental imaging system (Vatech Inc, Seoul, Korea) with the following parameters: 90 kV, 3.6 mAs, 15-second scan time, and 20 cm × 19 cm field of view. The slice thickness was set at 0.3 mm, and the voxel size was 0.3 × 0.3 × 0.3 mm3. The 3D images were transformed to DICOM (digital imaging and communications in medicine) and reconstructed with the InVivoDental software (Anatomage Inc, San Jose, Calif).
Then, on multiple planar reconstruction images, they were reoriented using the FH plane as the horizontal reference plane. The sagittal plane was constructed through ANS, crista galli (Cg), and opisthion (Op) and was perpendicular to the horizontal plane (Figure 1).
Figure 1.
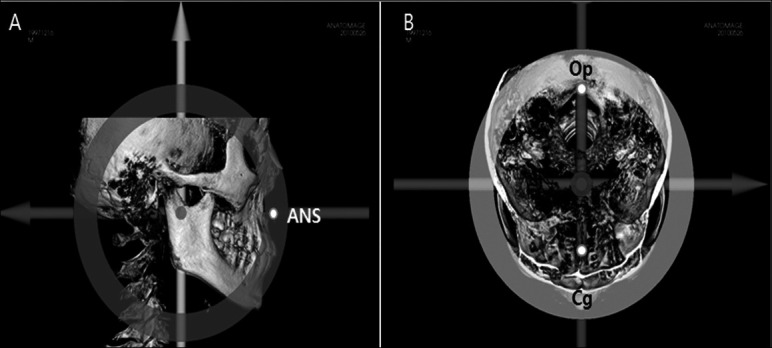
Reorientation on a basis of FH plane and coordination axis based on midsagittal plane passing through ANS (anterior nasal spine), Cg (crista galli), and Op (opisthion). (A) Sagittal view included ANS. (B) Axial view included Cg, Op.
The size of the face was measured by constructing a prism from reoriented 3D images. The bizygomatic width (the distance of left and right zygion), the nasion-menton distance, and the basion-ANS distance were projected on the x-axis, y-axis, and z-axis, respectively.16 We calculated the volume of that prism and defined it as the size of face.
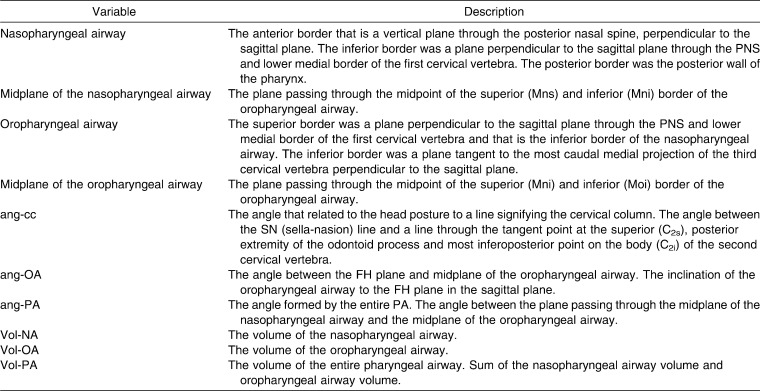
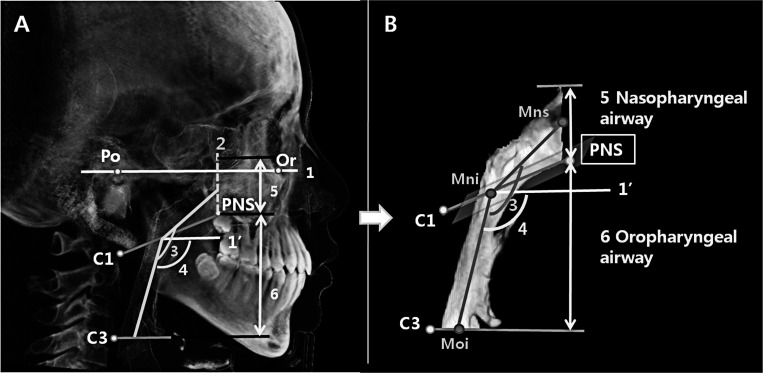
Using InVivoDental software, we isolated the PA with the two segments, the upper (nasopharyngeal airway) and lower (oropharyngeal airway) compartments. We measured the nasopharyngeal airway volume (Vol-NA) and the oropharyngeal airway volume (Vol-OA),16 where the total pharyngeal airway volume (Vol-PA) was the sum of Vol-NA and Vol-OA. We also measured the inclination of the oropharyngeal airway to the FH plane in the midsagittal plane (ang-OA) and the angle formed by the entire PA (ang-PA; Table 2; Figure 2). To assess head posture, we measured the craniocervical angle (ang-cc) at the uppermost part of the cervical spine8 (Table 2; Figure 3).
Table 2.
Variables About the Three-Dimensional Pharyngeal Airway Identified in This Study
Figure 2.
Reference planes and pharyngeal airway measurements used in this study. (1) FH plane: the plane including porion (Po) and orbitale (Or). (1′) FH′ plane: the plane that is parallel to the FH plane and passing through the posterior nasal spine (PNS). (2) The anterior border of the nasopharyngeal airway, which is the coronal plane passing through the posterior nasal spine (PNS) and superior tip of the nasopharyngeal airway. (3) ang-PA. (4) ang-OA. (5) Vol-NA. (6) Vol-OA.
Figure 3.
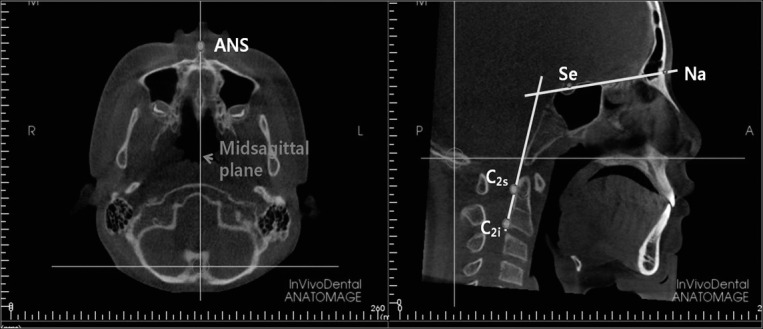
Craniocervical angle formed by the SN (sella-nasion) line and a line through the tangent point at the superior (C2s), posterior extremity of the odontoid process and most inferoposterior point on the body (C2i) of the second cervical vertebra in the reoriented midsagittal plane passing through the ANS.
The lateral cephalometric images were obtained from 3D images and analyzed with the V-Ceph software, version 5.5 (Osstem Inc, Korea). The same investigator identified cephalometric landmarks, measured five anteroposterior measurements, and repeated this procedure two times (Table 3).
Table 3.
Two-Dimensional Anteroposterior Cephalometric Variables Used in This Study
Statistical Analysis
The same investigator measured and analyzed all cephalometric variables, including craniocervical angle and PA dimensions. To assess intra-investigator errors, 15 randomly selected 3D images were remeasured 1 week after the first evaluations. No systematic errors were found based on paired t-tests.
Means and standard deviations were calculated. We tested for the normality of the distributions, with an alpha value .05 of the significance level, for all continuous variables using SPSS 17.0 for Windows (SPSS Inc, Chicago, Ill).
Multiple regression analysis was used to assess the interaction among variables, controlling for age, sex, and size of face. The Scheffé test was carried out to compare the PA measurements among Classes I, II, and III malocclusion. Pearson's correlation coefficient test was performed to identify any relationships between the PA and craniofacial morphology.
Random error was calculated by Dahlberg's formula from 0.39 mm to 2.14 mm in linear measurements, from 9.79 mm2 to 34.58 mm2 in area measurements, and from 119.46 mm3 to 165.90 mm3 in volume measurements.17
RESULTS
In the multiple regression model, none of the angular measurements of the PA were significantly different (P > .05) after controlling for the effects of age, sex, and size of face. But in volumetric measurements, both Vol-NA and Vol-OA were decreased by aging (P < .05; Table 4).
Table 4.
Analysis of the Pharyngeal Airway Measurements by Multiple Regression Models Controlling for Age, Sex, and Size of Face
Pearson's correlation coefficients among the PA measurements are shown in Table 5. Craniocervical angle (ang-cc) correlated positively with ang-OA (P < .01) and ang-PA (P < .01), which represent the form of the PA. Vol-NA was associated with Vol-OA in a positive direction (P < .01).
Table 5.
Correlations Among the Pharyngeal Airway Measurements
In the comparisons of Class I, II, and III malocclusions with the PA measurements by the Scheffé test, ang-OA was significantly larger in Class II than in Class I or Class III (P < .01, P < .01). That is, subjects with Class II malocclusion had a more backward orientation of the airway to the FH plane in the sagittal plane, whereas children in Class II had a more vertical orientation of the airway relatively. PA volumes (Vol-NA, Vol-OA, Vol-PA) were smaller in Class II than in Class I and III, but this difference was not significant (P > .05; Table 6).
Table 6.
Comparison of the Pharyngeal Airway Measurements According to Anteroposterior Skeletal Patterns by Analysis of Variance Test
To evaluate the relationship between the form and size of the PA with anteroposterior skeletal patterns in preadolescents, we examined the co-relationship between 3D pharyngeal airway variables with the 2D cephalometric measurements. ang-OA was positively correlated with ANB (P < .01) but negatively correlated with Pog-N perpendicular (P < .01), which means Class II children have a tendency to show larger ang-OA compared with Class I or III children. Vol-OA were significantly correlated with facial depth (P < .01; Table 7).
Table 7.
Correlations Between the Pharyngeal Airway Measurements and the Anteroposterior Cephalometric Measurements
DISCUSSION
Abnormal development of the upper airway is related to airway constriction, and the relationship relevance between reduced respiratory function and craniofacial growth has long been of interest to orthodontists.3,14,18–22 In general, the PA is an organ composed of 20 or more muscles that are attached proximally to skeletal structures and whose size and form are affected by the developing craniofacial skeleton.1,23
Aboudara et al.9 showed that the resistance of airflow is related to airway size as well as form. So if the airway has a large volume but is bent, then this airway resistance could greatly affect respiration. An airflow test, nasoendoscope examination, nasal resistance measures, and lateral cephalograms were used in diagnosing nasal obstruction. Lateral cephalograms in particular have been a very helpful tool because of their simplicity, low cost, and reproducibility.24 On the other hand, since growing children have various airway sizes and forms, there were significant variations in the volumetric airway measurements. So, despite the usefulness of lateral cephalograms for measuring the area and size of simple structures such as the adenoid, there are limitations when assessing more complex 3D structures such as the PA.24 Lateral cephalograms do not allow visualization of the deepest structures, such as the retroglossal or retropalatal areas, or the detection of small airway volumes and variances derived from various airway forms.9,18
In this study, no significant difference between sex, age, and face size was found for angular variables, such as ang-cc, ang-OA, and ang-PA. Other reports showed no sex-specific difference in PA size or form in children.3,15 However, in volumetric measurements, Vol-NA and Vol-OA showed a shrinking tendency by aging. Small adenoids in infancy rapidly increase and reach a peak from 9 to 13 years of age. When adenoids are enlarged, NA becomes narrow. After 15 years of age, adenoids gradually shrink and then totally disappear at about 20 years of age (Table 4).1,10,25
Solow and Sandham8 showed that the craniocervical angle is relatively small in subjects with mandible prognathism and large in subjects with mandible retrognathism. They hypothesized that a change in head posture affects the craniocervical angle and the position of the jaw and tongue. A postural change such as head extension causes a down-backward rotation of the mandible. This alteration of jaw posture leads to stretching of the lips, cheeks, and musculature and affects malocclusion and growth pattern. Then, the airway is opened and stabilized as necessary to compensate for the reduced respiratory function caused by the constricted airway and to maintain the airway.2,8,25 In this study, children underwent CBCT scanning with their heads in the natural upright position to represent their usual and typical posture.
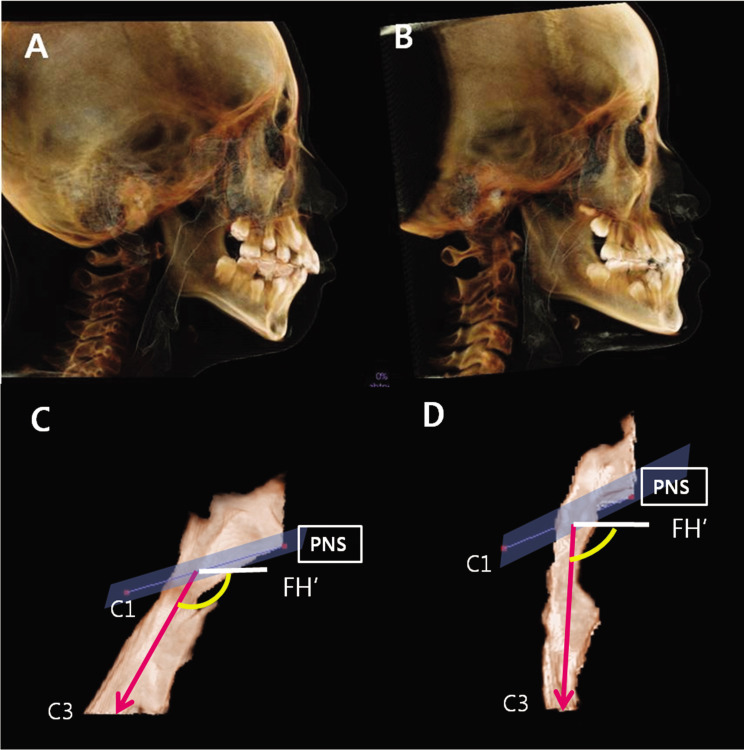
According to our assessment for the correlation between head posture and PA form, we found that the larger ang-cc is, the larger ang-PA is and the more backward orientation of the OA (P < .01; Table 5). In addition, the average ang-OA and ang-cc were larger in Class II malocclusion and represented a backward PA to the FH plane. Also, those angles were smaller in Class III malocclusion and represented a forward PA form (P < .01; Table 6; Figure 4). This is similar to a report by Grauer et al.16 that found that the adolescent airway in the sagittal plane was observed in a more backward orientation to the FH plane in the skeletal Class II group and as a more vertical orientation in the skeletal Class III group. Those who belonged to Class II exhibited smaller Vol-NA and Vol-OA than those with Class I and III malocclusion, and Vol-OA was greater in Class III among the 3 groups. However, this trend was not statistically significant (P > .05; Table 6). Iwasaki et al.3 reported that children with Class III malocclusion had larger OA size than Class I malocclusion but in NA size did not differ significantly between those two groups. Kim et al.15 showed that the mean total airway volume in the Class II group was smaller than in the Class I group, but there were no differences in the volume measurements of airway subregions. Those findings corroborate our results and might indicate that different anteroposterior skeletal patterns lead to pharyngeal airway modification by changed posture, maintaining airway size on a similar level.10
Figure 4.
Types of pharyngeal airway form according to anteroposterior facial patterns. (A, C) More backward orientation of the oropharyngeal airway to the FH plane in skeletal Class II group. (B, D) More vertical orientation of the oropharyngeal airway in skeletal Class III group.
Our findings show positive correlation between ang-OA and ANB angles and negative correlations between ang-OA and Pog-N perpendicular (P < .05; Table 7). The more retrusive the position of the mandible is, the more backward the orientation of the OA is. These results also reveal that patient head posture is an important factor in characterizing the pharyngeal airway. In addition, Vol-OA had positive correlations with facial depth (P < . 01; Table 7), which is consistent with Iwasaki's report that the Class III malocclusion is associated with a larger OA than that of Class I malocclusion.
In this study, we showed that PA forms in the sagittal plane in preadolescents are significantly correlated to ang-OA. These forms are affected by head posture measured by the craniocervical angle (ang-cc) and are related to anteroposterior skeletal patterns. Class II children displayed a relatively backward inclination and narrowed airway as compared with Class I and III children. On the other hand, Class III children had more upright or forward airway shapes. Previous studies corroborate our findings and indicate that airway 2D and 3D measurements of size and shapes are related to anteroposterior skeletal patterns.4,13,14,15,19 Solow and Sandham8 reported that craniocervical posture is a factor in the development and function of the dentofacial structures. With flexion of the head, there was forward rotation of the mandible, but with extension of the head, growth was vertical and there was no forward rotation of the mandible. Lee and Kim4 explained that the nasopharyngeal area had a positive relationship with the mandibular body length on the sagittal view. Kim et al.14 explained that the compensational changes in airway width and facial growth were found in Class III patients, who had narrow upper airways. The authors showed that children aged 9 to 11 years who have narrow airways tended to exhibit protrusive growth of the maxilla and mandible in puberty.
In summary, when diagnosing and treating preadolescent children with malocclusion, orthodontists should recognize PA morphologies that might be predisposing factors of undesirable craniofacial development.
CONCLUSIONS
By using CBCT, volumetric assessment of the 3D pharyngeal airway was possible.
The form of the PA is related to the inclination of OA (ang-OA) and the craniocervical angle (ang-cc).
In the skeletal Class II group, the average inclination of OA (ang-OA) was significantly larger and the OA in the sagittal plane was shown as a more backward orientation to the FH plane. In the skeletal Class III group, children showed a smaller ang-OA and a more vertical orientation.
The inclination of OA (ang-OA) was significantly correlated to anteroposterior variables, mainly ANB angle and Pog-N perpendicular.
REFERENCES
- 1.Dunn G. F, Green L. J, Cunat J. J. Relationships between variation of mandibular morphology and variation of nasopharyngeal airway size in monozygotic twins. Angle Orthod. 1973;43:129–135. doi: 10.1043/0003-3219(1973)043<0129:RBVOMM>2.0.CO;2. [DOI] [PubMed] [Google Scholar]
- 2.Linder-Aronson S. Adenoids: their effect on mode of breathing and nasal airflow and their relationship to characteristics of the facial skeleton and the dentition. A biometric, rhino-manometric and cephalometro-radiographic study on children with and without adenoids. Acta Otolaryngol. 1970;265:1–132. [PubMed] [Google Scholar]
- 3.Iwasaki T, Hayasaki H, Takemoto Y, Kanomi R, Yamasaki Y. Oropharyngeal airway in children with Class III malocclusion evaluated by cone-beam computed tomography. Am J Orthod Dentofacial Orthop. 2009;136:318.e311–319. doi: 10.1016/j.ajodo.2009.02.017. [DOI] [PubMed] [Google Scholar]
- 4.Lee Y. S, Kim J. C. A cephalometric study on the airway size according to the types of the malocclusion. Korean J Orthod. 1995;25:19–29. [Google Scholar]
- 5.Kwak S. Y, Kim H. Y, Jeon Y. M, Kim J. G. Airway size in malocclusion with hyperdivergent skeletal pattern. Korean J Orthod. 2003;33:293–305. [Google Scholar]
- 6.Joseph A. A, Elbaum J, Cisneros G. J, Eisig S. B. A cephalometric comparative study of the soft tissue airway dimensions in persons with hyperdivergent and normodivergent facial patterns. J Oral Maxillofac Surg. 1998;56:135–139. doi: 10.1016/s0278-2391(98)90850-3. [DOI] [PubMed] [Google Scholar]
- 7.Muto T, Yamazaki A, Takeda S, et al. Relationship between the pharyngeal airway space and craniofacial morphology, taking into account head posture. Int J Oral Maxillofac Surg. 2006;35:132–136. doi: 10.1016/j.ijom.2005.04.022. [DOI] [PubMed] [Google Scholar]
- 8.Solow B, Sandham A. Cranio-cervical posture: a factor in the development and function of the dentofacial structures. Eur J Orthod. 2002;24:447–456. doi: 10.1093/ejo/24.5.447. [DOI] [PubMed] [Google Scholar]
- 9.Aboudara C, Nielsen I, Huang J. C, Maki K, Miller A. J, Hatcher D. Comparison of airway space with conventional lateral headfilms and 3-dimensional reconstruction from cone-beam computed tomography. Am J Orthod Dentofac Orthop. 2009;135:468–479. doi: 10.1016/j.ajodo.2007.04.043. [DOI] [PubMed] [Google Scholar]
- 10.Ceylan I, Oktay H. A study on the pharyngeal size in different skeletal patterns. Am J Orthod Dentofac Orthop. 1995;108:69–75. doi: 10.1016/s0889-5406(95)70068-4. [DOI] [PubMed] [Google Scholar]
- 11.Chang H. S, Baik H. S. A proposal of landmarks for craniofacial analysis using three-dimensional CT imaging. Korean J Orthod. 2002;32:313–325. [Google Scholar]
- 12.William C, Scarfe A. G. F. What is cone-beam CT and how does it work? Dent Clin North Am. 2008;52:707–730. doi: 10.1016/j.cden.2008.05.005. [DOI] [PubMed] [Google Scholar]
- 13.Magni A. Cone beam computed tomography and the orthodontic office of the future. Semin Orthod. 2009;15:29–34. [Google Scholar]
- 14.Kim Y. J, Bok G. S, Lee K. H, Hwang Y. I, Park Y. H. The relationship between upper airway width and facial growth changes in orthodontic treatment of growing children. Korean J Orthod. 2009;39:168–176. [Google Scholar]
- 15.Kim Y. J, Hong J. S, Hwang Y. I, Park Y. H. Three-dimensional analysis of pharyngeal airway in preadolescent children with different anteroposterior skeletal pattern. Am J Orthod Dentofac Orthop. 2010;137:306.e301–e311. doi: 10.1016/j.ajodo.2009.10.025. [DOI] [PubMed] [Google Scholar]
- 16.Grauer D, Cevidanes L. S, Styner M. A, Ackerman J. L, Proffit W. R. Pharyngeal airway volume and shape from cone-beam computed tomography: relationship to facial morphology. Am J Orthod Dentofac Orthop. 2009;136:805–814. doi: 10.1016/j.ajodo.2008.01.020. [DOI] [PMC free article] [PubMed] [Google Scholar]
- 17.Dahlberg G. Statistical Methods for Medical and Biological Students. London: G. Allen & Unwin Ltd; 1940. pp. 1–140. [Google Scholar]
- 18.Aboudara C. A, Hatcher D, Nielsen I. L, Miller A. A three-dimensional evaluation of the upper airway in adolescents. Orthod Craniofac Res. 2003;6(suppl 1):173–175. doi: 10.1034/j.1600-0544.2003.253.x. [DOI] [PubMed] [Google Scholar]
- 19.Hong J. S, Kim D. S, Oh K. M, Kim Y. J, Park Y. H. Three dimensional analysis of the upper airway and facial morphology in children with Class II malocclusion using cone-beam computed tomography. Korean J Orthod. 2010;40:134–144. [Google Scholar]
- 20.Hwang C. J, Ryu Y. K. A longitudinal study of nasopharynx and adenoid growth of Korean children. Korean J Orthod. 1985;15:93–103. [Google Scholar]
- 21.Jeans W. D, Fernando D. C, Maw A. R. How should adenoidal enlargement be measured? A radiological study based on interobserver agreement. Clin Radiol. 1981;32:337. doi: 10.1016/s0009-9260(81)80060-8. [DOI] [PubMed] [Google Scholar]
- 22.Kim Y. I, Kim S. S, Son W. S, Park S. B. Pharyngeal airway analysis of different craniofacial morphology using cone-beam computed tomography. Korean J Orthod. 2009;39:136–145. [Google Scholar]
- 23.Ricketts R. M. Respiratory obstruction syndrome. Am J Orthod. 1968;54:495–507. doi: 10.1016/0002-9416(68)90218-2. [DOI] [PubMed] [Google Scholar]
- 24.Major M. P, Flores-Mir C, Major P. W. Assessment of lateral cephalometric diagnosis of adenoid hypertrophy and posterior upper airway obstruction: a systematic review. Am J Orthod Dentofacial Orthop. 2006;130:700–708. doi: 10.1016/j.ajodo.2005.05.050. [DOI] [PubMed] [Google Scholar]
- 25.Subtelny J. D, Baker H. K. The significance of adenoid tissue in velopharyngeal function. Plast Reconstr Surg. 1956;17:235–250. doi: 10.1097/00006534-195603000-00008. [DOI] [PubMed] [Google Scholar]


