Abstract
T cells acquire a regulatory phenotype when their T cell receptors (TCRs) experience an intermediate-to-high affinity interaction with a self-peptide presented via the major histocompatibility complex (MHC). Using TCRβ sequences from flow-sorted human cells, we identified TCR features that promote regulatory T cell (Treg) fate. From these results, we developed a scoring system to quantify TCR-intrinsic regulatory potential (TiRP). When applied to the tumor microenvironment, TiRP scoring helped to explain why only some T cell clones maintained the Tconv phenotype through expansion. To elucidate drivers of these predictive TCR features, we then examined the two elements of the Treg TCR ligand separately: the self-peptide, and the human MHC II molecule. These analyses revealed that hydrophobicity in the third complementarity determining region (CDR3β) of the TCR promotes reactivity to self-peptides, while TCR variable gene (TRBV gene) usage shapes the TCR’s general propensity for human MHC II-restricted activation.
INTRODUCTION
During T cell development, regulatory T cells (Tregs) acquire their suppressive phenotype when the affinity of their TCR to the peptide-MHC complex (pMHC) is intermediate-to-high. In most cases, randomly rearranged V, D, and J genes produce a TCR with too low an affinity to pMHC, and so most developing T cells do not survive positive selection in the thymus (“death by neglect”). On the other hand, TCRs with too strong of an affinity to pMHC result in T cell apoptosis and negative selection. For the T cells that survive both positive and negative selection, however, a divergence in phenotype emerges: those whose TCRs have lower affinity to pMHC tend to become conventional T cells (Tconvs) and those whose TCRs have higher affinity tend to gain the Treg phenotype1–8. Following thymic selection, a crucial prerequisite for the peripheral induction of Tregs is suprathreshold affinity to pMHC, though other factors such as costimulatory signals exert additional influence7,9.
The body of evidence that regulatory versus conventional T cell phenotypes are largely driven by TCR signal strength suggests that the developmental fate of CD4+ T cells may be influenced by sequence features of the TCR. Indeed, the degree of overlap in TCR sequence between Tregs and Tconvs is minimal compared to T cell samples of the same phenotype10. The distinguishing features of Treg and Tconv TCRs could shed light on the determinants of TCR strength, but the majority of extant work has focused on exact sequence matching rather than generalizable TCR sequence features.
To identify all sequence features that influence TCR strength, we examined 5.7×10⁷ TCRβ chain sequences from 6 published datasets. Using multiple mixed effects logistic regression models, we quantified the effect of each TCR feature on Treg fate, and aggregated these results into a TCR-intrinsic regulatory potential (TiRP) score that can be applied to any TCR. Our work reveals that the TCR sequence consistently informs T cell fate and function across diverse biological contexts, including the fetal thymus and tumor microenvironment.
RESULTS
Study design
We first derived a comprehensive collection of TCR features (Supplementary Table 1) by examining the mutual information structure of the TCR amino acid sequence. We then tested each sequence feature for differential abundance between Tregs and Tconvs in two human cohorts of TCRβ chains from flow-sorted T cells11,12 (Supplementary Table 2). From these results, we developed a Treg-propensity scoring system for the TCR (TiRP) (Figure 1a). Upon confirming its accuracy in two datasets of thymic T cells13,14, we applied TiRP to tumor-infiltrating T cells, and found that clone plasticity (the presence of induced Tregs (iTregs) or exTregs, Figure 1b) corresponded to significantly high TiRP. Finally, to shed light on the etiology of the observed TCR sequence biases, we separately examined the two elements of the Treg TCR ligand: 1) the self-peptide and 2) the human MHC II molecule. For these analyses, we calculated human TiRP for 1) murine Tregs and 2) human memory Tconvs, respectively (Figure 1c). These results demonstrated two separable components of TiRP: CDR3β hydrophobicity promotes reactivity to self-peptides, while the TRBV gene shapes the TCR’s general activatability in the context of human MHC II restriction.
Figure 1. Study design.
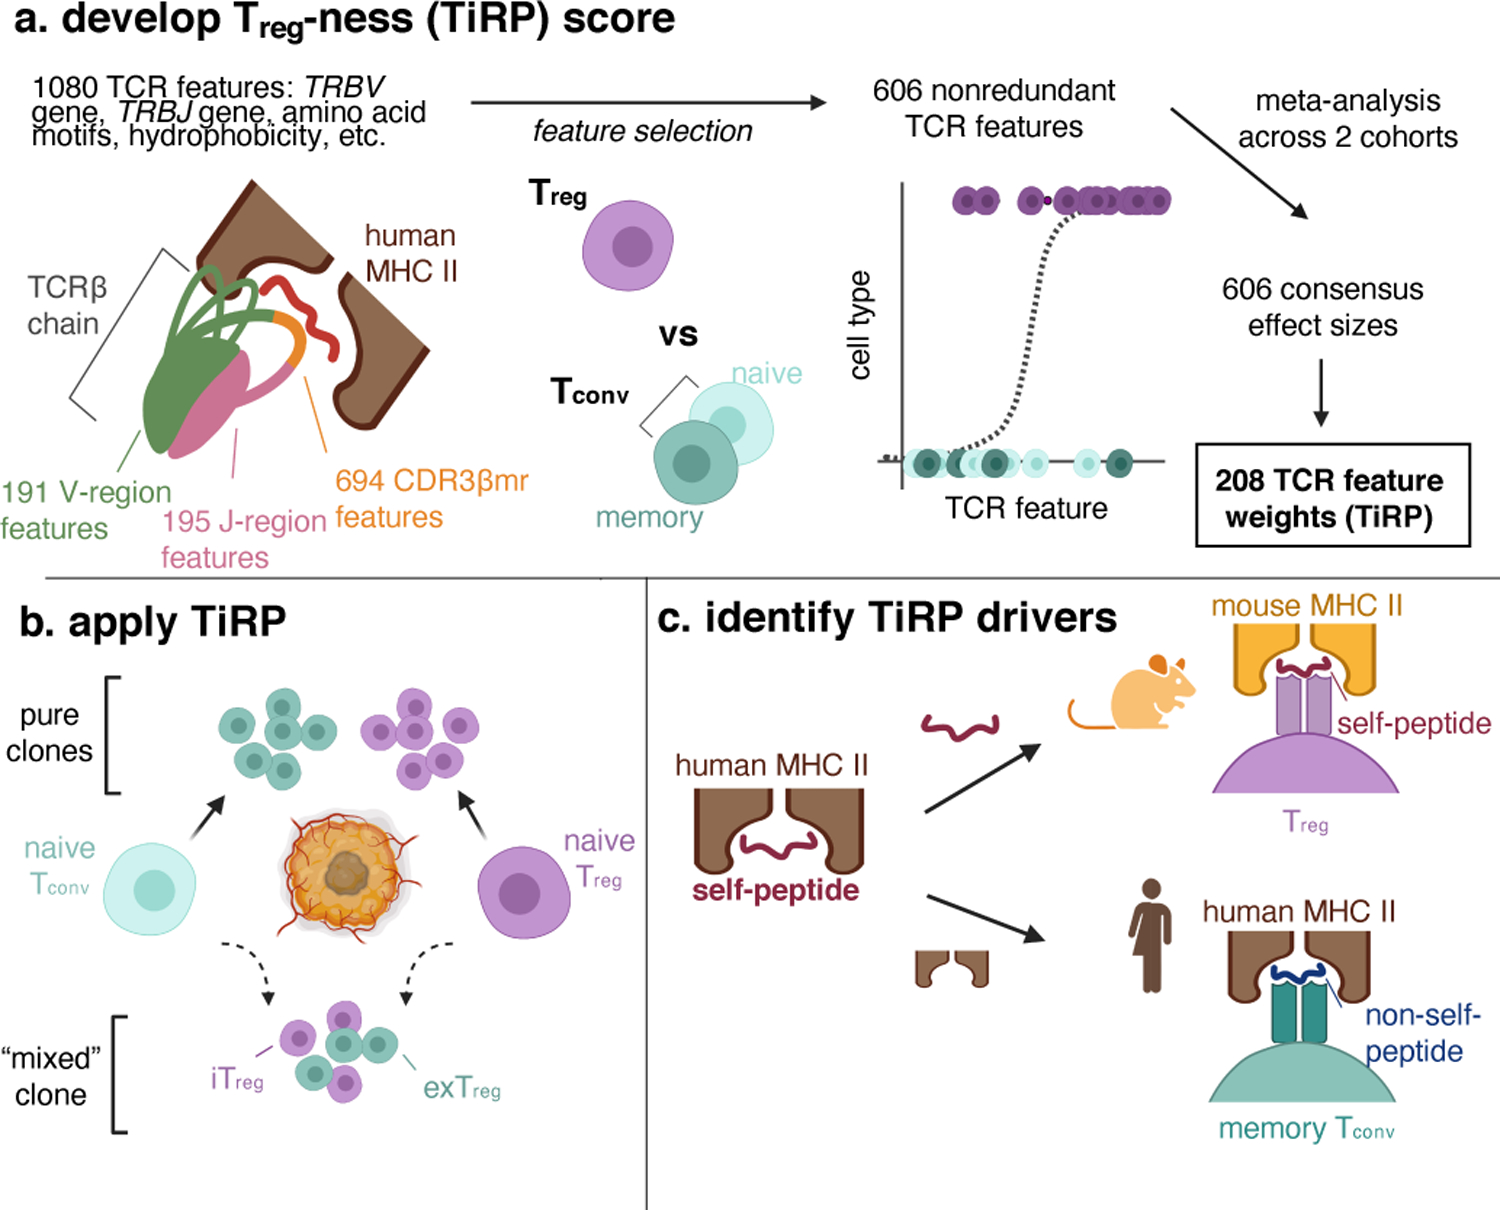
(a) We first examined the structure of the T cell receptor (TCR) sequence to define 1080 sequence features. Depicted is a T cell receptor (TCR) β chain in complex with antigenic peptide (red) and human MHC II molecules (brown). The TCR is colored by region: V-region (including CDR1β and CDR2β loops) in green, CDR3β middle region (CDR3βmr) in orange, and J-region in pink. We used mutual information analysis and mixed effects model comparisons to select 606 nonredundant TCR features that best explained variance in T cell state. We fit mixed effects logistic regression models for 70% of the data in the discovery and replication cohorts separately, and combined the effect sizes for each TCR feature across the two cohorts by meta-analysis. TiRP was calibrated to include only 208 of the 606 TCR features that had Bonferroni-significant meta-analytic P values. (b) We then applied TiRP to the TCRs to tumor-infiltrating CD4+ cells in order to study mixed clones: groups of Tregs and Tconvs with the same TRB and TRA sequences observed in the same individual. These mixed clones likely represent lineages of T cells that have undergone a peripheral conversion between the regulatory and conventional phenotypes. Such clones may include induced or iTregs (Tconv cells that have acquired a regulatory phenotype), exTregs (Treg cells that have lost the regulatory phenotype), or both. (c) Finally, we investigated the drivers of TiRP by separately examining the two elements of the human Treg TCR ligand: the self-peptide and the human MHC II molecule.
Figure created with BioRender.com.
Defining features of the T cell receptor sequence
The TCR is a membrane-anchored heterodimeric protein consisting of an α and a β chain. Each of the two chains includes three highly variable peptide loops that protrude toward the pMHC complex. The most variable of these loops is the CDR3β region in the β chain, which mediates recognition of specific antigens. Because TRBV, TRBD, and TRBJ genes each encode regions of CDR3β, we anticipated that the CDR3β sequence would feature blocks of strongly correlated residues. To determine the boundaries of these correlated regions, we examined the mutual information structure of CDR3β peptides in a previously published cohort of targeted TCR sequencing in multiple tissues and PBMCs11 (“discovery cohort”, Supplementary Table 2). To assess generalizability of any findings, we held out data from six randomly selected donors (Methods).
Mutual information calculations between CDR loop residues revealed three distinct regions of the TCR: the V-region (IMGT position 1–107), CDR3β middle region (CDR3βmr, p108–p112), and J-region (p113–p118) (Figure 2a−b, Extended Data Figure 1a−g). While random nucleotide insertions in the highly variable CDR3βmr obscured the identity of the TRBD gene, the germline-encoded V- and J- regions demonstrated sequence conservation and high inter-residue mutual information (Figure 2a). Mutual information was concentrated at the flanking ends of CDR3β such that eight p104-p106 tripeptides (“Vmotifs”) and 42 p113-p118 pentapeptides (“Jmotifs”) accounted for >90% of observations. Upon observing minimal mutual information between the three regions, we elected to undertake a three-pronged modeling approach, in which we would examine the V-, middle, and J- regions independently.
Figure 2. TCR sequence structure.
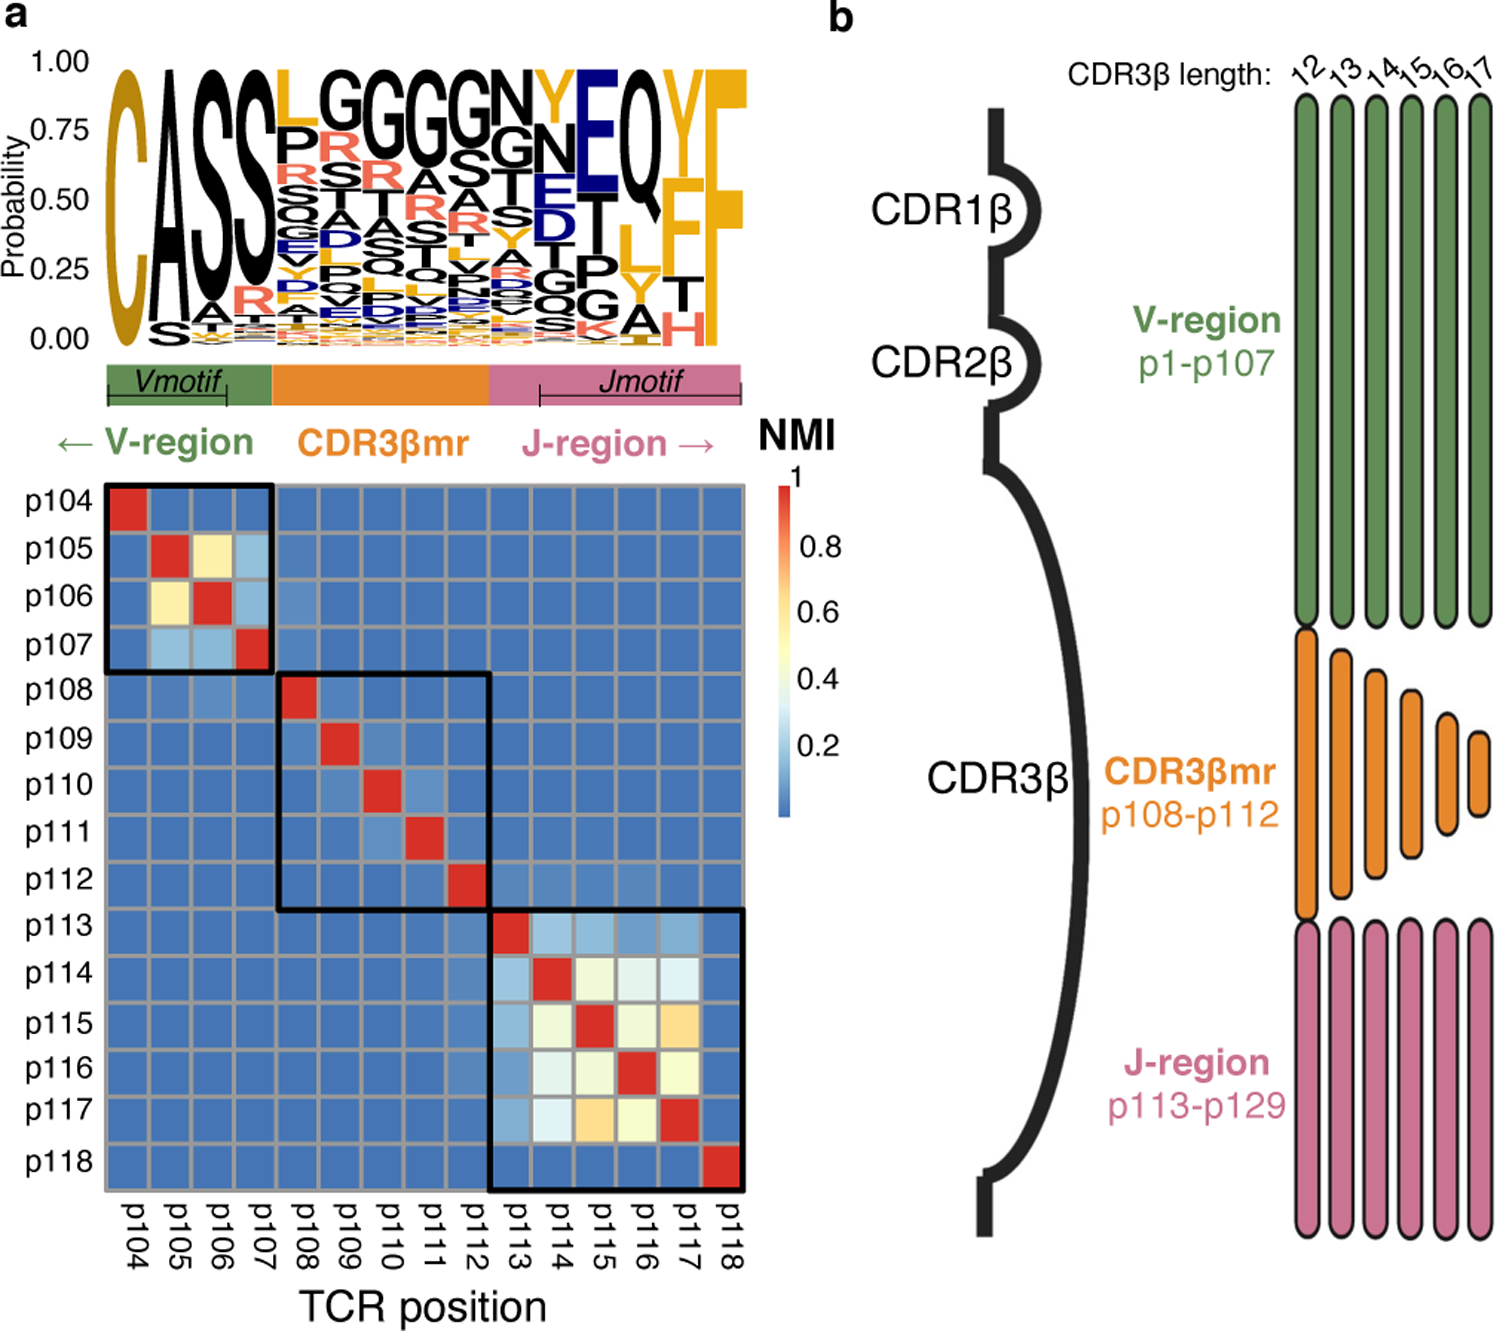
(a) Probability of each amino acid in each CDR3β position depicted by a sequence logo, with a heatmap of normalized mutual information (NMI) between each pair of CDR3β residues for the most frequent CDR3β length, 15 amino acids. Based on this mutual information structure, we partitioned the CDR3β sequence into a Vmotif within a V-region, a CDR3β middle region (CDR3βmr), and a Jmotif within a J-region. (b) Schematic showing TCRs of multiple lengths aligned to the TCR β chain structure. Three complementary-determining regions within the TCR β chain protrude as loops into the pMHC-TCR complex: CDR1β, CDR2β, and CDR3β. CDR1β and CDR2β are encoded by the TRBV gene, while CDR3β spans TRBV-encoded residues, random nucleotide insertions (CDR3βmr) and TRBJ-encoded residues. Random nucleotide insertions from VDJ recombination occur at the V/D and D/J junctions, creating variation in CDR3βmr length. Regions suggested by mutual information structure are not drawn to scale.
NMI: Normalized mutual information
Tregs use specific amino acids in the CDR3β middle region
We first examined the middle region of CDR3β (“CDR3βmr”) of Tregs (CD4+CD127−CD25+) and Tconvs (CD4+CD127+) in the discovery cohort. Calculating the mean percentage of CDR3βmr residues occupied by each amino acid yielded strikingly consistent Treg-Tconv differences across donors: Phenylalanine (F), Leucine (L), Tryptophan (W), and Tyrosine (Y) were consistently enriched in Tregs, while Aspartic acid (D) and Glutamic acid (E) were consistently enriched in Tconvs (Figure 3a). Categorization of amino acids by physicochemical features showed that hydrophobic amino acids were enriched in Tregs, while negatively charged amino acids were enriched in Tconvs (Extended Data Figure 1h).
Figure 3. Broad differences exist between the TCRs of Tregs and Tconvs.
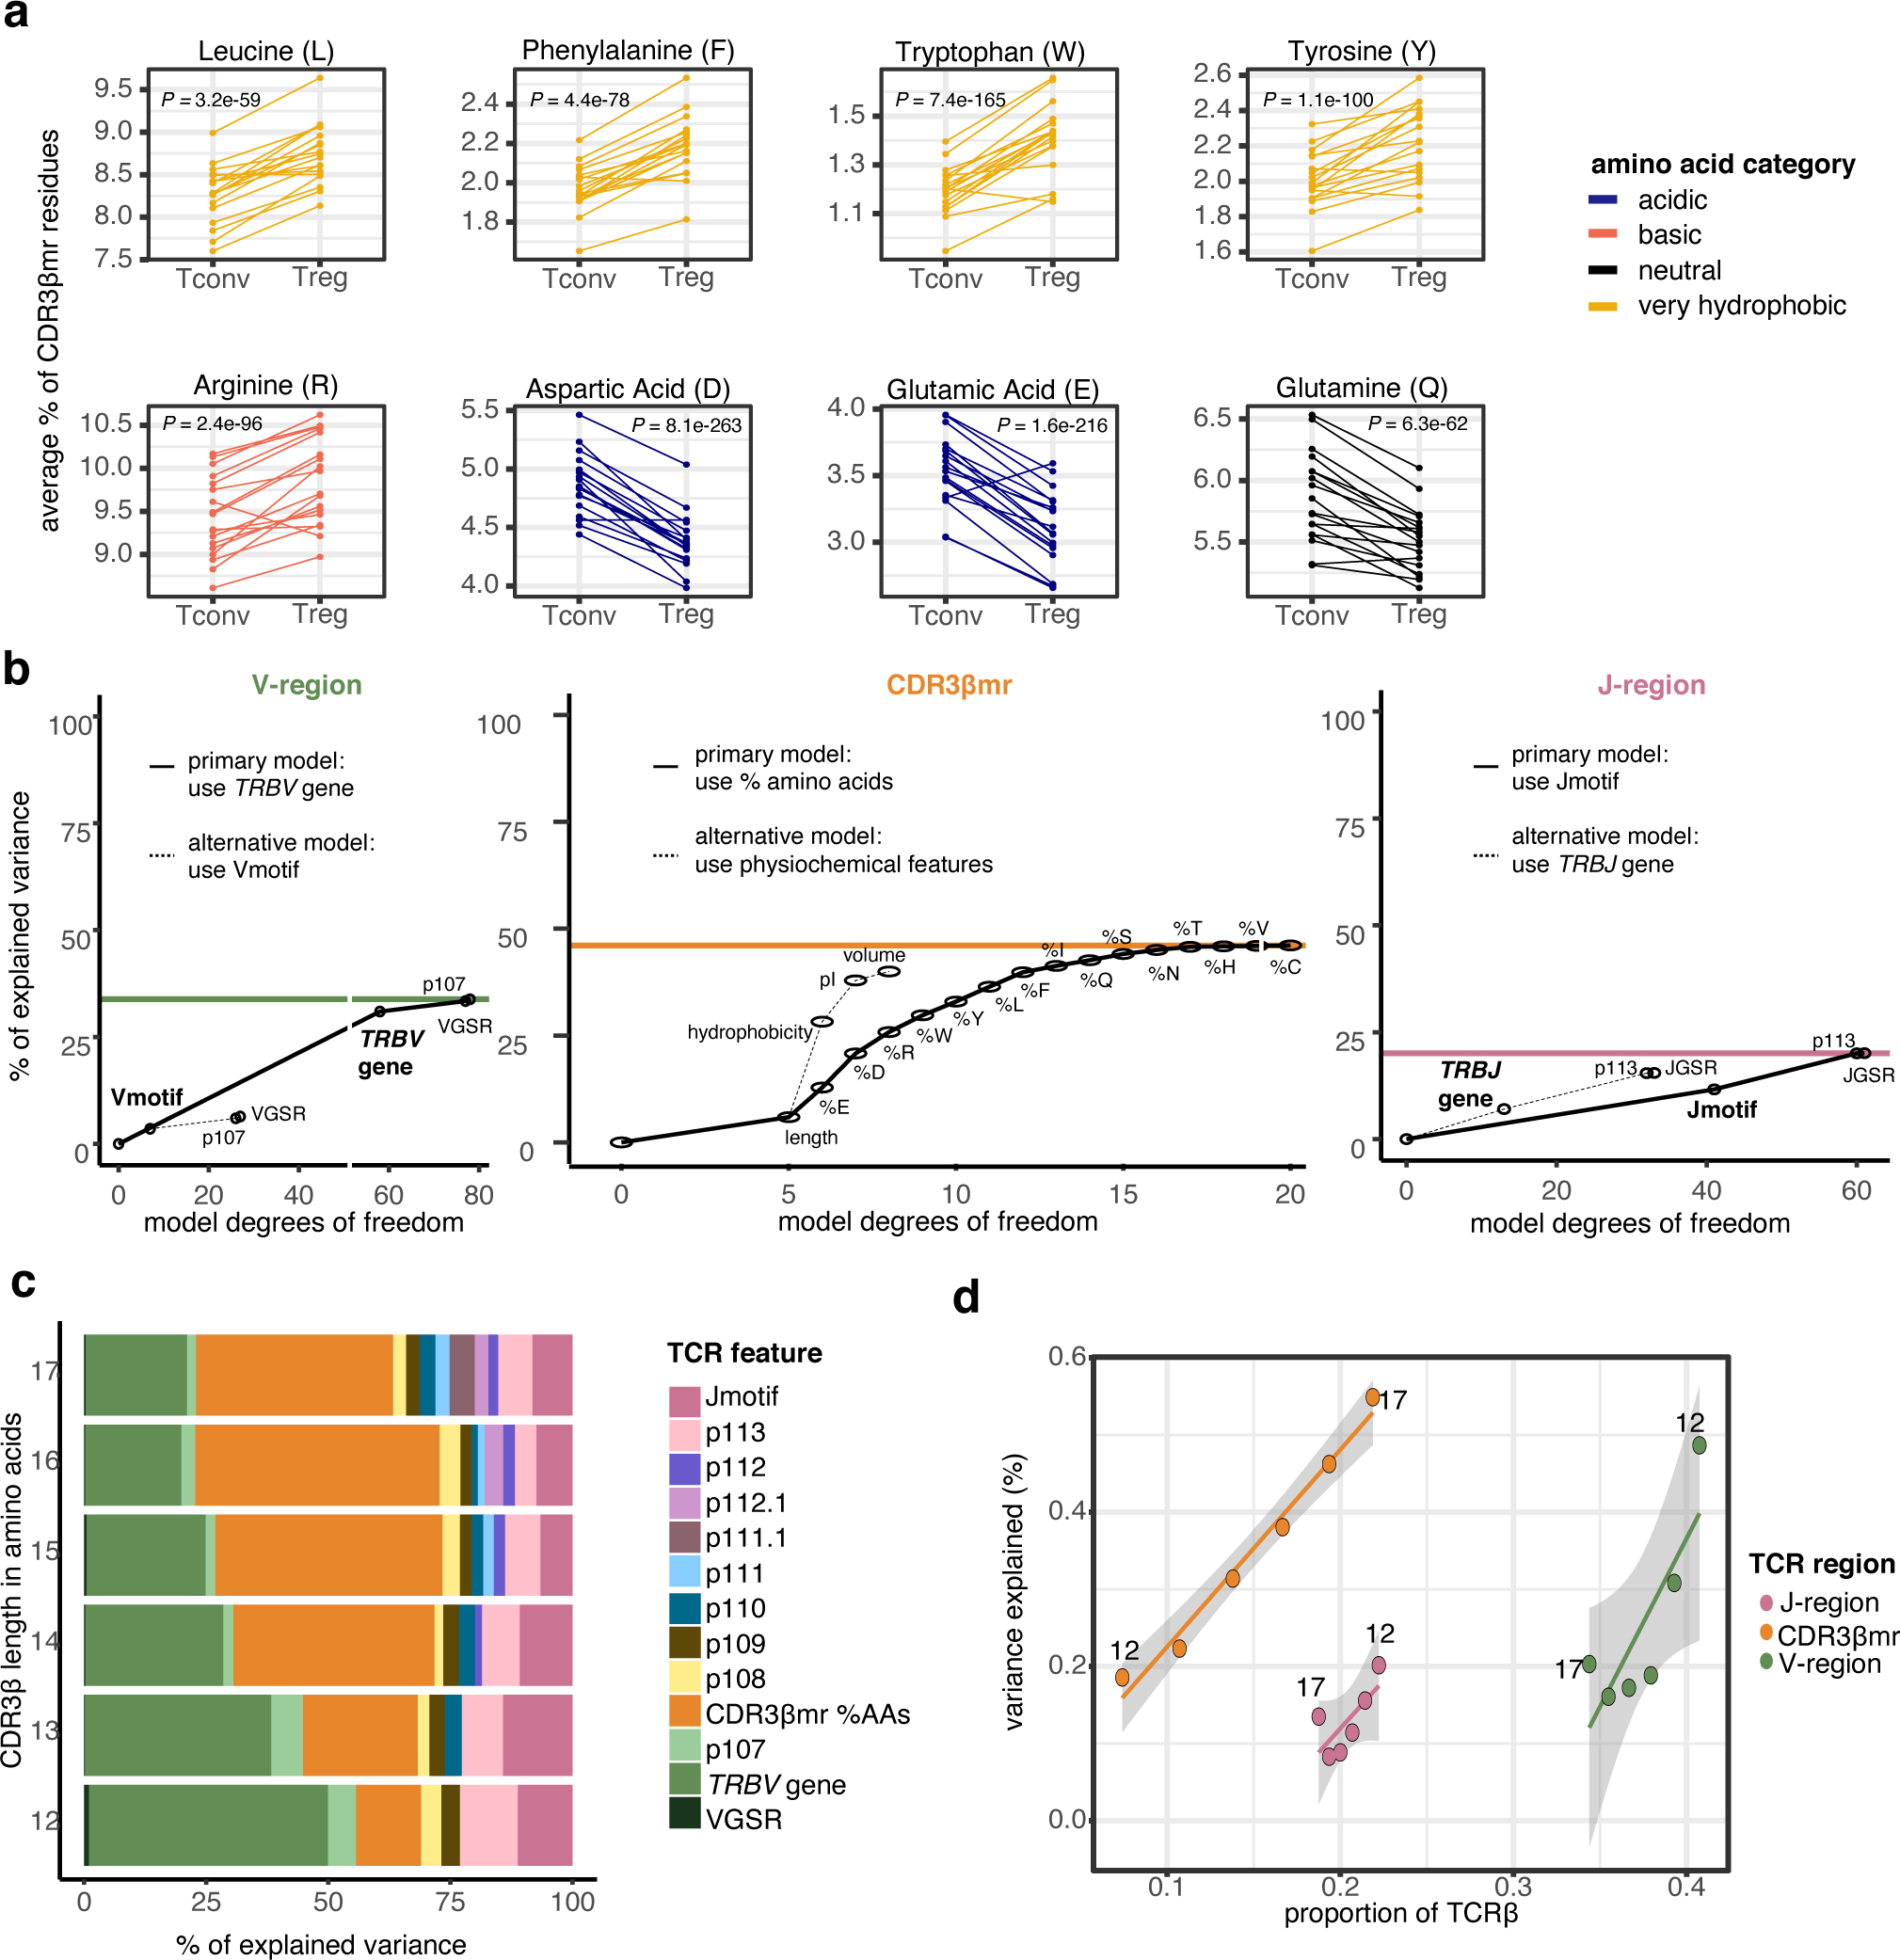
(a) Percentage of select amino acids in the CDR3βmr, plotted as the mean for each donor sample in the discovery cohort, separated by cell type and colored by amino acid groups. P values are computed by a two-sided Wald test on the coefficient for each amino acid term in a mixed effect logistic regression model (Methods). (b) Incremental variance explained by the addition of labeled TCR features to the V-region (left), CDR3βmr (middle), and J-region (right) mixed effect logistic regression models. The addition of each TCR feature increased model complexity by adding one degree of freedom for each quantitative feature and k - 1 degrees of freedom for each qualitative feature, where k is equal to the number of possible values for the qualitative feature (k = 58 for 58 possible TRBV genes; k = 8 for 8 possible Vmotifs). For each region, the primary modeling approach was compared to the alternative modeling approach, and the modeling approach that explained greater variance was selected. Colored horizontal lines depict the total percent of explained variance attributable to each TCR region, summing to 100%. (c) Percent of explained variance by each TCR feature type, summing to 100% for each length of CDR3β. (d) Variance explained by each TCR region for different CDR3β lengths. As CDR3β length increases, CDR3βmr occupies a greater proportion of the TCR (fraction of amino acid residues), at the expense of V and J region proportions. Line of best fit is drawn for each TCR region; 95% confidence interval shaded in gray, with each point is labeled by CDR3β length. X-axis corresponds to the proportion of TCR β chain amino acids derived from the V, J, and middle regions (summing to 100 for each CDR3β length, Methods), while the Y-axis corresponds to the absolute variance explained (scale: 0 −100%).
VGSR = V gene selection rate (Supplementary Note). CDR3βmr %AAs = percent composition of amino acids in the CDR3βmr.. VGSR = V gene selection rate (Supplementary Note). CDR3βmr %AAs = percent composition of amino acids in the CDR3βmr.
To quantify these effects, we used forward selection to build a statistical model that increased in complexity (degrees of freedom) with the addition of each TCR feature. We observed that 15 amino acid features had an independent effect on Treg fate, each affording an incremental gain in variance explained (Figure 3b, middle, Supplementary Table 3). At each step, we used nested conditional mixed effect logistic regression, which accounts for inter-individual differences such as those driven by HLA genotype and tissue source (Methods).
To confirm that these effects were consistent across donors and clinical phenotypes, we estimated them in each of the 18 individuals and in the type 1 diabetes (T1D) and healthy subsets of the discovery cohort separately. We found consistent effect sizes in all contexts (Extended Data Figure 2a−b, Supplementary Table 3, Methods). We compared this model to an alternative approach in which CDR3βmr was scored by physicochemical features (hydrophobicity, isoelectric point (pI), and volume) rather than percentages of individual amino acid residues (Supplementary Table 4, Methods). Physicochemical features did not capture as much information as amino acid percentages (Figure 3b, middle); hence, we proceeded with an amino acid-based model of the CDR3βmr.
We then ran a separate mixed effects model for each CDR3βmr position (IMGT p108 −112), testing whether the amino acid at the given position explained variance in T cell fate beyond that accounted for by the CDR3βmr amino acid percentages (Methods). We found that each position indeed conveyed additional information regarding the likelihood of Treg fate, but these position-specific effects all together did not explain as much variance as the general amino acid composition of the CDR3βmr (Fig. 3c and Supplementary Table 5).
CDR3β V and J regions explain variance in T cell state
We then examined the V-region of the TCR. Previous studies have established that genetic variation in the MHC locus shapes the frequency with which TR(A/B)V genes are used in the repertoire15. MHC polymorphisms explained far more variance in TRAV gene usage compared to TRBV15, consistent with protein structure data demonstrating that TRAV contacts MHC at polymorphic sites while TRBV contacts MHC at conserved sites16. We hypothesized that variation in TRBV-encoded residues may alter TCR affinity to these conserved MHC sites, and thereby influence T cell fate.
To test this hypothesis, we extracted sequence features from the V-region and tested their association with Treg fate using mixed effects logistic regression (Methods). In consideration of multicollinearity, we computed all pairwise correlations between V-region TCR features and avoided joint modeling of TCR features with any | r | > 0.7 (Extended Data Figure 3, Methods). Through model comparisons, we found that a joint model including TRBV gene identity and p107 best represented the region, since the 58 TRBV genes explained far more variance than the eight Vmotifs (Figure 3b left, Methods). To account for inter-individual variation in TRBV gene selection, we included a thymic selection parameter (V gene selection rate, VGSR) for each TRBV gene as a covariate (Supplementary Note, Extended Data Figure 4). Despite adjusting for VGSR, TRBV gene usage continued to explain a significant amount of variance in T cell fate, with three TRBV genes reducing the odds of Treg fate by more than 30% compared to the reference (most common) gene, TRBV05–01 (P = 1.3 × 10−804, LRT, Supplementary Table 6). As in the CDR3βmr analysis, we confirmed that these associations replicated in models isolated to each individual and to both case and control cohort subsets (Extended Data Figure 2c−d, Supplementary Table 6). The consistency in TRBV gene effects across individuals suggests that their influence on Treg fate indeed occurs through interactions with conserved MHC residues, and is largely independent of MHC variability between individuals.
We then examined the J-region with the same approach. In contrast to the V-region, wherein strong p104-p106 sequence conservation constrained multiple TRBV genes to the same Vmotif, variable nucleotide editing at the D/J junction resulted in multiple Jmotifs associated with each TRBJ gene. The 42 Jmotifs explained slightly more variance than the 13 TRBJ genes (Figure 3b, right), and so we proceeded with a joint model containing the Jmotif and p113 residue. Across six CDR3β lengths, the most important TCR features for T cell fate determination were the TRBV gene identity and the percent composition of amino acids in the CDR3βmr (Figure 3c). Each TCR region played an important role, with the greatest variance explained per residue in the CDR3βmr. Relative gains in variance explained were proportional to fractional occupancy of the TCR, which was dependent on CDR3β length (Figure 3d, Methods). To compare these results to a null model, we conducted 1000 permutations of the cell type labels, and confirmed that the observed amount of variance explained far exceeded the distribution in the null model (Supplementary Table 7, Methods). To assess whether these results were mediated by invariant TCRs such as those of invariant Natural Killer T (iNKT) cells, we excluded putative iNKT cell receptors from the data and observed minimal changes in TCR feature effect sizes (Supplementary Table 8, Methods). Thus, our reported effects are statistically well-calibrated and robust to niche or invariant TCRs.
Tregs are enriched for CDR1β charge and CDR3β hydrophobicity
We next aimed to localize physicochemical effects underlying CDR3βmr residue enrichments to specific sequence positions. At each CDR(1–3)β loop amino acid position, we estimated the effect of hydrophobicity, isoelectric point (pI), and volume on Treg fate using a ridge regression model (Supplementary Table 9, Methods). Intriguingly, these results provided a physicochemical basis for some of the TRBV gene differences observed. Tregs were enriched for positively charged amino acids at p37 of CDR1β (Figure 4a). Seven TRBV genes assessed in our models harbor a negatively charged residue at p37; all seven of these were significantly depleted for Tregs compared to the reference gene TRBV05–01, which has a positively charged Arginine (R) at p37 (Figure 4b). As expected from our earlier findings, CDR3βmr featured positive coefficients for hydrophobicity in every position (Figure 4a). At each position, a standard deviation increase in hydrophobicity led to a 2.5% (L17, p113) – 6.3% (L12, p113) increase in odds of Treg fate (OR = 1.025, 95% CI = 1.011–1.039, Wald test P = 2.7 × 10⁻⁴ for L17-p113; OR = 1.063, 95% CI = 1.051–1.074; Wald test P = 5.2 × 10⁻²⁸ for L12-p113, Extended Data Figure 5, Supplementary Table 9). Though highly consistent across samples, this effect is subtle: average CDR3βmr hydrophobicity is 0.08 standard deviations higher in Tregs compared to Tconvs (Figure 4c, OR = 1.08, 95% CI = 1.076–1.083, Wald test P = 2.3 × 10−523). Sensitivity analyses revealed that p37 charge and CDR3βmr hydrophobicity effects were relatively robust to the weight of the ridge penalty term (Supplementary Table 10). Interestingly, statistical interactions between physiochemical values at different TCR residues were largely insignificant except for a few relating to bulky adjacent amino acids (Methods, Supplementary Table 11).
Figure 4. Tregs exhibit position-specific TCR sequence features.
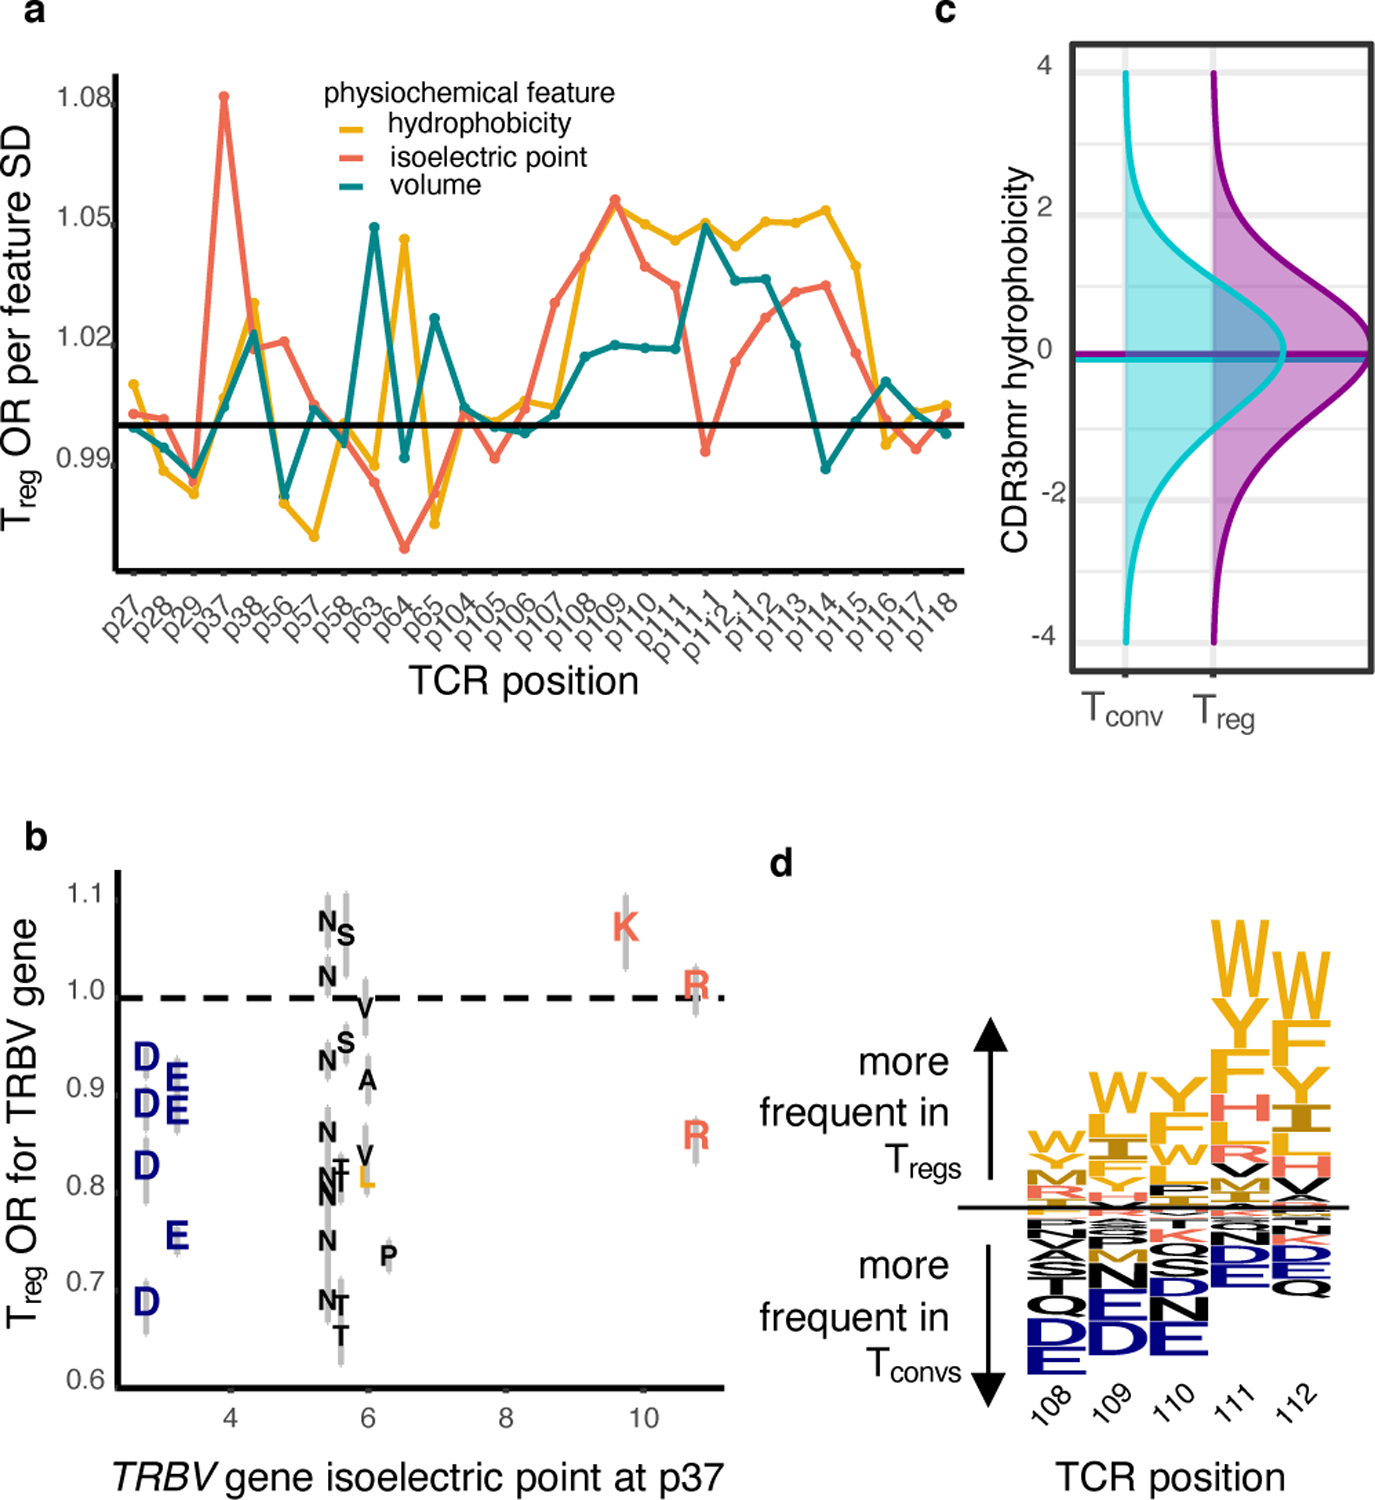
(a) Estimated odds ratio (per standard deviation) for each physicochemical feature at each CDRβ(1–3) loop position; features with an estimate > 1 are positively associated with Treg fate while features with an estimate < 1 are negatively associated. Odds ratios denote the change in Treg odds per standard deviation increase in the given physicochemical feature at the given TCR position. Within each CDR3β length, all effects were estimated jointly in an L2-regularized logistic regression with a penalty weight tuned via 10-fold cross-validation (Methods). Shown are the odds ratio estimates for each position-feature averaged across the six CDR3β lengths. Vertical lines denote the boundaries of each CDRβ loop. (b) Correspondence between TRBV gene isoelectric point at p37 (apex of CDR1β) and TRBV gene odds ratio for Treg fate compared to the reference gene, TRBV05–01. Each TRBV gene is labeled with its amino acid residue at p37 and the 95% confidence interval for its odds ratio. (c) Distribution of CDR3βmr hydrophobicity in Tconvs compared to Tregs in the discovery dataset. Hydrophobicity values are averaged over the CDR3βmr for each TCR, and then scaled to have mean 0 and variance 1. Horizontal lines depict mean for each population (Treg mean CDR3βmr hydrophobicity = 0.05, Tconv mean hydrophobicity = −0.03, Wald test P value = 2.3 × 10−523). (d) Sequence logo depicting the effects of amino acids in the highly entropic CDR3βmr residues, sized proportionally to the associated change in Treg odds, with amino acids more frequent in Tregs above the horizontal line and amino acids more frequent in Tconvs below.
To directly visualize the amino acids associated with Treg fate, we generated a sequence logo representation of the CDR3βmr based on differential amino acid usage at each position (Figure 4d, Methods). Our results are consistent with previous findings suggesting that hydrophobicity at p109 and p110 promotes the development of T cells that recognize self-antigens17. Importantly, we show that this principle extends beyond p109–110 throughout the stretch of CDR3βmr residues. Thus, randomly recombined TCR amino acids play a parsimonious role in T cell fate acquisition: increasing hydrophobicity raises affinity to self-pMHC and thereby promotes Treg development.
Reproducing TCR associations in an independent data set
Having identified TCR features associated with Treg identity, we next sought to validate them in a public dataset of TCRβ sequences from sorted Treg (CD4+CD25highCD127low) and Tconv (CD4+CD25lowCD27+) cells sampled from the peripheral blood of 16 donors12 (“replication cohort”, Supplementary Table 2). Despite a different distribution of tissue sources in this data set, the CDR3βmr amino acid percentage effects were nearly identical (Pearson R = 0.95, P = 4.6 × 10⁻⁸, Figure 5a, Supplementary Table 3). Effects for individual TRBV genes, Jmotifs, and position-specific amino acid effects were also consistent with discovery (Pearson R = 0.56, P = 7.5 × 10−57, Figure 5b, Supplementary Tables 5−6, Methods). In the replication cohort, TRB sequences were collected by reverse transcription and amplification of RNA rather than direct DNA sequencing. Thus, relative changes in Treg likelihood induced by these TCR sequence features are not only robust to different tissue sources, but also to technical differences in sorting and sequencing protocols.
Figure 5. Treg TCR sequence biases replicate in independent cohorts.
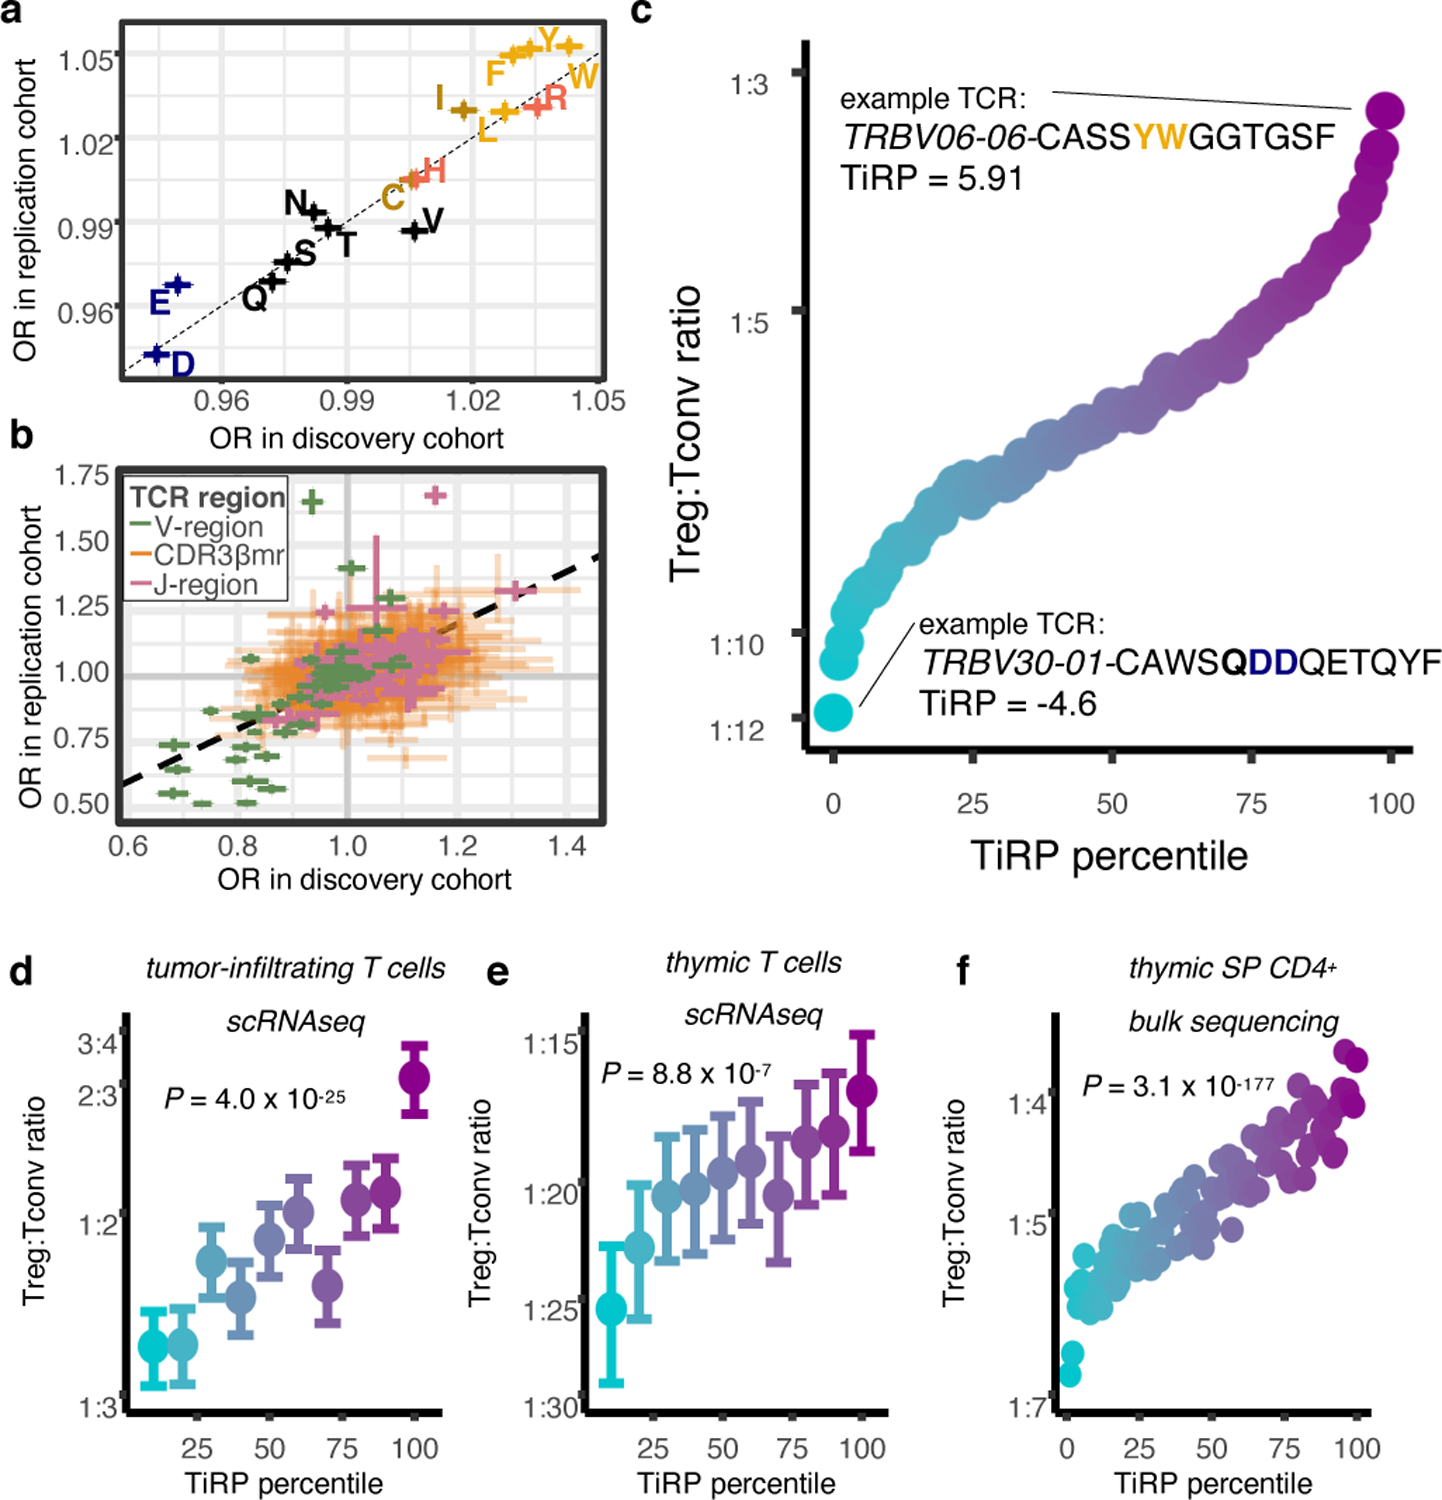
(a) Correspondence between the discovery and replication cohort odds ratios for CDR3βmr compositional amino acids (AAs); OR corresponds to the change in Treg odds associated with one standard deviation (SD) increase in CDR3βmr percentage for a given AA. Colors for amino acids correspond to Extended Data Figure 1h. (b) Comparison in (a) for all other TCR sequence features; OR corresponds to the change in Treg odds associated with the presence of the given feature compared to the reference feature (Supplementary Table 1). For (a)-(b), R = Pearson’s correlation coefficient and P values are computed by a two-sided t-test with Fischer transformation. (c) Validation of the TCR-intrinsic regulatory potential (TiRP) score in held-out donors of the discovery and replication datasets (n = 3,277,036 TCRs). Each SD increase in TiRP was associated with a 23% increase in the odds of Treg status (OR: 1.231, 95% CI: 1.227 – 1.235, likelihood ratio test (LRT) P = 2.4 × 10−3248). Percentile points are colored by Treg:Tconv ratio ranging from blue (lowest) to purple (highest). (d) Validation of TiRP in scRNAseq of CD4+ tumor microenvironment T cells18,19 (n = 27,721 cells). Each unit increase in TiRP (corresponding to one SD for the scores in 5c) was associated with a 16% increase in the odds of Treg status (OR: 1.16, 95% CI: 1.13–1.19, LRT P = 4.0 × 10⁻²⁵). (e) Validation of TiRP in human thymic T cells13 (n = 60,424 cells). Among developing thymocytes, each unit increase in TiRP was associated with a 9% increase in the odds of Treg fate (OR: 1.09, 95% CI: 1.05 – 1.13, LRT P = 8.8 × 10⁻⁷). For (d) and (e), error bars outline 95% confidence intervals for Treg/Tconv odds in each TiRP score decile, computed by bootstrap resampling (Methods). (f) Validation of TiRP in TCR-targeted gDNA sequencing from grafted human thymi of humanized mice14 (n = 466,551 TCRs). Each unit increase in TiRP was associated with a 12% increase in the odds of Treg status (OR: 1.12, 95% CI: 1.11–1.12, LRT P = 3.1 × 10−177).
Developing TiRP: a Treg propensity score for the TCR
Having replicated the effect of a comprehensive set of TCR features in two independent cohorts, we next developed a method to quantify the TCR-intrinsic regulatory potential (“TiRP”) of a T cell. Briefly, for a given TCR, TiRP is the sum of Treg association effect sizes of independent sequence features in all three TCR regions (Methods). We used meta-analytic effect size estimates across the two cohorts and included only features with a significant effect on T cell fate based on a Bonferroni P value threshold (Methods). As a result, TiRP is the weighted sum of 25 TRBV genes, 23 Jmotifs, 4 CDR3β lengths, 14 CDR3βmr amino acid percentages, and 142 positional amino acids (Supplementary Table 12).
We then tested our TiRP score on the four discovery cohort donors and two replication cohort donors whose repertoire data had been withheld from all former analyses. We observed that a one standard deviation increase in TiRP in these held-out data resulted in a 23% increase in the odds of Treg status (OR: 1.231, 95% CI: 1.227 – 1.235, LRT P = 2.4 × 10−3248, Figure 5c, Supplementary Table 13, Methods). TCRs in the highest-scoring decile were more than twice as likely as TCRs in the lowest-scoring decile to belong to a Treg: 1 in every 3.9 compared to 1 in every 9.1. To ensure that this TCR-T cell state covariation was contingent on the biology of surface-expressed TCRs, we repeated this analysis on the nonproductive TCRs in the four held-out donors for which out-of-frame reads were available (Methods). This indeed abrogated the association between Treg-ness score and Treg fate (OR: 1.00, 95% CI: 0.97 – 1.04, LRT P =0.96).
To externally validate our scoring system, we calculated TiRP in four published datasets13,14,18,19 (Supplementary Table 2). We scored each TCR and assessed whether the TiRP explained variance in T cell phenotype, as defined by standard mRNA clustering for the three scRNAseq cohorts (Methods, Extended Data Figure 6, Extended Data Figure 7a−b), and by CD25 and CD127 flow-sorting14. Consistent with our previous observations, there was a nearly two-fold increase in Treg likelihood in the top TiRP decile compared to the bottom TiRP decile in all cohorts (Figure 5d−f), including the tumor microenvironment (Figure 5d, OR: 1.16 per unit increase in TiRP, 95% CI: 1.13–1.19, LRT P = 4.0 × 10⁻²⁵, Supplementary Table 13). TiRP elevation in thymic Tregs13 confirmed the direct relevance of TiRP to the thymus (Figure 5e, OR: 1.09, 95% CI: 1.05 – 1.13, LRT P = 8.8 × 10⁻⁷). Similar results in TCRs from flow-sorted SP CD4+ thymic T cells14 (Figure 5f, OR: 1.12, 95% CI: 1.11–1.12, P = 3.1 × 10−177, LRT) pinpointed the stage of thymic development in which TiRP promotes Treg fate. Importantly, these SP CD4+ thymocytes include T cells observed prior to negative selection. Because the Treg population represents a terminal differentiation state in the thymus, young T cells that will negatively selected are more likely to be observed in the precursor non-regulatory population. Thus, the blunting in TiRP effect size that we observe in thymic data is consistent with high TiRP of T cells that are negatively selected for their affinity to self-peptide-MHC. Evidently, our TCR scoring system describes Treg TCR features in diverse biological contexts, including thymic selection.
TiRP explains Treg plasticity in the tumor microenvironment
We next asked whether TiRP could help to explain regulatory T cell plasticity. It is well-recognized that naive Tconv thymic emigrants can be peripherally induced to adopt a regulatory phenotype20,21. Conversely, some Tregs have been observed to lose FOXP3 expression and adopt a pro-inflammatory phenotype22–25 (“exTregs”, Figure 1b). Expanded T cell clones (possessing the same TCR) observed as both Tregs and Tconvs within the same donor (hereafter referred to as “mixed clones”) may represent lineages of T cells that have undergone such peripheral conversions. We hypothesized that the TiRP of these T cells may be intermediate, rendering them most susceptible to peripheral conversion.
Before testing our hypothesis, we used Symphony26 to standardize cell type definitions across the two cohorts by mapping cells of expanded clones from both datasets (12,067 cells) into a common reference atlas27 of T cell states based on joint transcriptional and proteomic profiling (Figure 6a−c, Supplementary Table 2, Extended Data Figure 7c−d, Extended Data Figure 8a−d, Methods). On average, 19.2% of expanded clones from the same donor were observed in both the Treg and Tconv state, including a few large clones with a relatively even balance (Figure 6d−e, Supplementary Table 14).
Figure 6. TiRP helps to explain clonal plasticity in the tumor microenvironment.
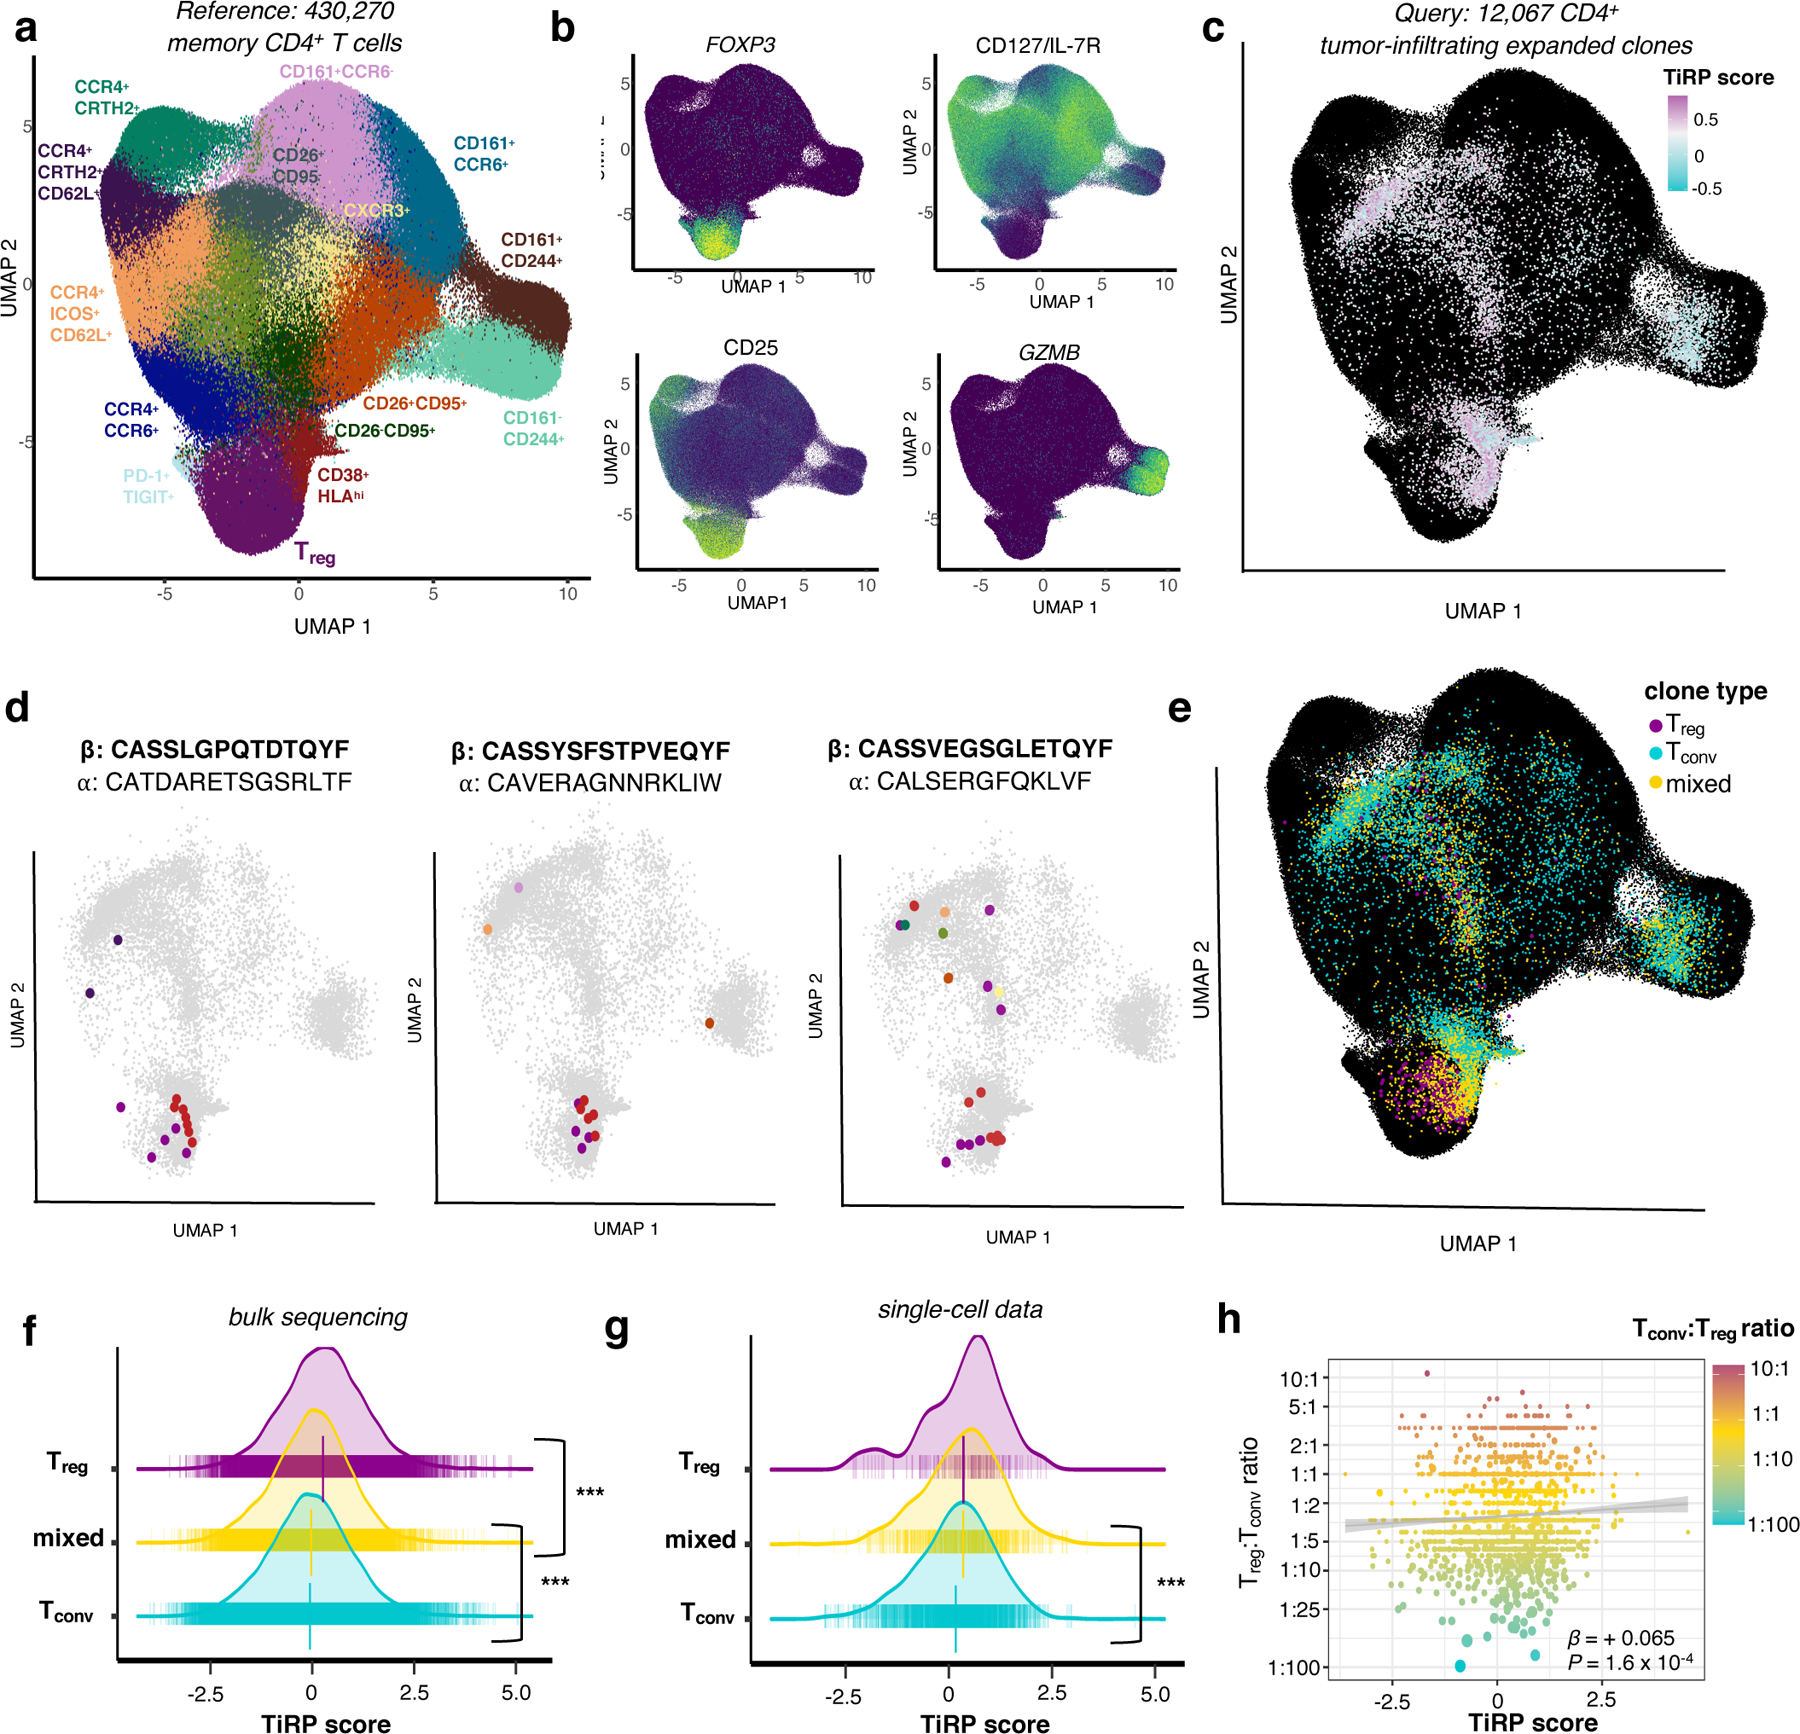
(a) Reference T cell dataset, colored by cell type clusters according to transcriptional and surface marker variation depicted in Extended Data Figure 7c−d. (b) Select gene expression (FOXP3, GZMB) and surface marker abundance (CD25, CD127) for cells in the reference T cell dataset (low = purple, high = light green). (c) Tumor microenvironment T cells of expanded clones mapped into the reference embedding by Symphony. Each cell is colored by the TiRP score of its paired TRB chain, with KNN smoothing for visualization (Methods). TiRP is scaled such that 0 corresponds to the mean score and one unit corresponds to one standard deviation of held-out bulk sequencing TCRs (Figure 5c). (d) Cell members of three example mixed clones are highlighted in color according to their cell type classification by Symphony (colors as in (a)). Within a given plot, each cell expresses the same CDR3β DNA sequence, the same CDR3α amino acid sequence, and was observed within the same donor (CDR3β amino acid sequence listed above CDR3⍺ amino acid sequence for each). (e) Same as (c), with each cell colored according to clone type: purple for clones containing only Treg cells, blue for clones containing only Tconv cells, and yellow for clones containing both Treg and Tconv cells (“mixed” clones). (f) TiRP scores of Tconv, Treg, and ”mixed” expanded clones from held-out bulk sequencing data. P = 2.0 × 10−40 for mixed-Tconv difference, P = 9.1 × 10⁻¹⁶ for mixed-Treg difference. (g) Scores as in (f) for tumor-infiltrating scRNAseq data. P = 3.0 × 10⁻⁴ for mixed-Tconv difference, P = 0.55 for mixed-Treg difference. For (f) and (g), vertical bars denote mean and standard error of the mean per clone type. (h) Correspondence between TiRP score and the Treg:Tconv ratio for each clone. Best fit line is shown in gray; clones are colored by Treg:Tconv ratio and sized proportionally number of constituent cells. β corresponds to the slope of the regression line between the log-transform of the Treg:Tconv ratio and TiRP score. For (f)-(h), P values are computed by the LRT between mixed effect logistic regression models (Methods).
We next tested whether the TiRP score of mixed clones was in between that of purely Tconv and Treg clones (Methods). In the previously held-out bulk sequencing data, the TiRP scores of mixed clones were significantly greater than those of expanded Tconv clones and less than those of expanded Treg clones (Figure 6f, mixed-Tconv difference = 0.03, P = 2.0 × 10−40; mixed-Treg difference = −0.29, P = 9.1 × 10⁻¹⁶, LRT, Methods). These single cell data confirmed that Tregs of mixed clones indeed exhibited greater FOXP3 expression than Tconvs within the same clonal expansion (Extended Data Figure 8e, Methods). As in the previously held-out bulk sequencing data, mixed clones in single cell data had intermediate TiRP scores which were significantly greater than the scores of expanded, pure Tconv clones (Figure 6g, mixed-Tconv mean TiRP difference = 0.182, P = 3.0 × 10⁻⁴, LRT, Methods). With the limited extent of Treg expansion, we were underpowered to detect significant differences between mixed and Treg clones in these data (mixed-Treg mean TiRP difference = −0.005, P = 0.57, LRT). When we quantified clone phenotypes by the proportion of Tregs and Tconvs within each clone, increasing TiRP corresponded to more Treg-skewed clonal expansions (LRT P = 0.003, Figure 6h, Methods). To our knowledge, TiRP is the first metric to identify TCR-intrinsic, rather than TCR-extrinsic factors relevant to peripheral phenotypic conversion.
Separable drivers of TiRP: self-peptide and human MHC
We next asked whether TiRP captured the major sources of TCR sequence variation between sorted T cell samples from diverse individuals. For this, we conducted a principal components analysis (PCA) of TCR feature frequencies in the sorted samples of the replication dataset, in which all T cell states of interest were available (Methods). We observed that the major axes of TCR sequence variation corresponded to T cell state, rather than donor HLA genotype or clinical phenotype (Figure 7a, Extended Data Figure 9a−b). While our previous supervised modeling was designed to focus on Treg-Tconv differences, this approach recovered the importance of T cell state in an unsupervised manner.
Figure 7. Two axes of TCR-driven cell states.
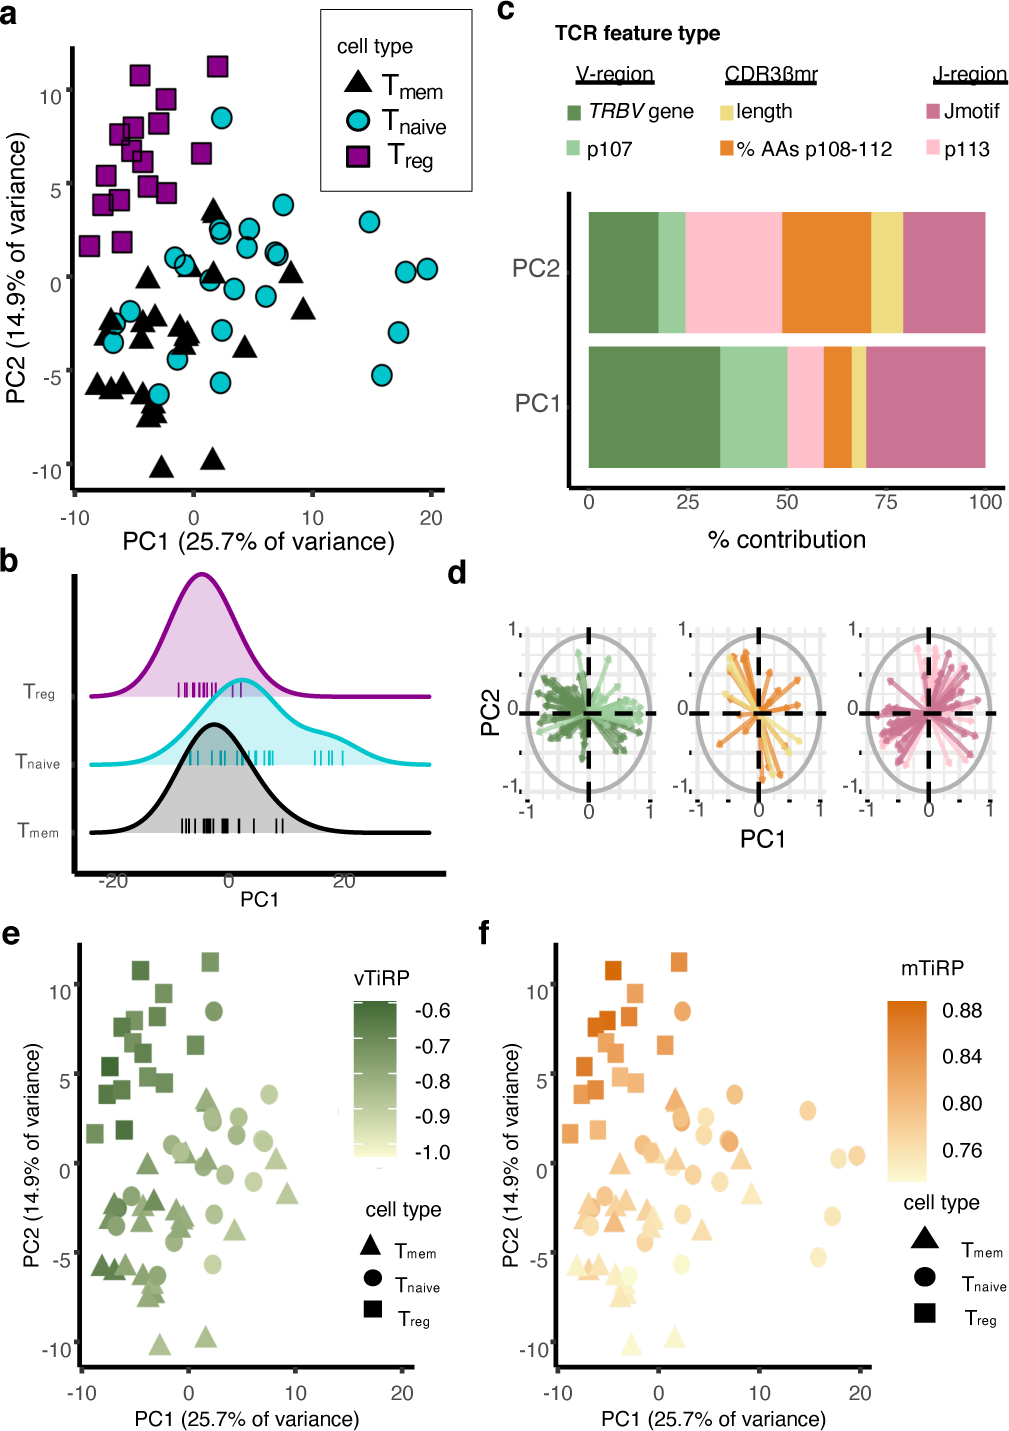
(a) 67 samples from the replication cohort colored by cell type and arranged by principal component space according to variation in TCR sequence feature frequencies (Methods). (b) Distribution of PC1 embeddings for each cell type; each vertical line corresponds to one sample. Naive Tconvs have the highest PC1 embedding in 15 of the 16 donors with all three cell types available. P value is computed by the binomial test with n = 16 and k = 15. (c) Percent contribution of each type of TCR sequence feature to the first two principal components. (d) Loadings of each of the TCR sequence features on PC1 and PC2, depicted by arrows, separated by TCR region and colored by the same scheme as in (c). (e) Samples arranged in PC space as in (a), colored by mean TiRP in the V-region of the TCR (vTiRP). (f) Same as in (e), colored by mean TiRP in the CDR3βmr (mTiRP). P values for (e)-(f) are calculated by a two-sided t-test with Fischer transformation on Pearson’s R.
jTiRP = TiRP (Treg-intrinsic regulatory potential) of the J-region of the TCR (IMGT positions 113–118)
mTiRP = TiRP (Treg-intrinsic regulatory potential) of the middle region of the TCR (IMGT positions 108–112)
vTiRP = TiRP (Treg-intrinsic regulatory potential) of the V-region of the TCR (IMGT positions 1–107)
PCA delineated two axes of TCR-driven cell states: antigen-experienced (Treg and memory Tconv) versus naive (PC1), and regulatory versus conventional (PC2) (Figure 7a−b). The axis dividing antigen-experienced from inexperienced samples (PC1) was most reliant on TRBV gene frequencies, while the axis dividing regulatory versus conventional samples (PC2) was most reliant on mean percent composition of amino acids in CDR3βmr and the CDR3βmr-adjacent residue p113 (Figure 7c−d). Since TiRP is a weighted sum of TCR features from the V-, J- and middle regions, the score can be divided into three score components corresponding to these three regions. TiRP scoring by TCR region revealed that V-region-specific TiRP (vTiRP) and CDR3βmr-specific TiRP (mTiRP) indeed captured PC1 and PC2, respectively (Figure 7e−f, vTiRP – PC1 R = −0.86, P = 1.5 × 10⁻²⁰, mTiRP – PC2 R = 0.85, P = 2.6 × 10⁻²⁰).
We next investigated possible biological drivers for vTiRP and mTiRP. The biological structure of the pMHC-TCR complex suggests that different regions of the TCR may promote Treg fate via particular affinities: MHC II mostly contacts the V-region of the TCR, while the self-peptide is in closest contact with CDR3βmr16,28,29 (Figure 1a). Thus, we hypothesized that vTiRP enhanced affinity to human MHC II, while mTiRP facilitated recognition of self antigens. To test this idea, we examined TiRP in two complementary datasets: 1) murine Treg TCRs30, which recognize self antigens but are not human MHC restricted, and 2) human memory Tconv TCRs12,31, which are human MHC restricted but do not recognize self antigens (Figure 8a, Supplementary Table 2).
Figure 8. Isolating the drivers of TiRP.
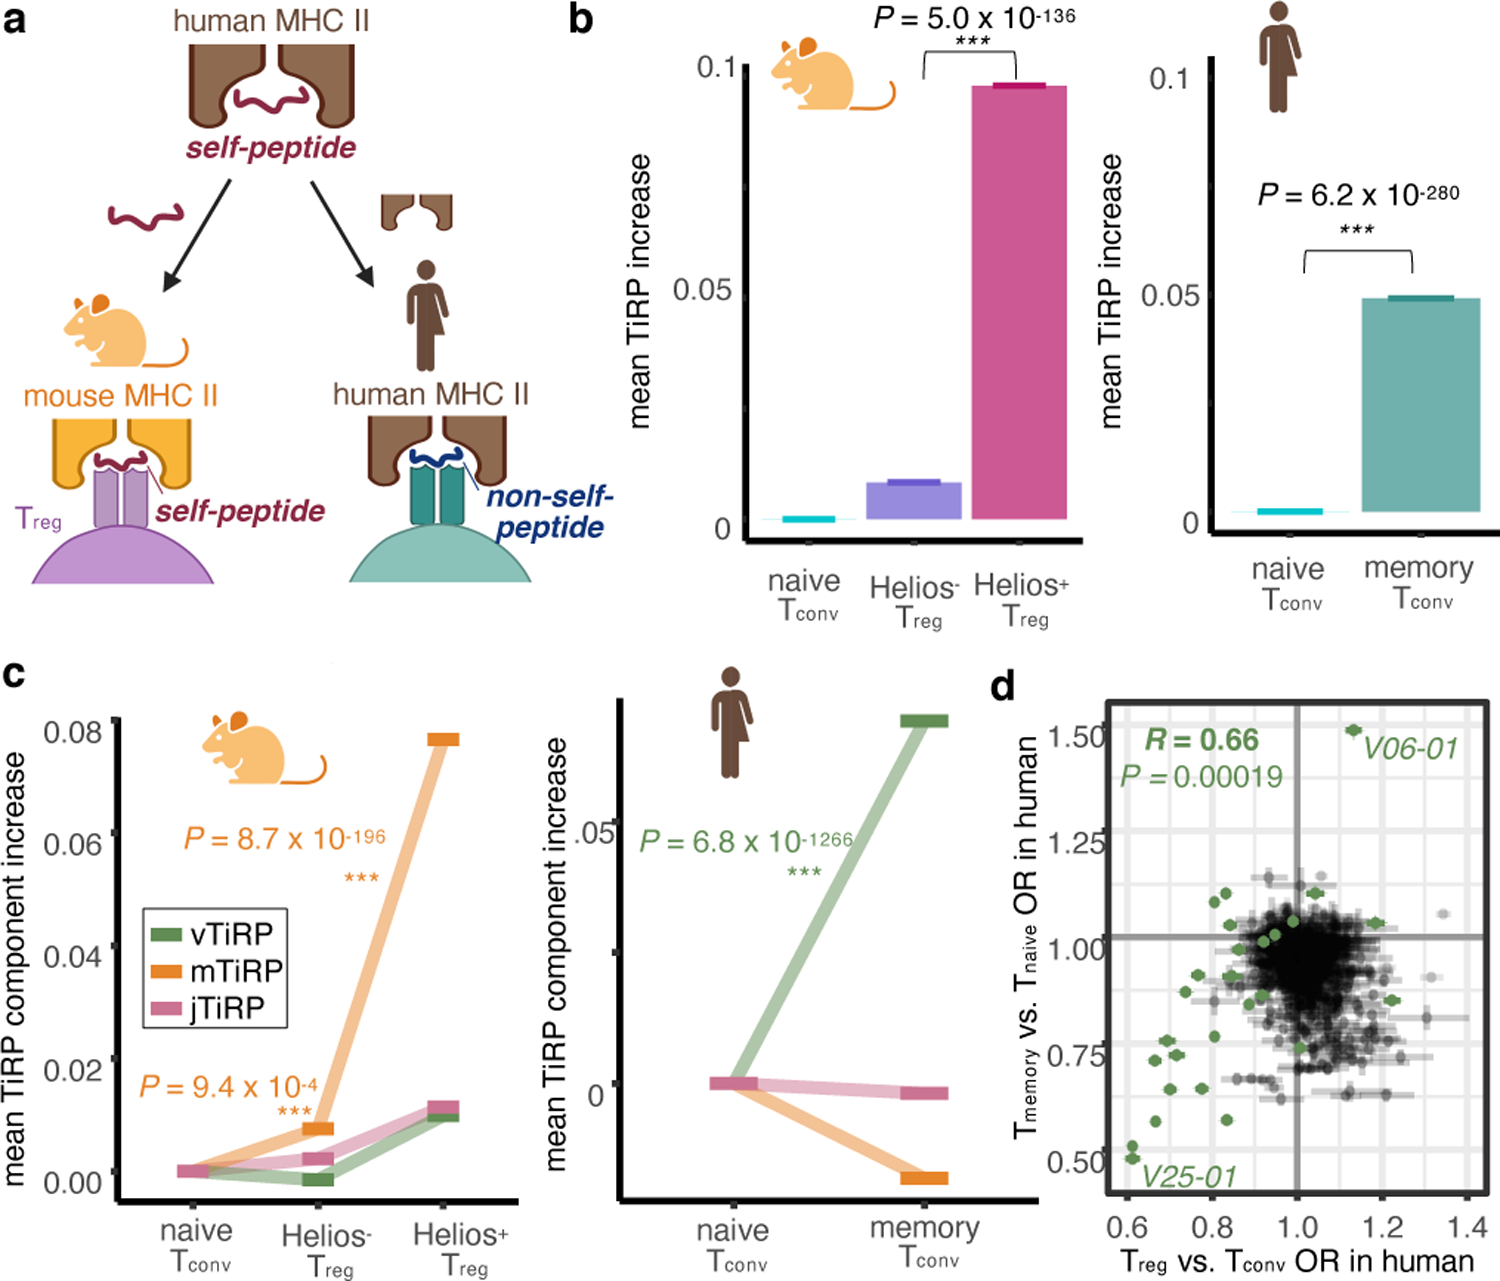
(a) We investigated the drivers of TiRP by separately examining the two elements of the human Treg TCR ligand: the self-peptide and the human MHC II molecule. To do so, we scored 1) murine Treg TCRs, which share an affinity to mammalian self-peptides but not to human MHC II molecules, and 2) human memory Tconv TCRs, which share an affinity to human MHC II molecules but not to self-peptides. (b) Left: mean increase in TiRP score of Helios-sorted Tregs compared to naive Tconvs in Helios-GFP Foxp3-RFP reporter mice. Right: mean increase in TiRP score of memory Tconvs compared to naive Tconvs from held-out donors of the replication dataset. (c) Left: TiRP score increases in Helios-sorted murine Tregs broken down into TiRP score components by TCR region. Right: TiRP score increase in human memory Tconvs broken down into TiRP score components by TCR region. (d) Correspondence between TCR feature odds ratios for Treg-Tconv odds (x-axis, meta-analytic odds between discovery and replication cohort), and memory-naïve odds (y axis, replication cohort only) with their 95% confidence intervals. TRBV genes are highlighted in green; V06–01 indicates TRBV06–1; V25–01 indicates TRBV25–01. Pearson’s R is calculated with respect to TRBV gene odds ratios only. P values in (b)-(c) are calculated by the LRT between mixed effects models (Methods); P value in (d) is calculated by a two-sided t-test with Fischer transformation on Pearson’s R.
jTiRP = TiRP (Treg-intrinsic regulatory potential) of the J-region of the TCR (IMGT positions 113–118)
mTiRP = TiRP (Treg-intrinsic regulatory potential) of the middle region of the TCR (IMGT positions 105–112)
vTiRP = TiRP (Treg-intrinsic regulatory potential) of the V-region of the TCR (IMGT positions 1–104)
Figure created with BioRender.com.
To apply TiRP to murine data, we first translated murine TRBV genes to their human homologs (Methods). We observed that human TiRP was significantly elevated in murine Tregs compared to Tconvs (Figure 8b, left; P = 5.0 × 10−136 for Helios+ Tregs, P =0.003 for Helios− Tregs, LRT, Methods). Thus, TiRP facilitates recognition of self, even in the context of an entirely different species’ MHC restriction. A parsimonious explanation for this finding, among several, is that TiRP enhances affinity to self-peptides. Consistent with this explanation, TiRP is significantly elevated in the 361 CD4+ autoreactive TCRs currently documented in McPAS-TCR32 and VDJdb33 (Extended Data Figure 10 P = 1.5 × 10⁻⁹, Wald test). Across 11 studies, these 361 autoreactive TCRs were identified by their reactivity to tetramers or antigen-presenting cells (APCs) presenting peptides known to be targeted in four autoimmune diseases (Type 1 Diabetes, Celiac Disease, Multiple Sclerosis, and Inflammatory Bowel Disease).
TiRP was dramatically elevated in murine Tregs that expressed Helios, a marker of thymic Treg fate acquisition (Figure 8b, left). Consistent with our TCR region hypothesis, the TiRP component with the greatest increase between murine Tconvs and Tregs was mTiRP (Figure 8c, left). CDR3βmr amino acid percentage effect sizes replicated strongly between murine and human data (Extended Data Figure 9c, Pearson’s R = 0.85, P = 0.00013) while other TCR features did not (Extended Data Figure 9d, Supplementary Table 15, Methods). These results strongly suggest that CDR3βmr features such as hydrophobicity promote Treg fate via enhanced recognition of self. Interestingly, mTiRP also accounted for the increased TiRP of mixed clones of the human tumor microenvironment (Extended Data Figure 9e, P = 2.9 × 10⁻⁴, Wald test). Taken together, these results suggest self-peptide recognition by exTregs in the tumor microenvironment, and underline the role of interactions between CDR3βmr and the antigenic peptide in Treg fate acquisition.
To understand the role of human MHC, we next compared TiRP in naive and memory Tconv TCRs12, which do not strongly recognize self-peptides6 (Figure 8a, Supplementary Table 2, Methods). TiRP was significantly elevated in human memory Tconvs compared to human naive Tconvs (Figure 8b, right), indicating that affinity to human MHC II also contributes to TiRP. Consistent with the hypothesis of V-region-based affinity to human MHC II molecules, vTiRP was the only TiRP component to increase in human memory Tconvs (Figure 8c, right). As expected, large-effect size TCR features between memory Tconvs and naive Tconvs were predominantly TRBV genes (Figure 8d, Extended Data Figure 9f), and the extent of each gene’s enrichment in memory Tconvs correlated with the extent of its enrichment in Tregs (Figure 8d, Pearson’s R = 0.702, P = 4.5 × 10⁻⁵ for TRBV genes). These effects further replicated in an entirely independent cohort of sorted memory and naive T cells from 5 healthy donors31 (Supplementary Table 2, Extended Data Figure 9g, Supplementary Table 16). Thus, as structural interactions in the pMHC-TCR complex would suggest, V-region features modulate affinity to MHC, thereby shaping the T cell’s general disposition for activation.
DISCUSSION
Because the TCR sequence arises from a random process prior to T cell fate determination, associations between the TCR and T cell fate indicate causal effects of the TCR. The majority of Treg research to date has focused on TCR-extrinsic determinants of T cell fate, such as the effect of costimulatory receptors, antigenic peptides, and cytokines34. Though each of these elements certainly play an essential role in T cell fate, the contribution of the TCR sequence itself has not yet been comprehensively investigated. TCR-intrinsic factors are relevant to nearly all immunological contexts, including the engineering of TCRs for immune therapies.
In this work, we leveraged the affinity-based partition of the repertoire into Tregs and Tconvs to uncover determinants of TCR avidity toward the self-peptide MHC II complex. We identified TCR sequence features that are predictive of Treg cell fate across seven independent cohorts, encompassing diverse genetic, clinical and tissue contexts as well as sequencing protocols. Donor TCR samples were excluded due to incomplete cell sorting in only two of these seven cohorts. Using mixed effects logistic regression, we developed a scoring system that captures the TCR-intrinsic regulatory potential (TiRP) of a given TCR. We validated this scoring system in three external datasets, including TCRs from the human thymus. We observed that TiRP largely reflects centrally-derived Treg TCRs, but is also moderately elevated in peripherally-derived Tregs. Excitingly, TiRP helped to explain the variable tendency of T cell clones to exhibit a regulatory phenotype in the tumor microenvironment. The application of TiRP scoring to murine data demonstrated that these TCR differences persist even with limited pathogen exposure. As evidenced by these diverse contexts, TiRP quantifies the extent to which a T cell is fated to be a Treg, purely due to its TCR.
It is important to recognize several limitations to our approach. First, the amount variance in T cell state explained by the TCR is significant but modest considering the full diversity of the repertoire. For any given TCR, specific antigenic contacts and costimulatory signals are likely the major determinants of T cell phenotype. Our results show, however, that TCR features such as hydrophobicity consistently predispose the T cell to adopt a regulatory phenotype. Second, our analyses focused on the β chain of the TCR. The β chain is more variable than the ⍺ chain and is largely considered to mediate antigen specificity. However, the ⍺ chain may also play a role in determining T cell phenotype, which remains to be explored. Lastly, though we found preliminary evidence that TiRP is elevated in CD4+ autoreactive TCRs, the current data represent only four of many diseases that have been described as autoimmune. This finding will need to be reassessed as efforts progress to identify a comprehensive set of autoreactive TCRs for these diseases and for others.
The broadest takeaway from our work is the hydrophobic bias of Treg TCRs, present at each of the peptide contact residues of CDR3β. This observation extends previous work17,35 regarding p109 and p110 of Treg TCRs, and demonstrates that the hydrophobic bias is in fact specific to these positions. As a group, hydrophobic amino acids are among the strongest-interacting36. The concept that the strength of amino acid interactions may influence the thymic fate of a TCR was first predicted by Kosmrlj et al37. In this computational model of thymic selection, TCRs with “weakly interacting amino acids” (QNSTAG) best evaded negative selection. Antigen specificity then followed: for TCRs with only weak amino acid interactions, any change in peptide sequence abrogates TCR recognition. If the Treg population is thought of as “partially” negatively selected—that is, precisely the TCRs for which pMHC recognition in the thymus is higher than average, but not to a fatal extent— their TCRs should be enriched in strongly-interacting amino acids (IVYWREL). Our analyses confirm this enrichment in Tregs, and suggest that the phenomena also applies to fully negatively selected TCRs. If strongly-interacting residues make TCR recognition relatively robust to changes in peptide sequence, antigen specificity may be reduced in Tregs compared to Tconvs. Perhaps, such degenerate “stickiness” allows the Treg to generalize from the self-peptide encountered in the thymus to a larger pool of protected self-antigens.
Importantly, however, CDR3βmr hydrophobicity is not the full picture. TRBV gene usage explained nearly as much variance in T cell fate, and TRBV gene effects were not related to hydrophobicity. Our work suggested instead that the isoelectric point of the CDR1β p37 encoded by the TRBV gene shapes affinity to conserved sites of MHC II16. While the Treg-promoting effect of hydrophobic CDR3βmr amino acids did not translate to the development of memory Tconvs, memory Tconvs and Tregs exhibited strikingly similar TRBV gene biases compared to the naive repertoire. These results suggest that hydrophobic residues in the CDR3βmr may only be “sticky” toward self-peptides, while Treg-promoting TRBV genes enhance affinity to MHC II and thereby predispose CD4+ T cells to recognize both self and non-self.
These phenomena offer a new lens on the T cell immune response: though each TCR tends to recognize a specific cognate antigen, all TCRs are subject to common processes that shape T cell activation. Due to these common processes, not all TCRs are created equal—those with a higher baseline for general reactivity may require a less “perfect” cognate antigen for activation. Existing tools provide rough annotations for “TCR strength,” but these are based on frequently interacting residues in general protein structures37. TiRP sharpens our understanding of high affinity amino acids in the context of the pMHC-TCR complex, providing a crucial functional annotation for the T cell receptor.
Methods
Bulk sequencing data
We downloaded the discovery cohort11, replication cohort12, the murine cohort30 and memory cohort31 sequencing data from the Adaptive Biotechnologies immuneACCESS site (URLs). We downloaded the thymic bulk sequencing cohort14 from GitHub (URLs). For all data, we defined CDR3 amino acid sequences with stop codons or frameshifts to be non-productive amino acid sequences. We restricted all analyses to CDR3 sequences of a length within 12 and 17 amino acids, representing 91.8% of observations in the discovery cohort. We aligned CDR3 amino acids to positions defined by IMGT (URLs), wherein sequences less than 15 amino acids have mid-region gaps and sequences longer than 15 amino acids have extra mid-region positions. We examined only one copy of each CDR3β sequence within each individual. Unless explicitly noted, we excluded CDR3β reads that were observed in both the Treg and Tconv sample of any individual (0.63% of observations in the discovery cohort and 1.9% of observations in the replication cohort). For the discovery cohort, we restricted our analysis to the 24 donors with both Treg and Tconv TCRs available. For the replication cohort, we restricted our analysis to the 16 donors with both Treg and Tconv TCRs available.
Single cell sequencing data
We downloaded scRNAseq tumor microenvironment data18,19 from the GEO through accession numbers GSE114727, GSE114724, and GSE123814. For the scRNAseq thymic data, we downloaded fastqs from ArrayExpress under accession number E-MTAB-8581 and metadata from Zenodo (DOI: 10.5281/zenodo.3711134). For quality control, we included only cells for which 1) more than 1000 genes were expressed 2) less than 25% of detected UMIs were of mitochondrial origin and 3) exactly one productive TCR beta chain was detected. We followed the quality control process of the original authors for the multimodal memory T cell dataset27, which is available for download from the GEO through accession number GSE158769.
STATISTICAL ANALYSES
All mixed effects models were fit with R package lme4. All model comparisons were computed with R package stats. All significance tests on Pearson’s r were t-tests with the Fischer transformation. All analyses were done with R version >=3.6.1.
Holding out observations for calibration and testing
To leverage both the discovery11 and replication12 cohorts in the development of TiRP, we used approximately 70% of the TCR clones from each cohort for training, 10% for calibration, and 20% for testing. To preserve the novelty of held-out data, we kept all TCR clone observations from the same individual together in this process, holding out entire repertoire samples. In the discovery cohort, we held out two individuals for TiRP calibration (donor IDs = 6279, 6196, accounting for 8.4% of TCR clones in the discovery cohort) and four individuals (donor IDs = 6161, 6193, 6207, 6287, accounting for 20.3% of clones in the discovery cohort) for TiRP testing. In the replication cohort, we held out one individual for TiRP calibration (T1D3) and three individuals (HD1, HD2, T1D6) for validation. TCR sequence feature effect sizes were estimated in a separate mixed effects model for each cohort for each independent region of the TCR.
Mutual information structure of the CDR3β sequence
We first calculated the conditional mutual information (MI) for all possible trios of CDR3β positions: the normalized MI of positions A and B given position C. For all trios, we normalized conditional MI by diving by the mean conditional entropy of positions A and B given position C, such that the normalized MI was ultimately equivalent to “symmetric uncertainty”38 or the harmonic mean of the uncertainty coefficients. We used R package “infotheo” to compute all conditional mutual information and conditional entropy values.
We then calculated the Shannon entropy39 of each CDR3β position and the mutual information40 between all pairs of CDR3β positions with the R package DescTools. Again, to normalize mutual information, we divided mutual information for a given pair of positions by the mean entropy of those two positions.
Selection of random effects and model comparisons
In the discovery cohort11, T cells were sampled from four tissues: peripheral blood (PBMC), spleen, pancreatic lymph node (pLN), and inguinal/irrelevant lymph node (iLN). We reasoned that there were three sensible ways to model tissue as a source of variation in T cell state:
(1) as a fixed effect:
where p is the probability that the CD4+ sorted CDR3β sequence belongs to a Treg, β0 is an intercept, X1 is an indicator variable set to 1 if the sequence is from a PBMC sample, X2 is an indicator variable for spleen origin, X3 is an indicator variable for iLN origin (pLN as reference), and b0i is a modification to the intercept fit to each individual i, normally and independently distributed (NID) with mean 0 and variance σ02.
(2) as a random intercept effect independent from the random intercept effect per individual, wherein matched tissues across donors have the same (zero-centered) intercept effect:
where b1j is a modification to the intercept fit to each tissue j, NID with mean 0 and variance σ12, and all other variables maintain previous definitions
and/or (3) as a nested random intercept effect, wherein each tissue-donor pair is modeled as a unique batch of correlated observations within the individual-level and tissue-level variances:
where b2i,j is a modification to the intercept fit to each individual i - tissue j pair, NID with mean 0 and variance σ22, and all other variables maintain previous definitions. For stable numerical results, we included the marginal random effects for donor and tissue in this nested random intercept model.
To determine which of these models was most appropriate, we calculated the pseudo R2 by the conventional McFadden41 approach (range 0–1), and multiplied the result by 100 (variance explained range: 0 −100). All measures of variance explained in this study were computed with this approach. For this analysis, we compared models 1–3 to a baseline model that fit the log odds of Treg status only to a random intercept for each individual:
These model comparisons revealed that tissue explained 1.90% of variance as a fixed effect and 1.15% of variance as a random effect (P = 1.15 × 10−11211 fixed and P = 4.68 × 10−10229 random, LRT). On the other hand, tissue as a random effect nested within individual explained 6.27% of variance (P = 1.32 × 10−55291, LRT). We therefore concluded that nesting a random tissue effect within the donor random effect was the most appropriate model for the batch structure of these data, and proceeded with three random intercepts for each mixed effects model: the nested donor-tissue effect, the marginal donor effect, and the marginal tissue effect.
CDR3βmr mixed effects logistic regression
For each amino acid, we calculated the percentage of CDR3βmr positions occupied by this residue; a percentage of 0 means that the residue is missing for a given TCR, while a percentage of 100 means that the residue is present at every CDR3βmr position. We scaled this percentage to have a mean of 0 and variance of 1, and tested the scaled percentage in a separate mixed effects logistic regression for each amino acid with random intercepts as described above. We controlled for CDR3β sequence length by including it as a categorical covariate, reasoning that conformational differences in the HLA-TCR complex may not scale linearly with additional residues. To collect the relevant amino acid proportions, we did a forward search where we iteratively added to the mixed effects model the amino acid proportion that provided the greatest improvement in model fit. On the first round, the percentage of CDR3βmr positions occupied by Glutamic acid (E) in each TCR explained the most variance, with a 9.7% fall in odds of Treg fate per additional Glu residue for CDR3βs of length 15 (pseudo R2 = 0.036%, likelihood ratio test (LRT) P = 8.37 × 10−196, OR = 0.954, 95% CI = 0.951 – 0.957). Conditioning on this feature revealed that the next amino acid with the greatest independent effect was Aspartic acid (D) (pseudo R2 = 0.042%, LRT P = 1.01 × 10−225, OR = 0.95, 95% CI = 0.947 – 0.953). We repeated this process until the remaining amino acid percentages no longer passed the Bonferroni-corrected significance threshold (P = 0.05/20 for 20 amino acids) (Figure 3b, middle). We confirmed that this threshold kept the type I error rate below 0.05 by repeating this analysis 1000 times, with Tconv and Treg labels for each TCR randomly shuffled within the data for each donor on each run.
Position-specific mixed effects logistic regressions
To parse the TRBV-encoded region, we asked if the 5’ flanking CDR3β residues could be represented by a handful of motifs. Indeed, the 8 p104-p106 sequences (“Vmotifs”) present in each donor with frequency > 0.001 in every donor accounted for 96.2% of TCRs. We labeled the remaining 3.8% of TCRs with a Vmotif of “other.”
To avoid multicollinearity in our selection of covariates, we calculated all correlation coefficients for each pair of TCR features in the discovery dataset. This computation for TRBV gene and Vmotif, for example, yields 57 non-reference TRBV genes x 7 non-reference Vmotifs = 399 correlation coefficients. Visualized in Extended Data Figure 3a−c is the correlation coefficient with the maximum absolute value for each TCR feature pair. All pairs of features derived from the V-region exhibited | r | > 0.7, except for pairings with p107 (Extended Data 3b).
P107 featured moderate correlation coefficients with other V-region features, suggesting two viable models for comparison: 1) joint modeling of the TRBV gene identity with the p107 amino acid, and 2) joint modeling of Vmotif with p107. By comparing the pseudo-R2 of these two models (Figure 3b, left), we concluded that the V-region was best modeled by joint estimation of TRBV gene and p107 residue effect sizes. To account for donor-individualized TRBV gene thymic selection, we included VGSR as a fixed covariate in this final model (Supplementary Note).
Similarly, to parse the TRBJ-encoded region, we asked if the 3’ flanking CDR3β residues could be represented by a handful of motifs. Indeed, the 42 p114-p118 sequences (“Jmotifs”) present in each donor with frequency > 0.001 in every donor accounted for 91.5% of TCRs. Computation of all pairwise correlation coefficients for TCR features in the J-region (Extended Data Figure 3c) suggested two possible non-multicollinear models: 1) joint modeling of the TRBJ gene identity with the p113 amino acid, and 2) joint modeling of Jmotif with p113. In contrast to the V-region, here it appeared that the motif afforded a greater pseudo-R2 than the gene (Figure 3b, right), and so we proceeded with joint estimation of Jmotif and p113 for the J-region.
To confirm the absence of multicollinearity in these models, we computed the inflations in variance for coefficient estimates (VIF), and found that avoiding pairs with any | r | > 0.7 successfully corrected variance inflation (Extended Data Figure 3d−e). To make the variance inflation comparable across multiple degrees of freedom, we used the generalized variance inflation factor42 , computed with R package “car.”
To protect against numerically unstable estimates, we report only the effect sizes of TCR features with a frequency greater than 0.005 in the training data for both the discovery and replication cohorts.
Calculating TCR proportions
To approximate the proportion of the TCR occupied by each TCR region in Figure 3d, we divided the number of amino acids in a given TCR region by the estimated total number of TCR β chain amino acids protruding into the MHC-TCR complex (Figure 2b). To estimate the total number of amino acids protruding into the MHC-TCR complex, we added 11 to the observed CDR3β length because over 70% of TCR clones in the discovery training data express a TRBV gene with exactly 11 amino acids in the CDR1β and CDR2β loops. Thus, we estimated the absolute size of the V-region to be 15 amino acids (11 + 4 CDR3β amino acids), the size of the J-region to be 6 amino acids, and the size of the CDR3βmr to vary with CDR3β length (Figure 2b).
Null Model Comparisons for Variance Explained by TCR features
To generate a suitable null model for variance explained by TCR features, we conducted permutation analyses. Within each donor and tissue sample of the discovery cohort used for training, we permuted the cell type labels (Treg versus Tconv) for each TCR 1000 times. On each permutation, we fit mixed effects logistic regression models for the CDR3βmr and J region as delineated above. (Supplementary Table 7).
Estimating the effects of physicochemical features
To estimate the effects of physicochemical features, we represented each CDRβ loop residue as a vector of length 3, corresponding to the amino acid’s hydrophobicity, isoelectric point, and volume. For consistency with the closely related work by Stadinksi et al.17, we used the whole-residue interfacial hydrophobicity scale43. We used isoelectric point values from the CRC Handbook of Chemistry and Physics44 and volume estimates from IMGT’s conversion of Zamyatnin’s45 measurements to cubed Angstroms (URLs). Each value was scaled to have a mean 0 and variance 1 for regression analysis.
To localize the importance of these physicochemical features within the TCR, we represented each residue belonging to a CDRβ loop as a vector of length 3 corresponding to the amino acid’s hydrophobicity, isoelectric point, and volume, and modeled Treg fate as an outcome of these features using multiple logistic regression. We followed IMGT positioning, wherein the human CDR1β loop consists of positions 27, 28, 29, 37, and 38; while the human CDR2β loop consists of positions 56, 57, 58, 63, 64, and 65. We used only TCR reads with a resolved TRBV gene (78.5% of observations), and imputed CDR loop amino acids based on TRBV gene identity using IMGT (URLs). To enable TCR alignment, we discarded 3.6% of observations with a resolved TRBV gene for which there were not exactly 5 CDR1β amino acids and 6 CDR2β amino acids, or for which CDR1–2 amino acids were not available via IMGT.
To handle the densely correlated TCR features within the CDR1β and CDR2β loops, we applied a ridge penalty to the logistic regression using R package “glmnet.” This regularization served as a penalization strategy alternative to random effects, and so we included batch (donor and tissue source of the TCR) as a fixed and penalized covariate. As in the TRBV gene analysis, we used VGSR as a covariate to partial out genetic variation in TRBV-MHC affinity (Supplementary Note). All predictors were scaled to a have mean 0 and variance 1. We did not assume that position-wise physicochemical effects would translate across different CDR3β lengths, and so fit a separate logistic regression for each length. For each regression, we tuned the λ penalty by testing the 100 values generated by the glmnet package and selecting the one that gave the minimum mean cross-validated error across 10 folds of the training data in the discovery cohort. Sensitivity analyses confirmed that λ=0.01 was an appropriate choice for the data (Supplementary Table 10).
In a separate analysis isolated to the CDR3βmr, we fit a separate mixed effects logistic regression for each length-position combination in the discovery cohort training data (Extended Data Figure 5b). We included all three physicochemical features as fixed covariates for each position, and modeled donor and tissue sources as random effects as described above. Each physicochemical feature was scaled to have a mean 0 and variance 1 for each length-position combination.
For the Figure 4d visualization, we included only TCRs with a CDR3β length of 15 amino acids in the discovery cohort training data, and fit a separate mixed effects logistic regression for each position. Each regression included random intercepts as described above and one fixed covariate corresponding to the amino acid identity at the given position. We cast the most common amino acid as the reference: Leucine for position 108, and Glycine for all other positions.
Assessing TCR residue interactive effects on T cell fate
Since the physicochemical features of hydrophobicity, isoelectric point, and volume captured most of the variance explained by the CDR3βmr (Figure 3b), we used these three features to test for TCR residue interactions with respect to Treg fate. For each pair of TCR positions a and b, we fit nine mixed effects logistic regression models; one for each of the nine possible pairs of the three physicochemical features:
where p is the probability that CDR3β sequence belongs to a Treg, X1a is the hydrophobicity of residue a, X2a is the isoelectric point of residue a, and X3a is the volume of residue a (with analogous values X1b, X2b, and X3b for the physicochemical features of residue b) and intercept terms β0, b1j, b1j and b2i,j are as defined previously. To test for interactive effects, we compared each of these models to a baseline model in which β4 = 0:
All model comparisons were computed by the likelihood ratio test. As depicted in Figure 2b, the CDR3βmr is of variable length, ranging from 2 amino acids in CDR3βs of length 12 to 7 amino acids in CDR3βs of length 17. ( pairs of CDR3βmr residues in length 12 + ( pairs of CDR3βmr residues in length 13 + ( pairs of CDR3βmr residues in length 14 and so forth to ( pairs of CDR3βmr residues in length 17 totals to 56 total pairs of CDR3βmr residues. We fit the nine mixed effects logistic regression models enumerated above for each of these 56 pairs in both the discovery and replication cohorts and integrated the results via meta-analysis as described for other TCR features. With 606 non-interactive TCR features (Supplementary Table 1) and 56 × 9 interactive effects, the Bonferroni significance threshold for these meta-analytic P values was 0.05/((9 *56) + 606) = 4.5 × 10⁻⁵.
Developing the TiRP scoring system
We defined TiRP as the sum of the TCR sequence features present in a given TCR, reasoning that the effects of TCR features were additive provided that they were fit jointly or derived from independent regions of the TCR. To reach a consensus effect size for each TCR feature across the two cohorts, we used inverse-variance weighted meta-analysis. Due to the inconsistent effect size directions for the usage of Valine (V) in the CDR3βmr (Figure 5a, Extended Data Figure 2b), we included only 14 amino acid percent covariates in our final CDR3βmr models (Supplementary Table 1). To exclude potentially unreliable effect size estimates from the score computation, we calibrated a meta-P value significance threshold above which TCR features were excluded from the score. For this, we used a single mixed effects logistic regression for each threshold over a range of thresholds on the pooled discovery and replication TCRs held out for calibration (discovery cohort: 6279, 6196, replication cohort: T1D3). Each mixed effects logistic regression estimated the fixed effect of TiRP on T cell fate, with random intercepts for donor source, tissue source, and each donor-tissue source pair (see “selection of random effects and model comparisons”). We found that no threshold led to significantly greater variance explained than the Bonferroni-corrected threshold, 0.05/612 TCR features, resulting in 25 TRBV genes, 23 Jmotifs, 4 CDR3β lengths, 14 CDR3βmr amino acid percentages, and 142 position-specific features relevant to TiRP computation (Supplementary Table 12).
Testing TiRP in held-out donors from bulk sequencing cohorts
To test TiRP in bulk sequencing data, we scored each unique productive TCR in donors held out from both TiRP training and calibration (discovery cohort donors 6161, 6193, 6207 and 6287, and replication cohort donors HD1, HD2, and T1D6). We then tested the association between TiRP and T cell state by comparing the additional variance explained by a mixed effects logistic regression model including TiRP as a fixed covariate to a baseline model containing only donor ID, tissue source, and donor-tissue interaction as random intercepts (likelihood ratio test). We conducted the same process for nonproductive TCRs in held-out donors, and restricted this analysis to the discovery cohort, in which TCR gDNA was sequenced and therefore out-of-frame reads were available (Supplementary Table 2). To ascertain the difference between high-scoring and low-scoring TCRs in these held-out data, we collected the top and bottom decile of TCRs per donor, and compared the ratio of Tregs to Tconvs between the group of all top decile TCRs and the group of all bottom decile TCRs.
Validating TiRP in single-cell data
In single-cell data analyses, TCR clones were defined by a barcode consisting of their donor ID and CDR3β DNA sequence. As in bulk sequencing analyses, CDR3β chains with a length shorter than 12 amino acids or longer than 17 amino acids were discarded. Only cells with exactly one productive CDR3β detected were included in analyses.
We computed the TiRP score for each clone based on its CDR3β amino acid sequence and TRBV gene. So that TiRP scores would be comparable, percent amino acid values were scaled by the mean and standard deviations of the TCRs held out for testing from the discovery cohort (transformation provided in Supplementary Table 12). TRBV gene usage was determined by MixCR alignments for the Azizi et al. cohort and Park et al. cohort and by RNA expression in the Yost et al. cohort. To determine TRBV gene usage based on RNA expression in the Yost et al. cohort, read counts were log-normalized per cell and then scaled so that each TRBV gene had mean 0 and variance 1 within cells that had non-zero read counts for the given gene. Each cell was then assigned the TRBV gene with the highest normalized and scaled expression. Cells without any TRBV gene expression detected were given a TRBV gene value “unresolved.”
To validate the TiRP score in these data, we tested the association between TiRP score and regulatory or conventional cell phenotype. For the Yost et al. cohort, cell phenotypes based on the original authors’ clustering were available. We labeled all cells in the ‘Tregs” and “Treg” cluster as Treg and all cells in the “Tfh”, “Th17”, “CD4_T_cells”, and “Naïve” to be CD4+ Tconv. For the Azizi et al. cohort, we applied a standard scRNAseq pipeline to infer cell phenotypes: we excluded all cells with read counts from 1000 genes or less or at least 25% of read counts from mitochondrial genes and then used R package “Seurat” with default parameters to 1) normalize the read counts per cell, 2) take the variance-stabilizing transform 3) scale and center gene expression, and 4) compute the first 20 principal components based on the 500 most variable genes. We then used Harmony46 to batch-correct the principal component embeddings by sample (donor_batch ID) and constructed a shared-nearest-neighbor (SNN) graph based on these harmonized embeddings with k=30. Finally, we conducted Louvain clustering on the SNN graph with resolution 0.8, and ran uniform maniform approximation and projection (UMAP) on the first 10 harmonized PCs. After aligning fastq reads from the Park et al. cohort to GRCh38–3.0.0 with cellranger version 6.1.1, we applied this same pipeline, including only the 29 samples from 11 donors (7 pre-natal, 2 pediatric, and 2 adult) with paired TCR sequences available, taking the top 1000 variable genes per sample, harmonizing over DonorID, Sample, and enzyme used (Collagenase or Liberase), and using k=10 for the SNN graph. After clustering all cells with resolution 2.0, we distinguished T cells from other major lineages by expression of CD3G, CD3D, NKG7, CD59, MS4A1, CD34, and CD14. We then filtered our analysis to T cells, re-transformed expression, re-computed and harmonized PCA, re-constructed the SNN graph, and re-clustered the cells at resolution 3.0 to identify Treg thymocytes (Extended Data Figure 6).
To create 95% confidence intervals for Treg odds per TiRP decile (Figure 5d−e), we conducted bootstrapping with 10,000 iterations via R package “boot.”
Creating a CD4+ memory T cell single cell reference
To construct a reference of cellular phenotypes for CD4+ memory T cells, we used a published dataset27of scRNAseq and CITE-seq for 500,000 memory T cells from 259 donors (Supplementary Table 2). From these quality-controlled data, we used CITE-seq values to select 430,270 CD4+ cells (normalized CD4 > 1.5 and normalized CD8 <1, consistent with the original authors’ procedure). We followed the method developed by Nathan et al. to cluster the cells based on integrated mRNA and protein expression. First, we used R package “Seurat” to normalize the read counts per cell, take the variance-stabilizing transform and then scale gene expression to have a mean 0 and variance 1. We selected the union of the 1500 most variable genes (by mRNA expression) in each donor, resulting in 4707 variable genes.
To integrate surface protein information, we used CCA. First, we resolved the coefficients that maximized the correlation between linear combinations of the 4707 genes and the 31 manually-curated surface proteins27 in the CITE-seq panel (“cc” function from R package “CCA”). We then projected the cells into the 31 canonical dimensions in mRNA space, and used Harmony46 with default parameters to harmonize the embeddings of these canonical dimensions by donor. For visualization, we used the R package “uwot” to conduct UMAP on the first 10 canonical dimensions using the cosine metric, a local neighborhood size of 30, and a minimum distance of 0.3 between embeddings. To identify cell types, we constructed a SNN graph (k=10) from the harmonized embeddings of the first 10 canonical dimensions, and conducted Louvain clustering on the SNN graph with resolution 0.8, revealing one cluster (#6) with markedly elevated FOXP3 and CD25 expression and reduced CD127 expression. We labeled cells belonging to this cluster as Tregs and manually annotated the phenotypes of the other clusters based on surface expression of the 31 manually-curated, immunologically relevant surface proteins as well as mRNA expression of CCR7, IFNG, GZMK, and CTLA4 (Extended Data Figure 7c−d).
Mapping tumor-infiltrating T cells with Symphony
Before ascertaining mixed clones in tumor-infiltrating cells, we standardized Treg and Tconv definitions between the two cohorts by projecting cells from both cohorts into the annotated low-dimensional space of the reference single cell dataset. To accomplish this projection and simultaneously harmonize the tumor-infiltrating cells by cohort, donor and sample, we utilized Symphony26. Because the reference dataset consisted of only memory T cells and our hypothesis focused on expanded clones, we mapped only the tumor-infiltrating cells for which their paired CDR3β DNA sequence was detected on more than one cell within their patient sample (56.1% of cells in the Azizi et al. cohort, 60.6% of cells in the Yost et al. BCC cohort, and 73.7% of cells in the Yost et al. SCC cohort). For each cohort separately, we used Symphony to map the query cells into the harmonized reference canonical variate embedding space while integrating over unwanted sources of technical variation tagged by donor and sample in the query. We used the resultant canonical variate embeddings to 1) impute cluster membership for query cells via k-nearest-neighbors in the reference cohort (R package “class”, k=5), and 2) project the query cells into the reference UMAP embedding. To visualize TiRP trends, we colored each cell by the average TiRP of its 100 nearest query neighbors in the 31 canonical dimensions (Figure 6c).
Mixed clone analysis with bulk sequencing data
We conducted our mixed clone analysis with bulk sequencing data in the donors from the discovery and replication cohort that were held out from the estimation of TCR feature effect sizes and TiRP score calibration (Supplementary Table 2). Clones were defined by the “barcode” consisting of their CDR3β nucleotide sequence, TRBV gene ID, and donor ID. Because clonal expansion is a prerequisite to mixed clone status, we compared mixed clone TiRP scores to those of expanded Tconv and Treg clones. For the discovery cohort, TRB chains were sequenced from gDNA, and so clonal expansion could be derived from the number of “templates” for each clone (number of biological molecules prior to PCR amplification, inferred by immunoSEQ via internal bias control). Because TRB chains were sequenced from cDNA in the replication cohort, we cannot know whether identical reads within the same sample represent TRB transcripts from one or multiple cells. However, we can deduce that identical reads across multiple flow-sorted samples from the same individual arose from multiple cells and therefore an expanded clone. Therefore, for the replication cohort, we collected a sample of the expanded clones from each donor by aggregating all CDR3β nucleotide sequences that arose in multiple flow-sorted samples from the same individual (Treg, naive Tconv, central memory Tconv, and stem-cell like memory Tconv). Because there was only one Treg sorted sample for each individual, we could only detect pure Tconv or mixed clones in the replication cohort. We tested the effect of TiRP score on clone phenotype with mixed effects models as designed in the single-cell analyses.
Mixed clone analysis with single cell data
To detect mixed clones in single cell data, we aggregated cells into clones based on matching clonal “barcodes:” patient ID, TRB DNA sequence, TRBV gene, and TRA amino acid sequence. To protect against contamination by doublets (droplets encapsulating two cells rather than one), we excluded cells with more than one unique TRB chain detected. Since the expression of multiple TRA chains, however, is a common biological phenomenon47, we did not exclude multi-TRA chain cells. To assign a clonal barcode TRA for these cells, we selected the TRA sequence that was most often expressed by cells with a matching TRB DNA sequence in the given patient.
To model the effect of TiRP score on clone phenotype (Tconv, Treg, or mixed), we used mixed effects logistic regression with random intercept for the clone’s source patient and the clone’s source cohort (BRCA, SCC, or BCC). Since clonal expansion is a prerequisite to mixed clone status, only clones of size > 1 were included. We used the LRT to compare the model including TiRP to a baseline model containing only the random covariates. We conducted this process twice: first to compare mixed clones to purely Tconv clones, and second to compare mixed clones to purely Treg clones.
We then quantified the clone phenotype by taking the natural log transform of the within-clone Treg/Tconv ratio, with one “hallucinated” Treg and one “hallucinated” Tconv per clone to protect against numerically unstable estimates. We tested the effect of TiRP score on this quantitative clone phenotype using mixed effects linear regression with random intercepts as described above, and found a 0.065 increase in ln(Treg/Tconv ratio) per standard deviation increase in TiRP score (Figure 6h, P = 1.6 × 10⁻⁴, LRT).
To check that FOXP3 expression was significantly different between Tregs and Tconvs within mixed clones, we conducted a Student’s paired t-test and confirmed that this was indeed true (Extended Data Figure 8e).
Analysis of murine TCRs
T cell clones were defined by the barcode consisting of CDR3β amino acid sequence, TRBV gene identity, and donor ID. Due to ambiguity, clones observed in both Treg and Tconv samples from the same donor or in both the Helios+ and Helios- Treg samples from the same donor were excluded from the following analyses. Clones with member cells in both the naive Tconv and memory Tconv samples from the same donor were labeled with the memory Tconv phenotype.
To compute the TRBV gene component of the TiRP score in murine data, we assigned each murine TRBV gene the TiRP coefficient of its human homolog according to human-mouse TRBV correspondences listed in IMGT (URLs). Murine and human TRBV genes were aligned for comparison in Extended Data Figure 9d by this same correspondence scheme. Murine TRBV genes with multiple human TRBV gene homologs were assigned the average of their human homolog coefficients. Because the reference TRBV gene in human data, TRBV05–01, does not have a murine homolog, comparing TRBV gene effect sizes in mouse and human required a change to a common reference. We encoded TRBV19–01 as the reference for murine mixed effects logistic regression models, and translated human TRBV gene effect sizes to those that would be obtained from TRBV19–01 as the reference by subtracting the meta-analytic effect size for TRBV19–01 from all TRBV gene effect sizes (including TRBV05–01, originally at 0).
TCR feature Principal Components Analysis
To contextualize the amount of T cell phenotypic variation explained by TCR features identified in our work, we performed a principal components analysis on the matrix of samples by TCR feature means for the replication cohort, in which sorted samples for all T cell phenotypes of interest were available (Supplementary Table 2, Figure 7a). For categorical TCR features such as TRBV gene or Jmotif, we one-hot-encoded the variable into a binary vector equal to the length of possible values, and took the mean of each of the positions. As this process rapidly expands the dimensionality of each sample, we summarized the TCR features in the CDR3βmr by percent composition of each amino acid only. We used the function “prcomp” from R package “stats” to conduct singular value decomposition of the centered and scaled matrix of samples by mean TCR features.
Analyzing the TiRP of Autoreactive TCRs
To survey the TiRP of known autoreactive TCRs, we collected all CD4+ β chain TCRs currently documented in McPAS-TCR32 and VDJdb33 with an association to autoimmune disease. For TiRP scoring, we included only TCRs with a CDR3β length of 12–17 amino acids. For these 375 unique TCRs, we manually inspected their source publications, and included only the 361 TCRs whose autoreactivity was confirmed by tetramers or APCs pulsed with a known peptide. For reference, we compared these TiRP scores to repertoire memory CD4+ Tconv cells from donors held-out from TiRP training and calibration (n=3 donors). Specifically, we fit a linear model of TiRP score as a function of TCR category (Tconv memory or autoimmune), and used the Wald test to assess whether TCR category is associated with a significant TiRP difference.
Memory-Naïve TCR comparisons
T cell clones were defined by the barcode consisting of CDR3β amino acid sequence, TRBV gene identity, and donor ID. Due to ambiguity, clones observed in both Treg and Tconv samples from the same donor were excluded from the following analyses. Clones with member cells in both the naive Tconv and memory Tconv samples from the same donor were labeled with the memory Tconv phenotype.
For the replication of Tconv memory-naive TRBV effects in the Soto et al. cohort31, two additional steps were necessary to accommodate the deeper TCR sequencing within these individuals. First, only TCRs with a Cysteine at position 104 and Phenylalanine at position 118 were included. Though there does exist some minor physiologic variation at these conserved sites, such outlier sequences are not relevant to TiRP score computation. Second, though the donor source of each TCR was modeled as a random effect in other cohorts, we modeled it here as a fixed covariate, reducing computational burden and allowing the maximum likelihood estimation to converge.
URLs
ImmuneAccess:
https://clients.adaptivebiotech.com/immuneaccess
Thymic TCR bulk sequencing:
https://github.com/Aleksobrad/Humanized-Mouse-Data
Amino acids encoded by TRBV genes:
Amino acid volumes:
http://www.imgt.org/IMGTeducation/Aide-memoire/_UK/aminoacids/abbreviation.html
Extended Data
Extended Data Fig. 1: Mutual information structure of the TCRβ sequence.
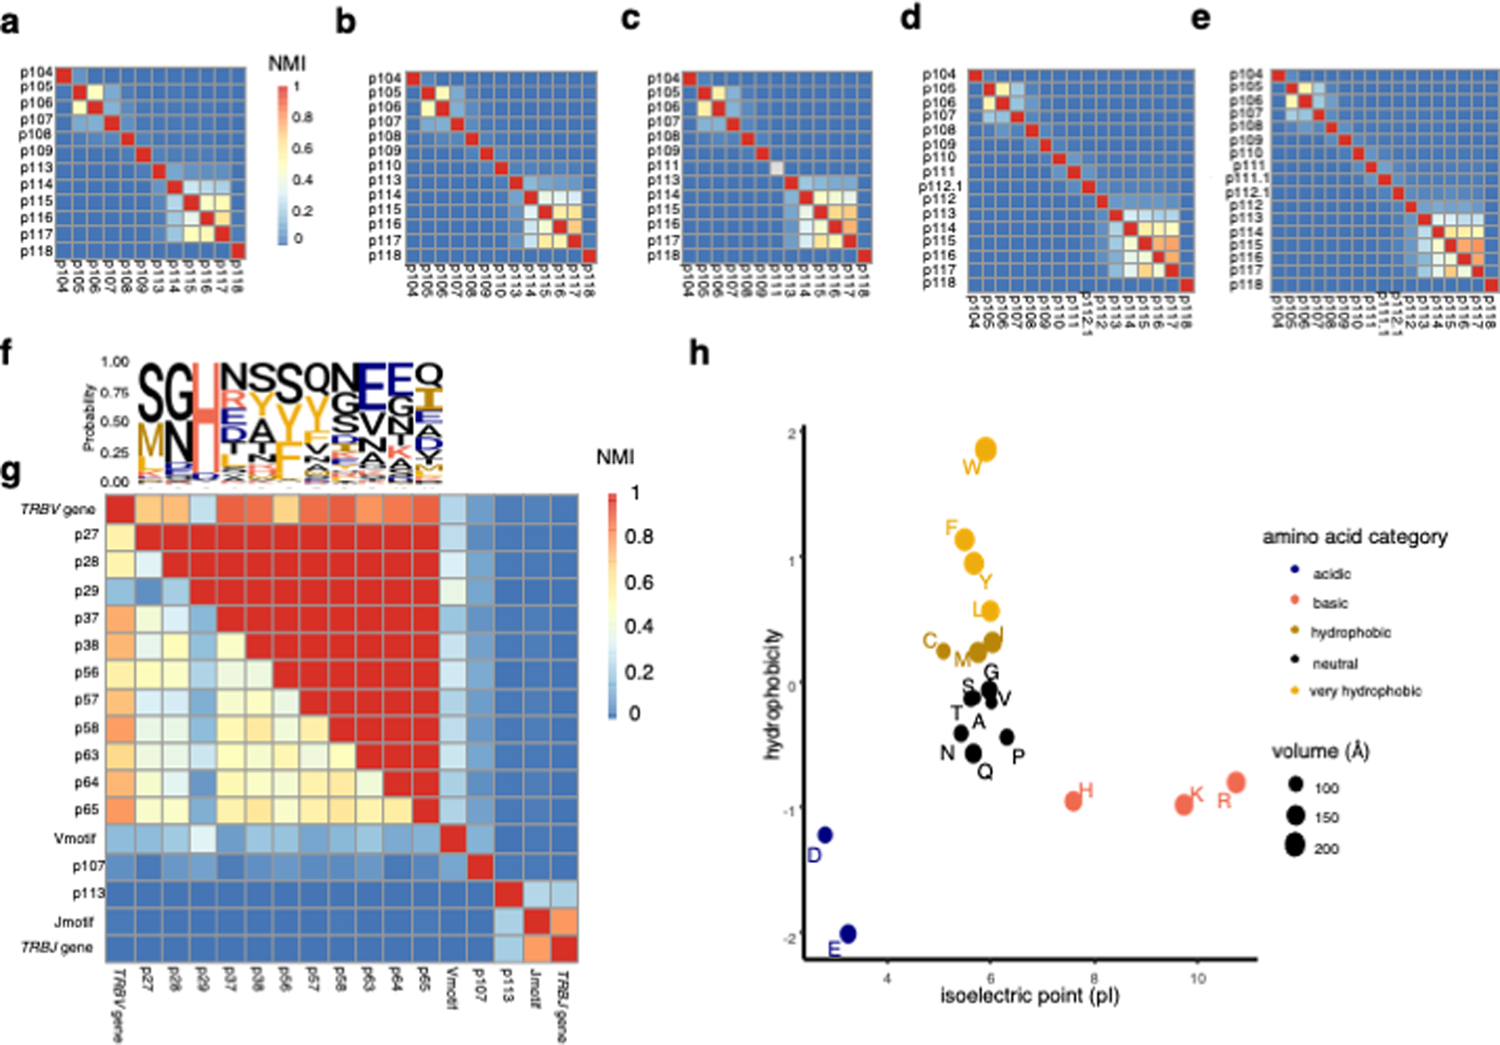
(a) – (e) Heatmap depicting the mutual information structure of the CDR3β amino acid sequence for CDR3βs of length 12 (a), 13 (b), 14 (c), 16 (d), and 17(e) in the discovery dataset. The lower diagonal features normalized mutual information (NMI) between each pair of TCR positions, while the upper diagonal features the maximum mutual information achieved by conditioning on any other TCR position. NMI color scale for (a)-(e) is provided in (a). (f) Probability of each amino acid in each TCR position depicted by a sequence logo. (g) Heatmap as in (a) – (e) for CDR1β and CDR2β loop positions as well as TCR features derived from the flanking regions of CDR3β (Methods). (h) Categorization of amino acids by isoelectric point and interfacial hydrophobicity (Methods).
Extended Data Fig. 2: Consistency of TCR feature effects across individuals and clinical phenotypes.
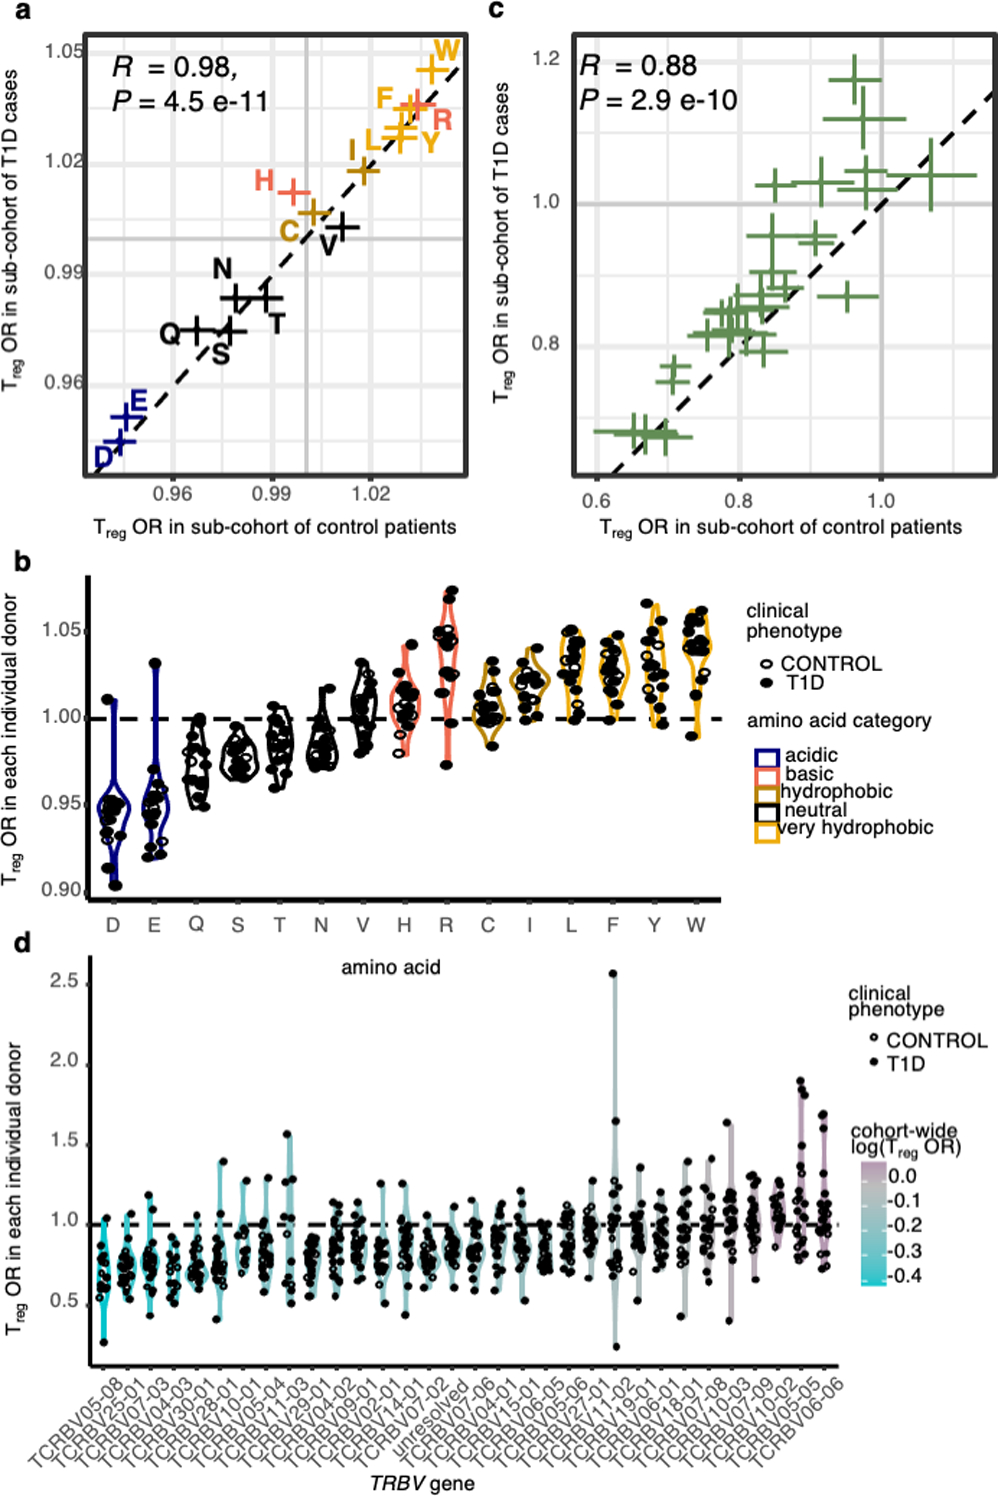
(a) Treg odds ratio per standard deviation increase in CDR3βmr occupancy by each of the 14 relevant amino acids, estimated separately for the T1D cases in the discovery cohort (y axis) and the controls (x axis) (b) Treg odds ratio per standard deviation increase in CDR3βmr occupancy by each of the 15 relevant amino acids, estimated separately in each donor. (c) Treg odds ratio for the usage of each TRBV gene relative to the reference gene TRBV05–01, estimated separately for the T1D cases in the discovery cohort (y axis) and the controls (x axis) (d) Treg odds ratio for the usage of each TRBV gene relative to the reference gene TRBV05–01, estimated separately in each donor. P values in (a) and (c) are calculated by a two-sided t-test with Fischer transformation on Pearson’s R.
Extended Data Fig. 3: Multicollinearity analysis.
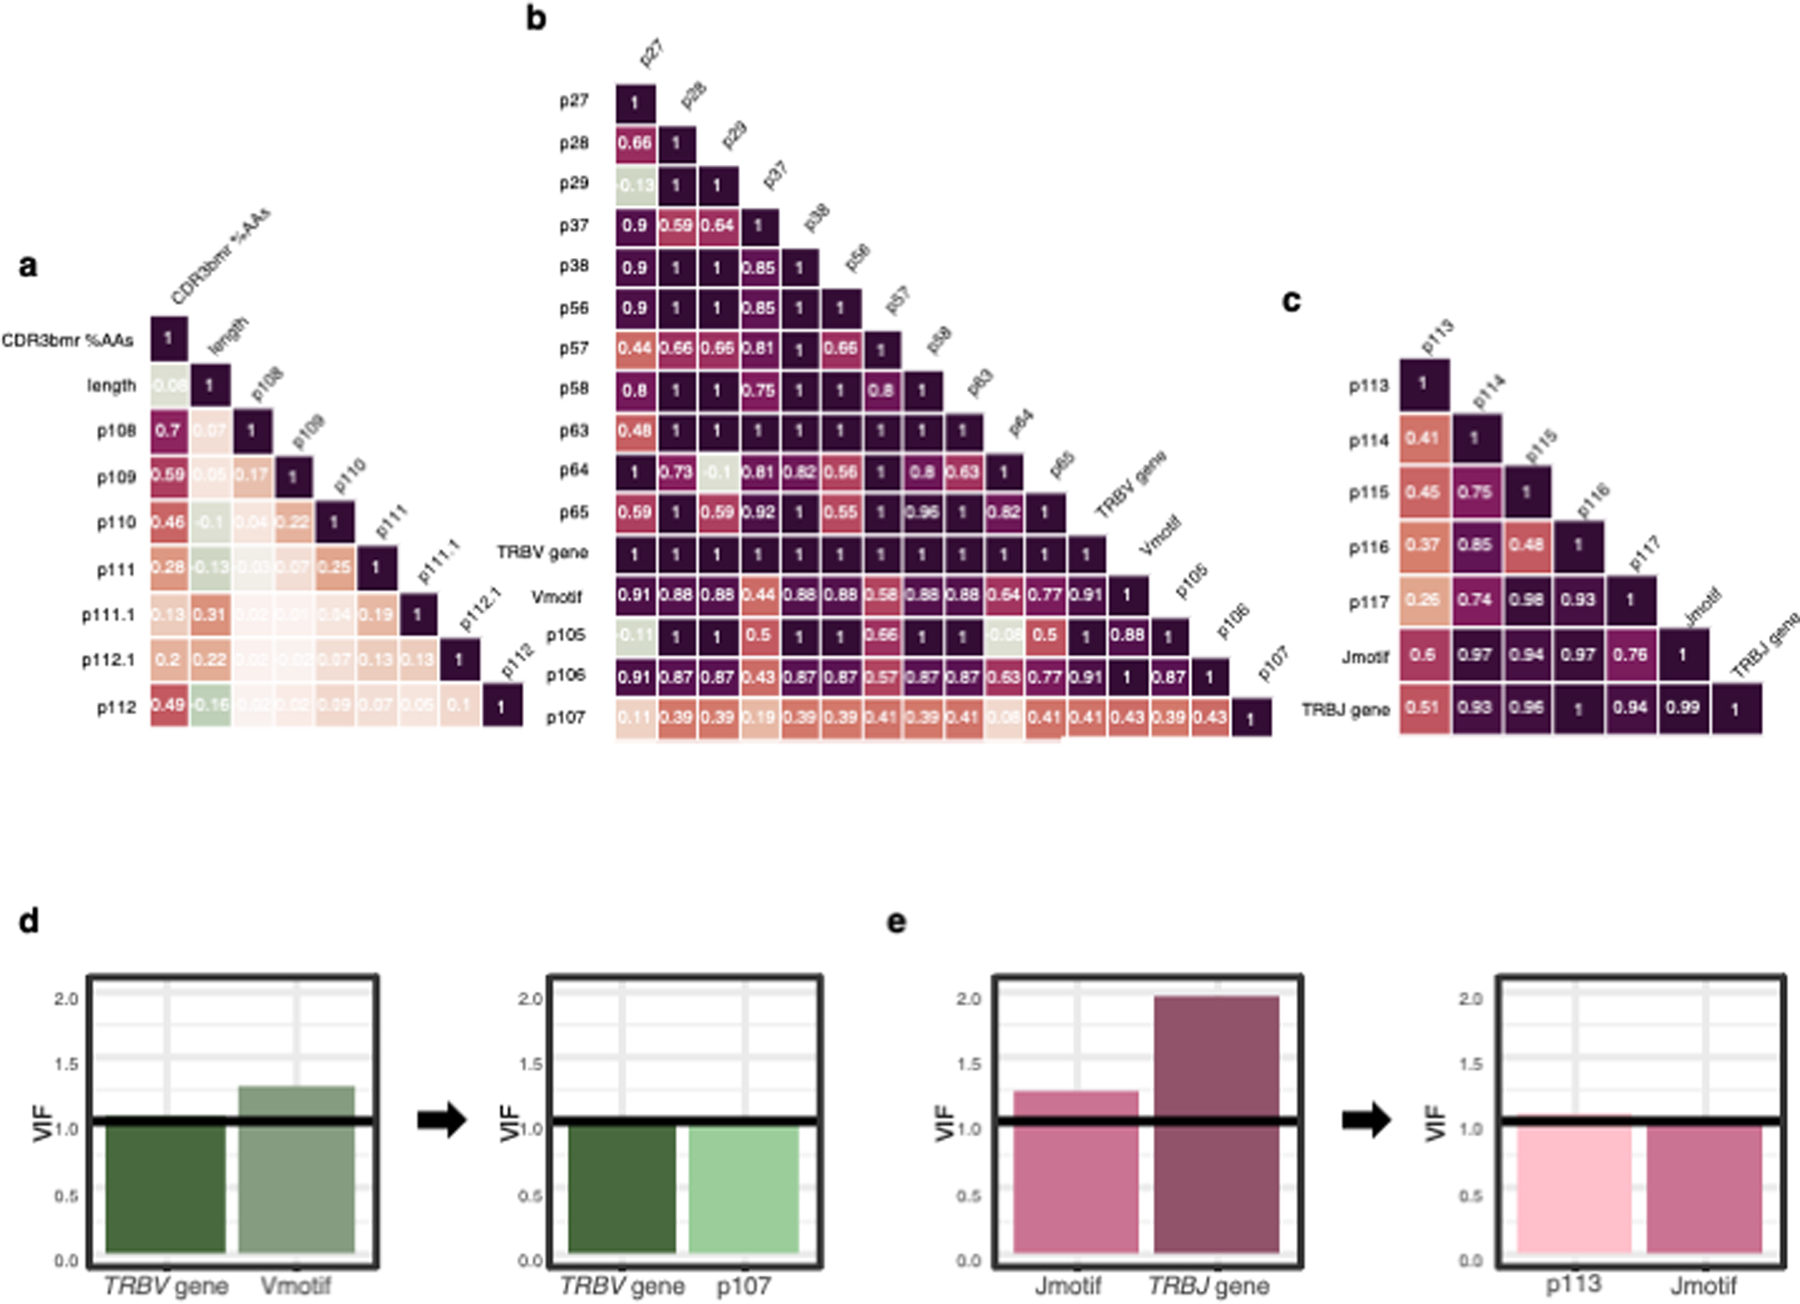
(a)-(c) Maximum Pearson’s correlation observed between each pair of TCR features in the discovery dataset, for all possible combinations of amino acid-based TCR feature values (Methods). Heatmaps are separated by TCR region: (a) CDR3βmr, (b) TRBV-encoded (CDR1β loop, CDR2β loop, and the V-region of CDR3β) and, (c) TRBJ-encoded. (d) Feature selection for the V-region model based on variance inflation in estimated regression coefficients (Methods); each plot represents a candidate mixed effects logistic regression model jointly modeling the effects of TCR features on the x-axis. Black arrow denotes improvement from the first model to the second model via reduction of the variance inflation factor (VIF). Black horizontal line denotes the ideal VIF: zero inflation compared to a model with uncorrelated features. (e) Same as (d), for candidate J-region models.
Extended Data Fig. 4: Thymic selection rates for TRBV and TRBJ genes.
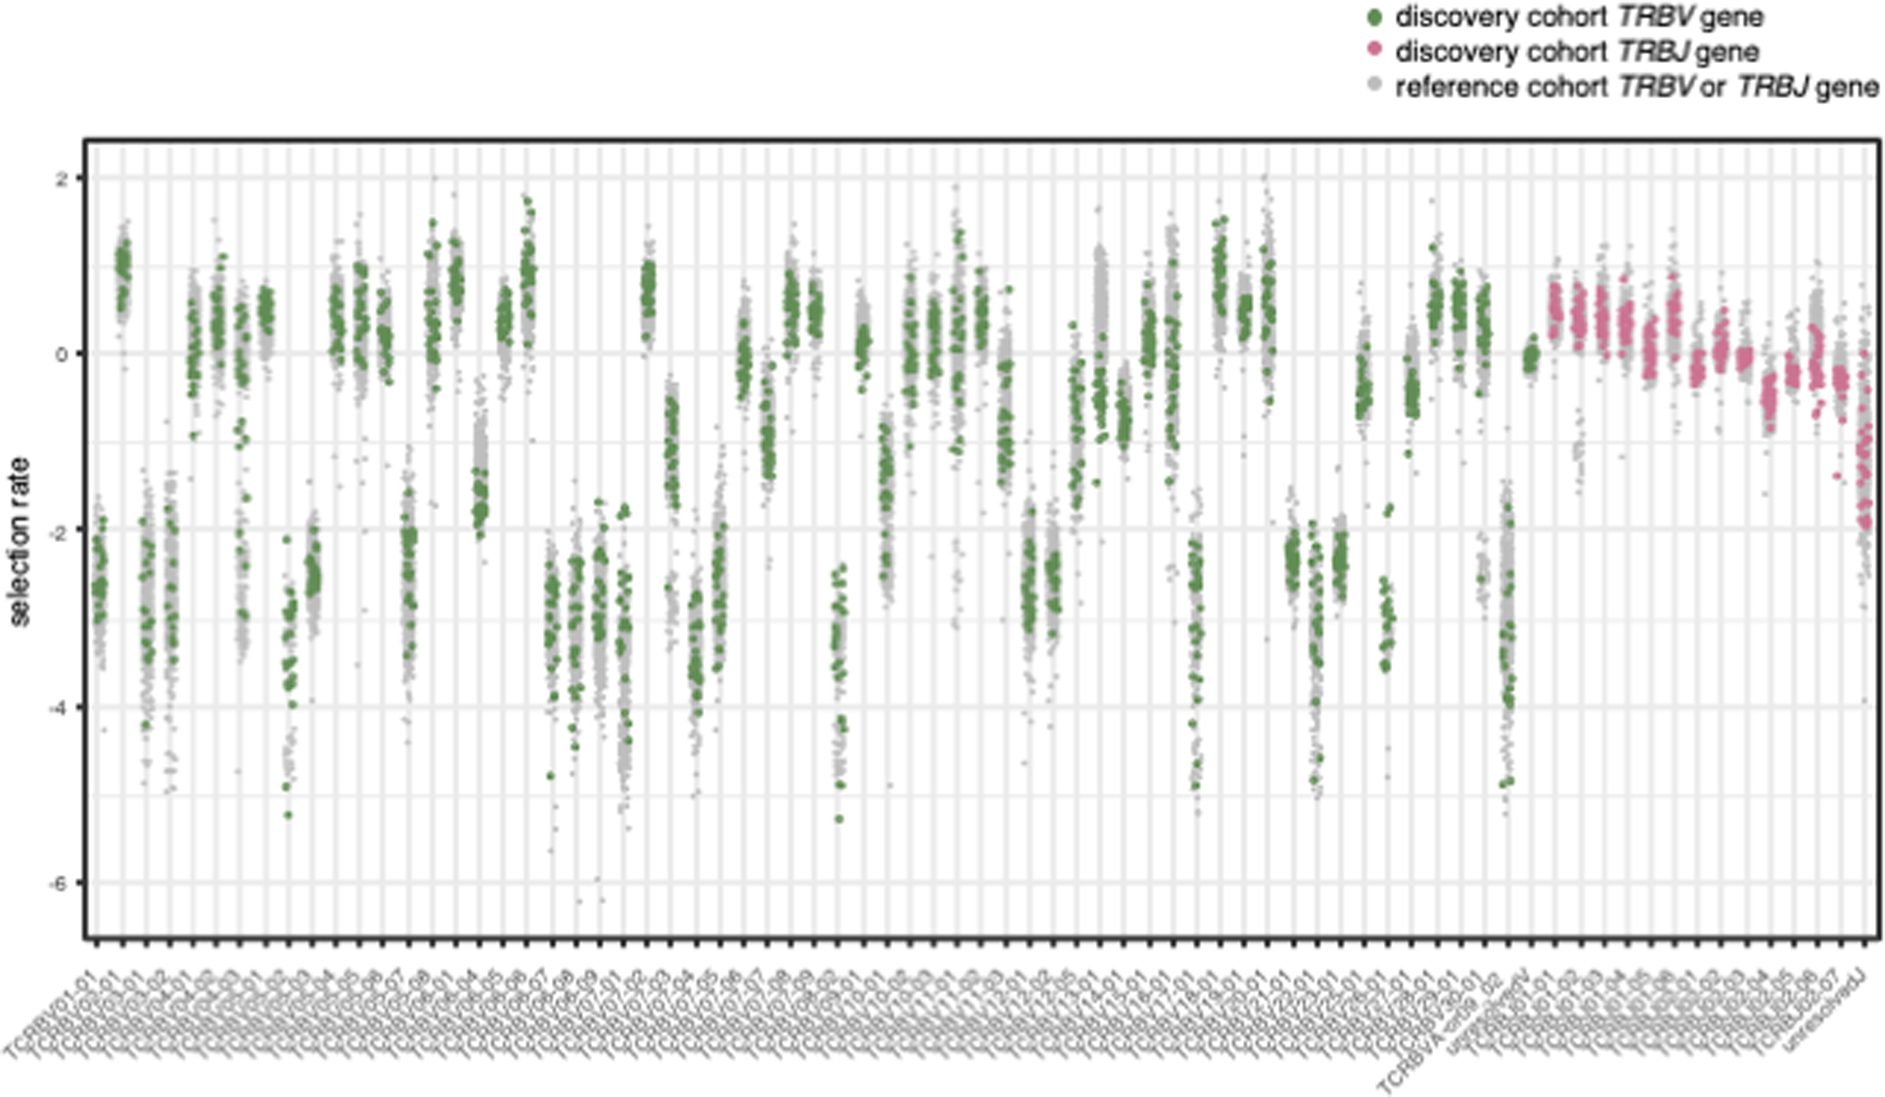
Thymic selection rates for each TRBV and TRBJ gene in each donor in the discovery cohort and in a reference cohort of 666 healthy donors, inferred by relative gene usage in productive reads versus nonproductive reads (Supplementary Note).
Extended Data Fig. 5: Estimated effects of physicochemical features at each TCRβ position, stratified by CDR3β length.
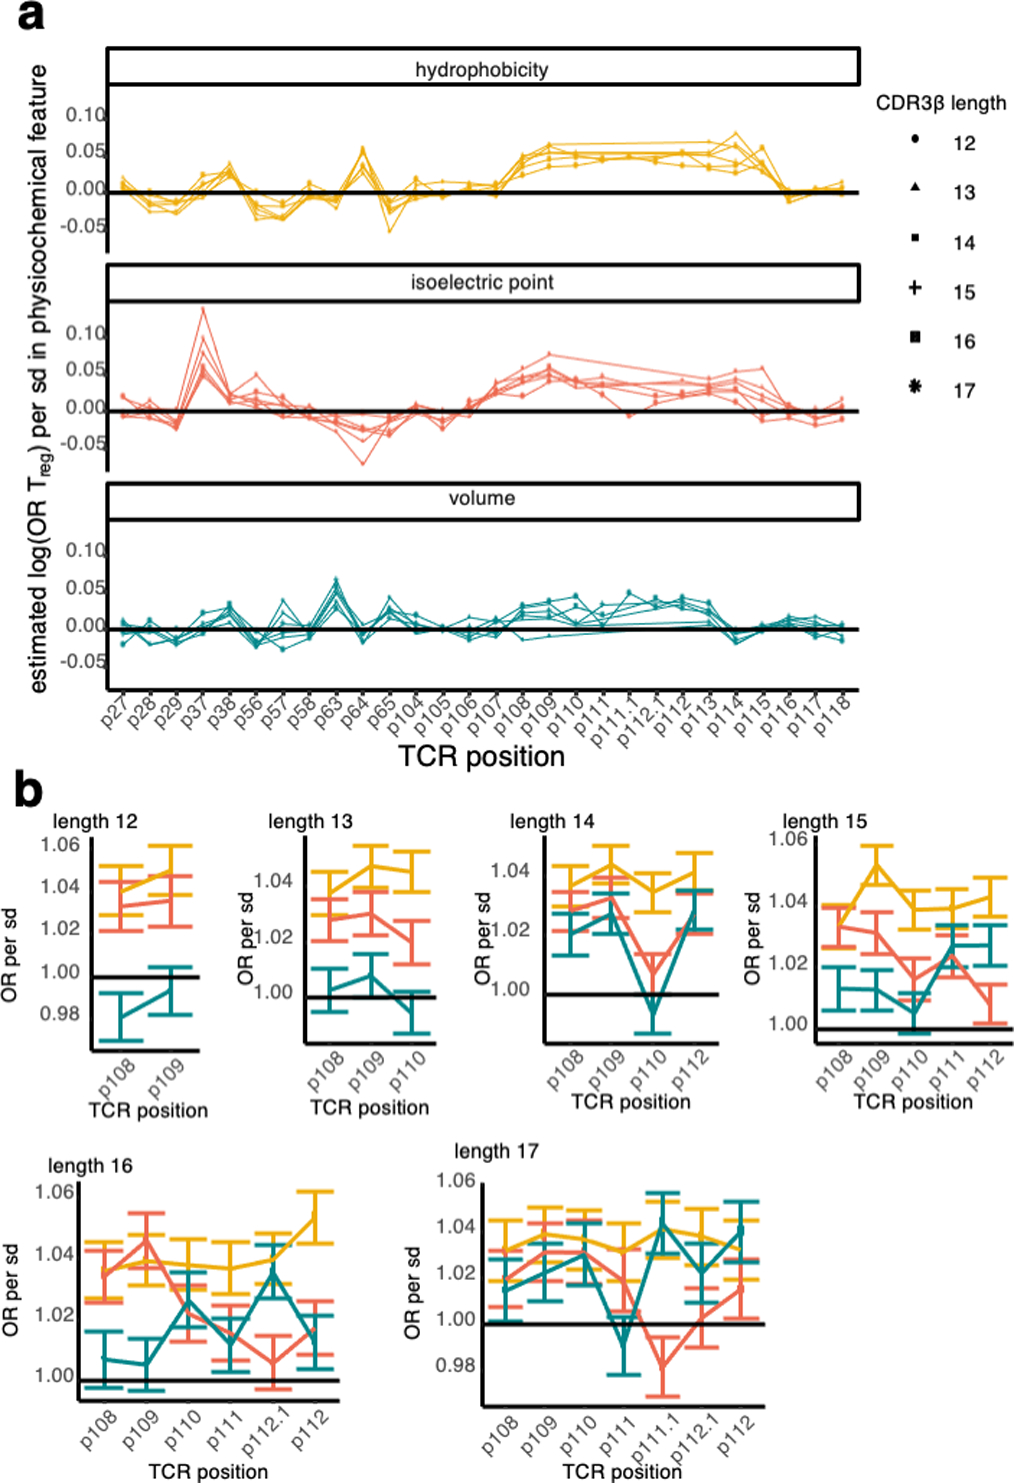
(a) Estimated log odds ratio for Treg per standard deviation of each physicochemical feature at each CDRβ(1–3) loop position in each CDR3β length; features with an estimate > 0 are positively associated with Treg fate while features with an estimate < 0 are negatively associated. For each CDR3β length, all effects were estimated jointly in an L2-regularized logistic regression with a penalty weight tuned via 10-fold cross-validation (Methods). (b) Treg odds ratio per standard deviation increase in each physicochemical feature at each CDR3βmr position for each CDR3 length (Methods, Supplementary Table 9). Error bars denote 95% confidence interval for the estimated odds ratio.
Extended Data Fig. 6: Cell type identification for thymic T cells.
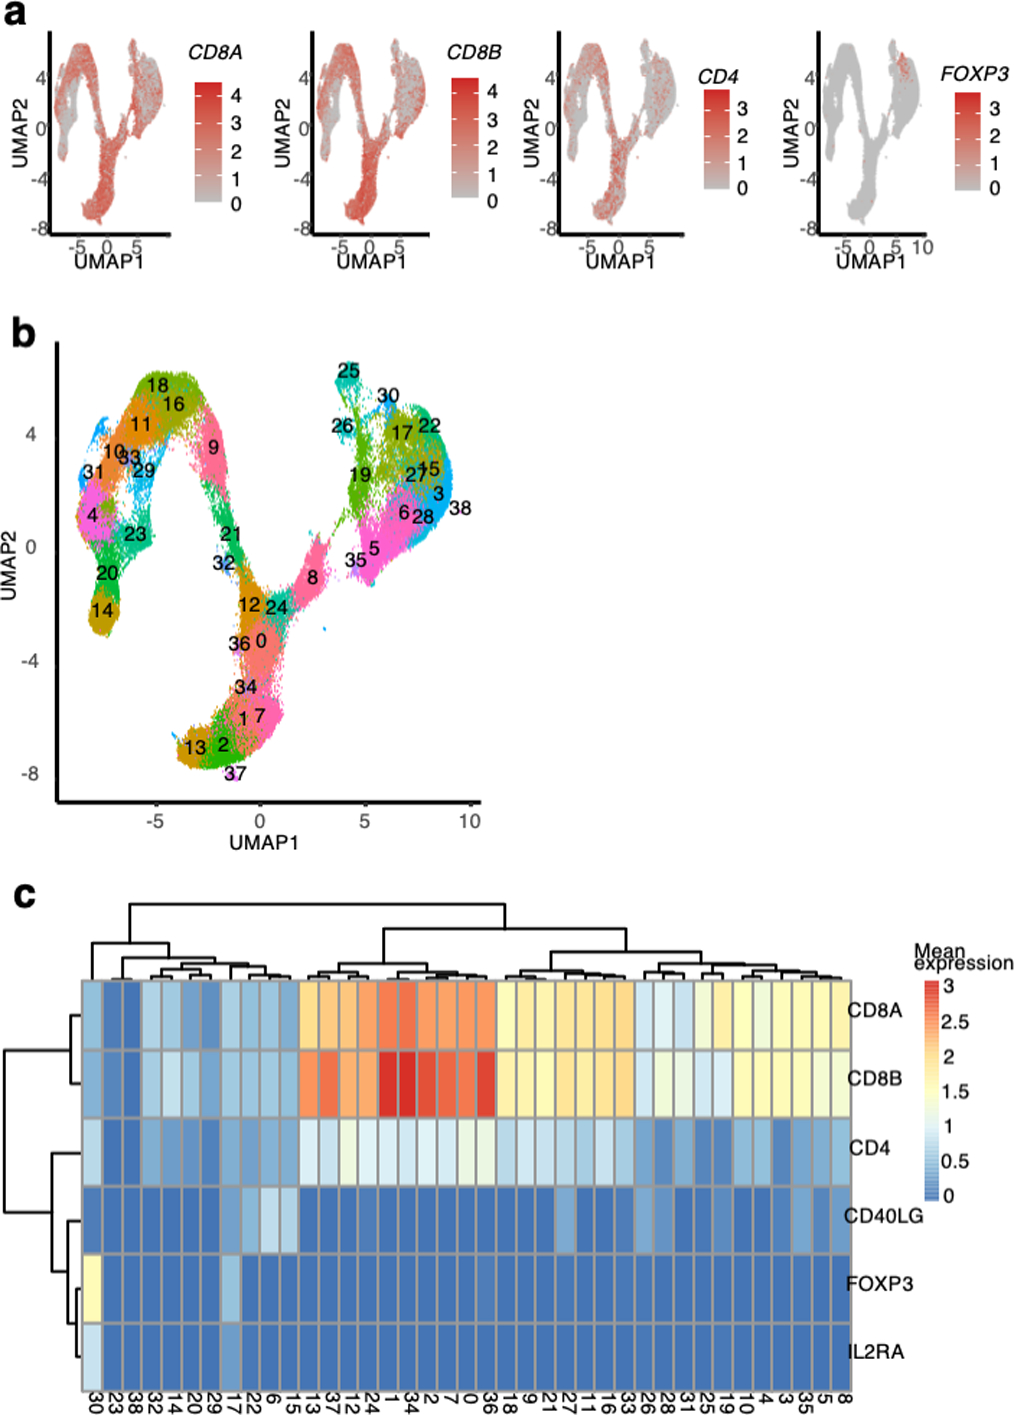
(a) scRNAseq thymic dataset13 cells arranged in a 2-dimensional embedding by UMAP and colored by normalized expression level of select transcripts; gray (low) to red (high). (b) Transcriptional cluster assignments. (c) Average normalized expression of cell-type-relevant transcripts per cluster.
Extended Data Fig. 7: Cell type identification for tumor microenvironment T cells and reference T cells.
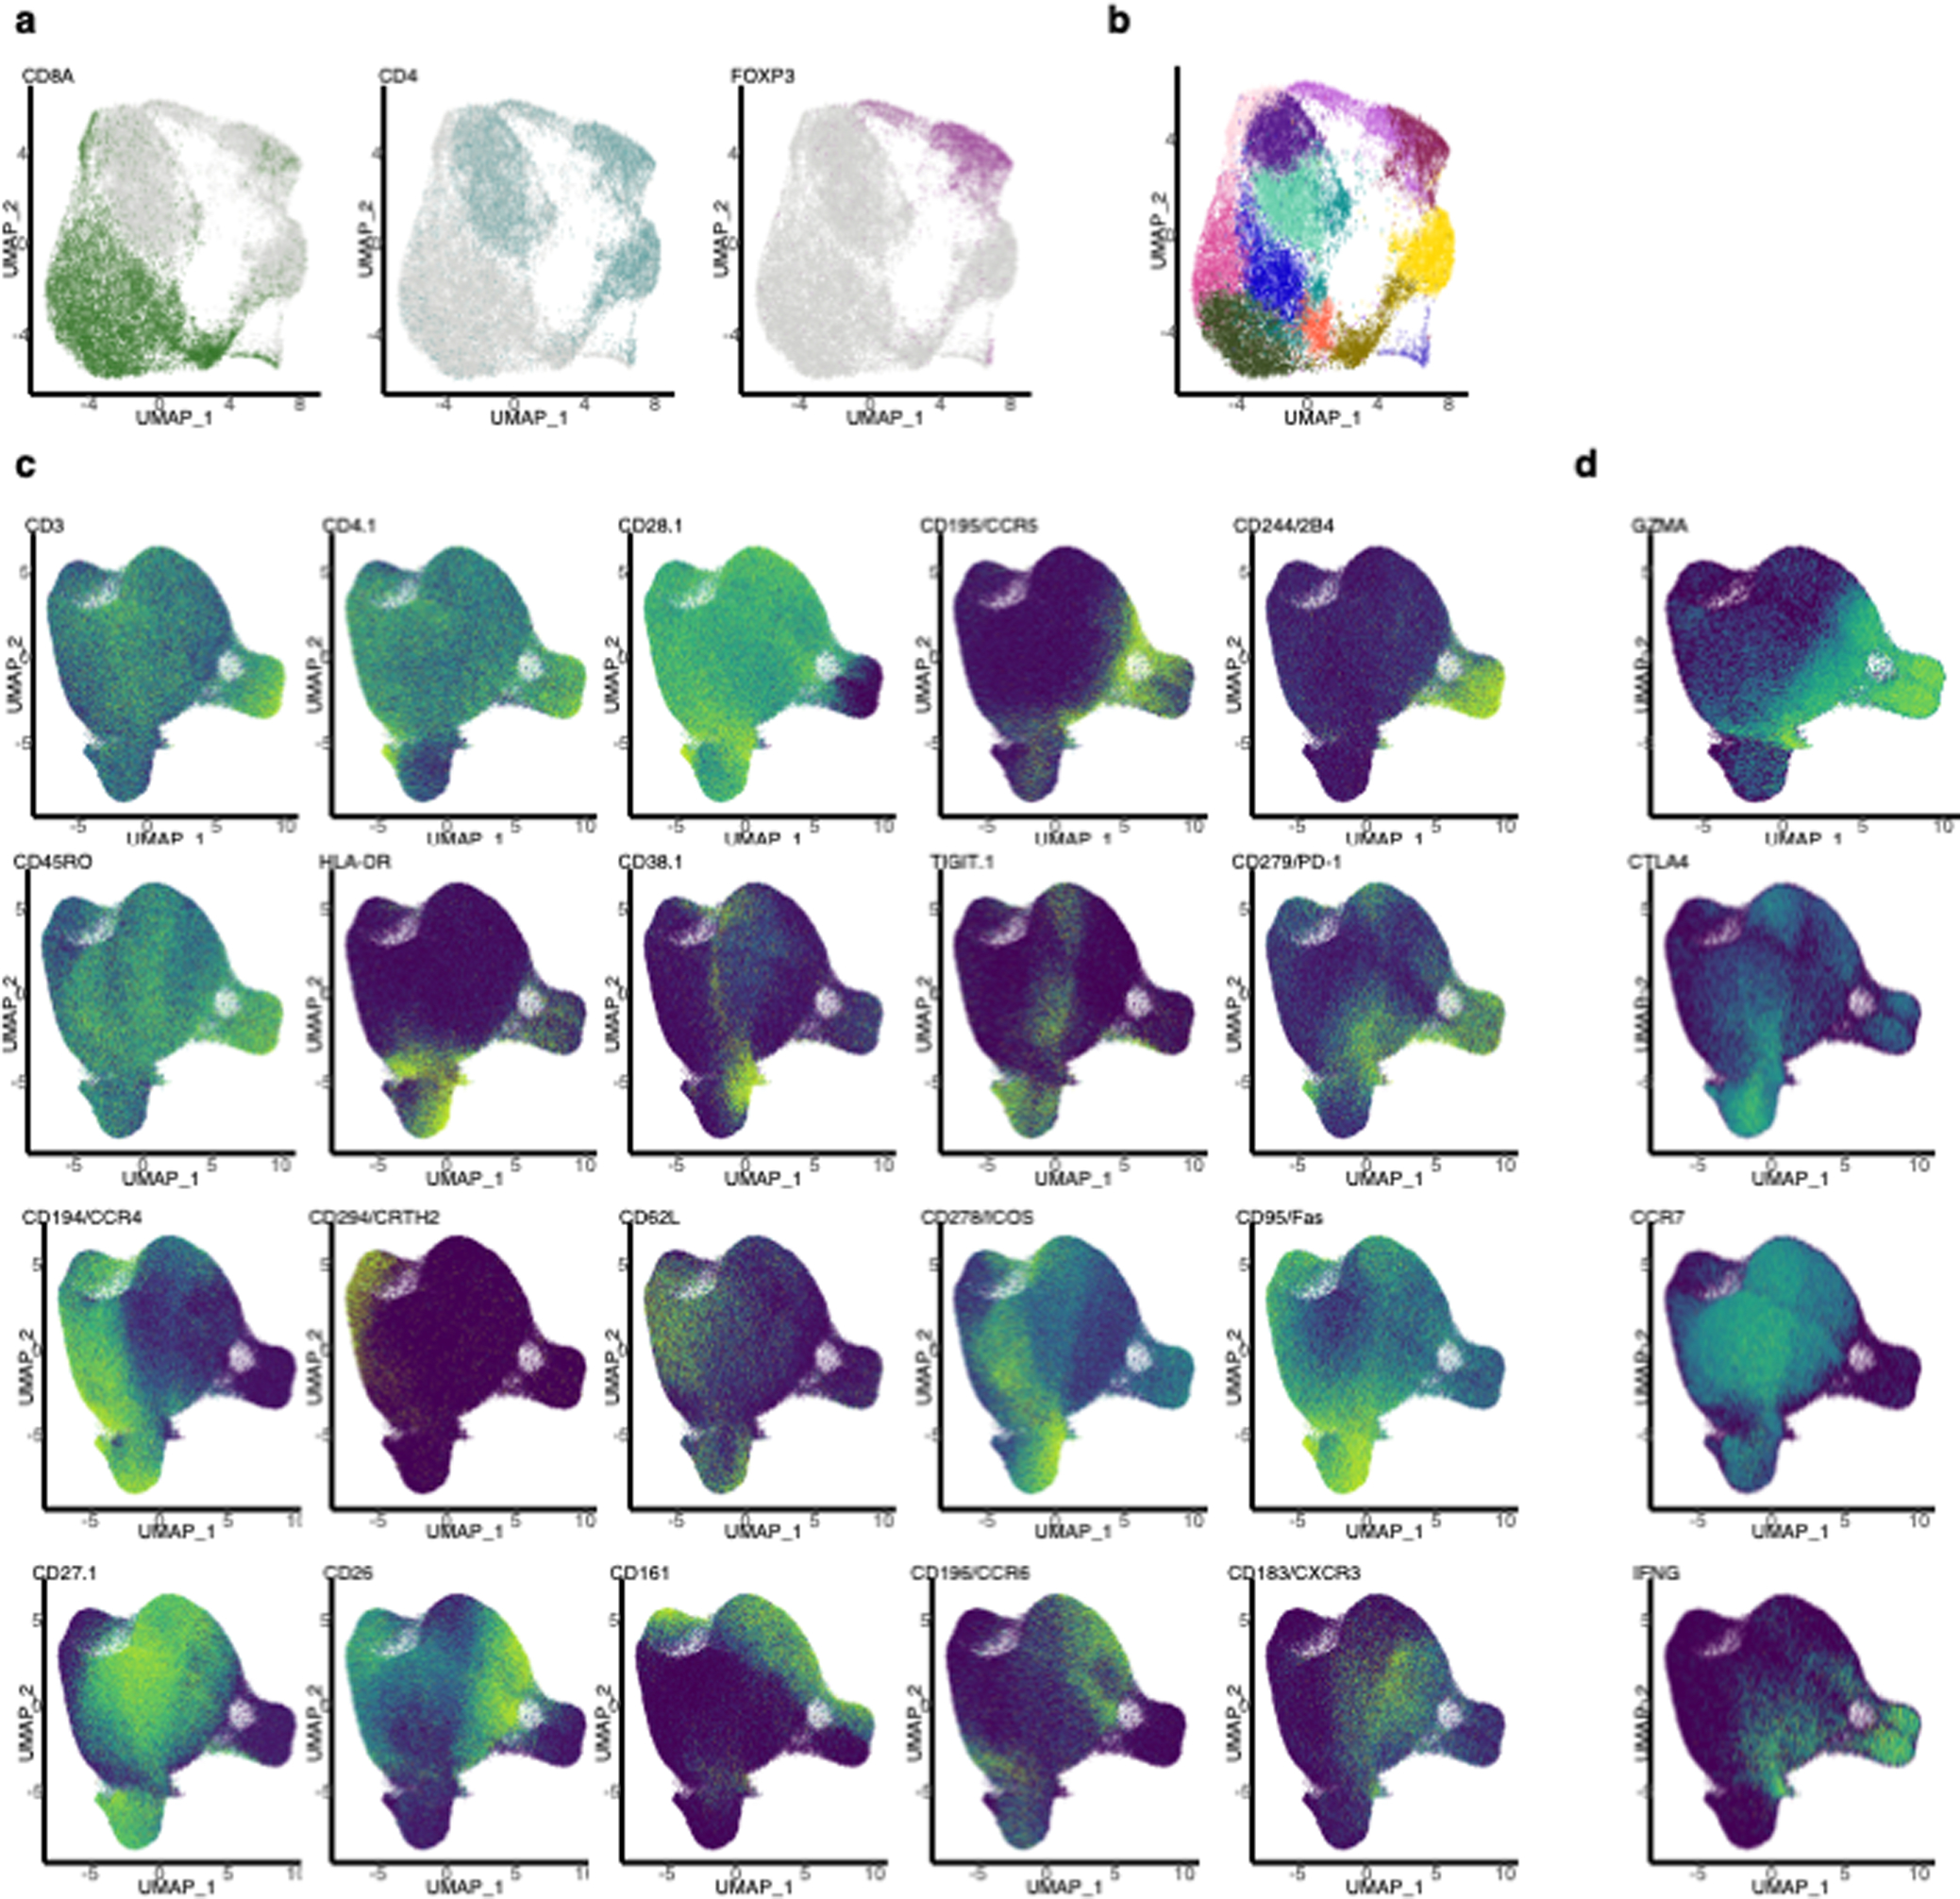
(a) Log-normalized CD8A, CD4 and FOXP3 mRNA expression in T cells from breast tumor biopsies in Azizi et al. 2018, organized into a 2-dimensional embedding by Uniform Maniform Approximation and Projection (UMAP). (b) Louvain clustering of breast tumor microenvironment T cells. Broad cell type labels are indicated for each cluster in the surrounding legend. (c) Expression levels of key surface proteins measured by CITE-seq in the CD4+ reference single cell dataset25 (low = purple, high = light green). Protein levels are normalized by the centered log-ratio (CLR) transformation (Methods). (d) LogCP10K-normalized expression levels of key mRNA transcripts in the CD4+ reference single cell dataset25 (low = purple, high = light green).
Extended Data Fig. 8: Symphony mapping details.
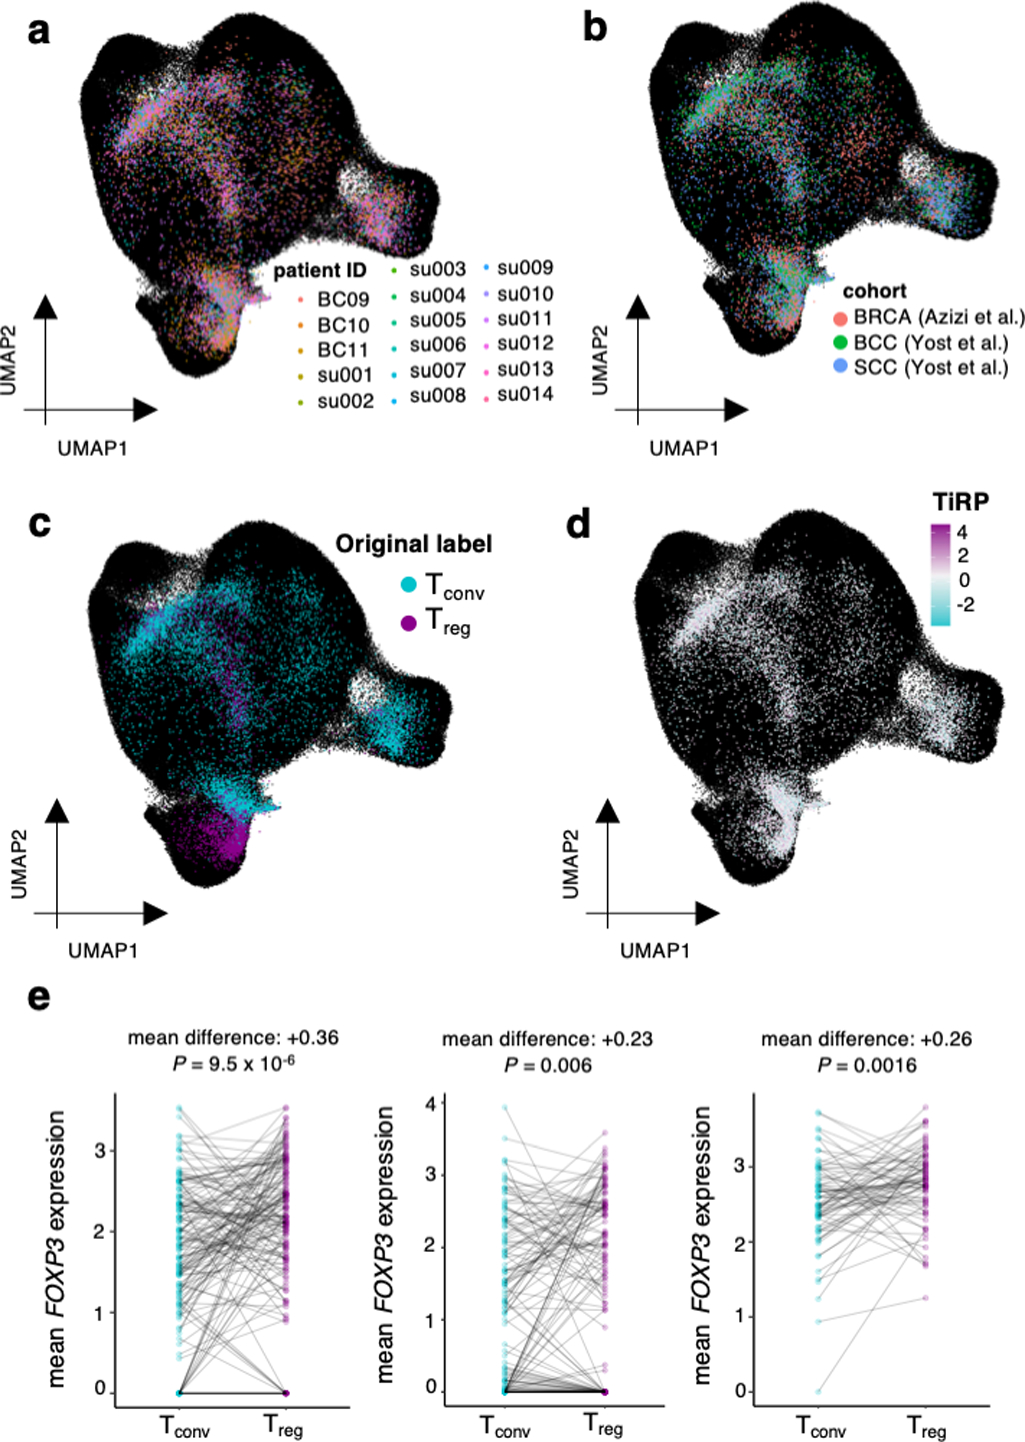
(a) Tumor microenvironment T cells mapped into the reference embedding by Symphony, colored by donor to reveal successful integration of donors. (b) same as (a), colored by cancer type to reveal successful integration of cohorts. (c) Tumor microenvironment T cells mapped into the reference embedding by Symphony, colored by cell types derived from internal clustering (by Yost et al. for the SCC and BCC samples, and as depicted in Extended Data Figure 7a−b for the BRCA samples) to show the extent of concordance with Symphony’s cell type solutions. (d) same as (a), colored by the TiRP score of their TCR. TiRP is scaled such that 0 corresponds to the mean score and one unit corresponds to one standard deviation of held-out bulk sequencing TCRs (Figure 5c). (e) FOXP3 expression differences between Tregs and Tconvs within mixed clones of three representative donor samples. Each mixed clone is represented by a line connecting the average FOXP3 expression of Tregs within the clone to the average FOXP3 expression of Tconvs within the clone. Each P value is computed by a two-sided paired t-test comparing the mean FOXP3 expression in Tregs to that in Tconvs within each mixed clone.
Extended Data Fig. 9: Further analysis of principal components, murine Tregs, and human memory Tconv.
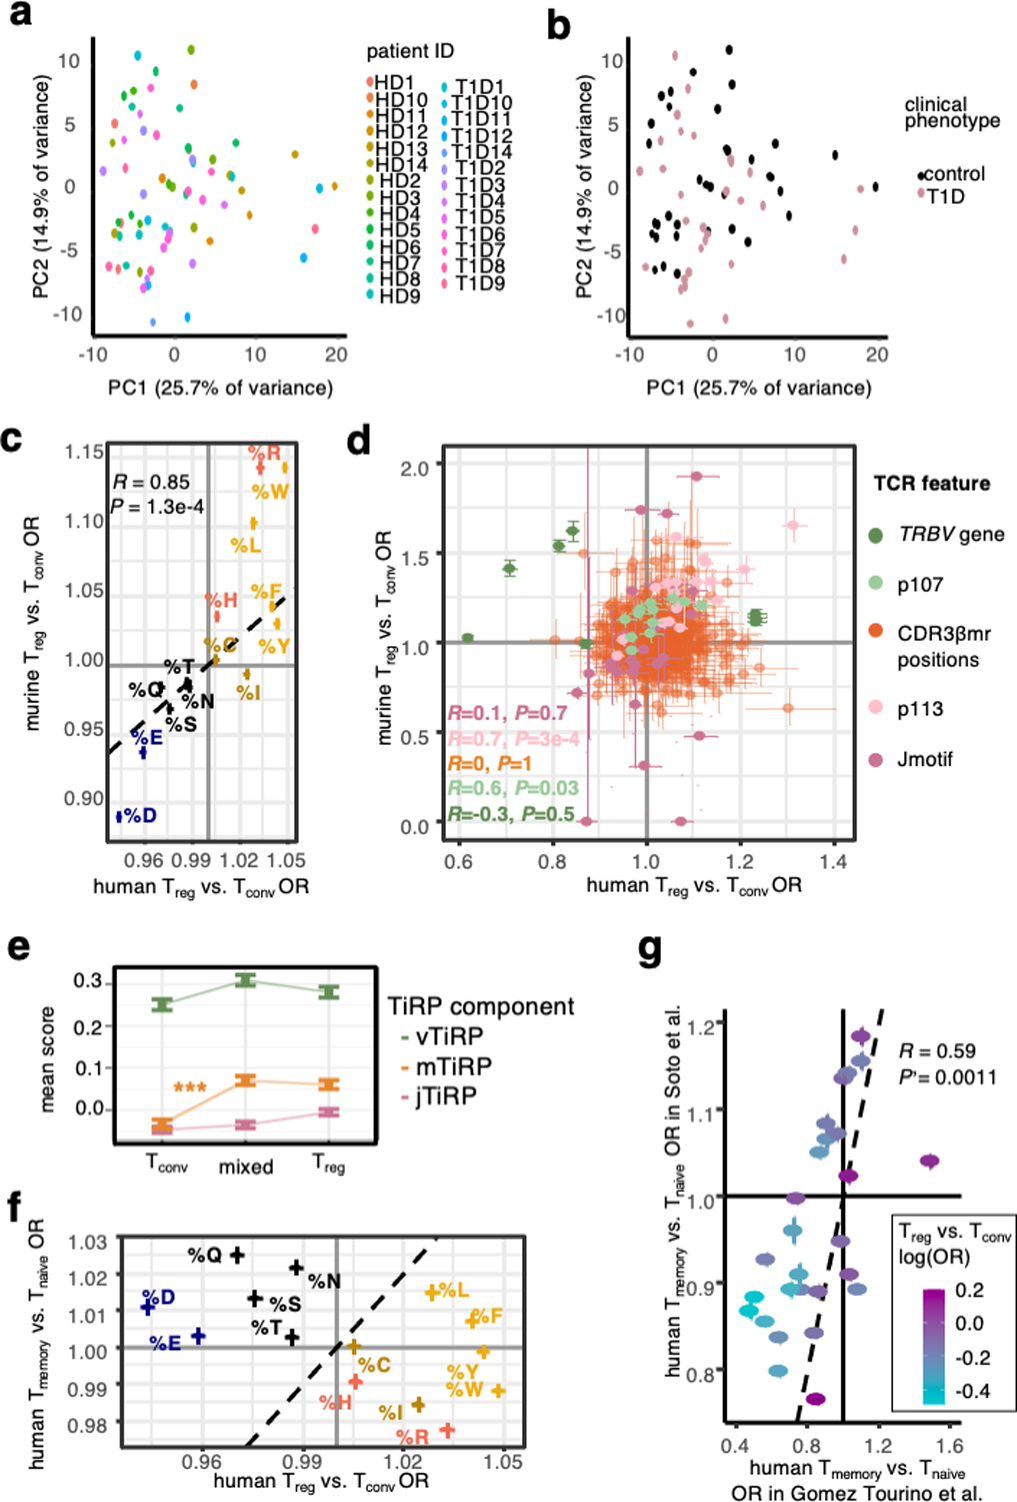
(a) 67 samples from the replication cohort colored by donor ID and arranged by principal component space according to variation in TCR sequence feature frequencies. (b) Same as (a), colored by donor clinical phenotype. (c) Replication of CDR3βmr percent composition of amino acid effects in mice. Error bars correspond to 95% confidence intervals for ORs. (d) Lack of mouse-human correspondence for position-specific TCR feature effects. TCR features are colored by type; error bars denote OR 95% confidence intervals. Murine TRBV genes were mapped to their human homologs for comparison, only those with a human homolog are shown (Methods). (e) Mean TiRP component scores for CD4+ expanded pure Tconv, pure Treg, and mixed clones in the tumor microenvironment15,16. Error bars denote standard error of the mean. Tconv mTiRP compared to mixed clone mTiRP two-sided Wald test P = 2.9 × 10⁻⁴, all other comparisons nonsignificant. (f) Overall lack of correspondence between Treg-Tconv OR and memory-naïve OR for CDR3βmr percent composition of amino acids. Error bars correspond to 95% confidence intervals, and amino acids are colored by the scheme in (c). (g) Replication of memory Tconv – naive Tconv TRBV gene odds ratios in an independent dataset of sorted memory and naïve T cells from 4 healthy donors31. TRBV genes are colored by their Treg-Tconv odds ratios. For (c), (d), (f), and (h), R = Pearson’s correlation coefficient and P values are computed by a two-sided t-test with Fischer transformation. For (e)-(g), human Treg-Tconv OR result from fixed-effect meta-analysis across the discovery and replication cohorts.
Extended Data Fig. 10: TiRP scoring of autoreactive T cell receptors.
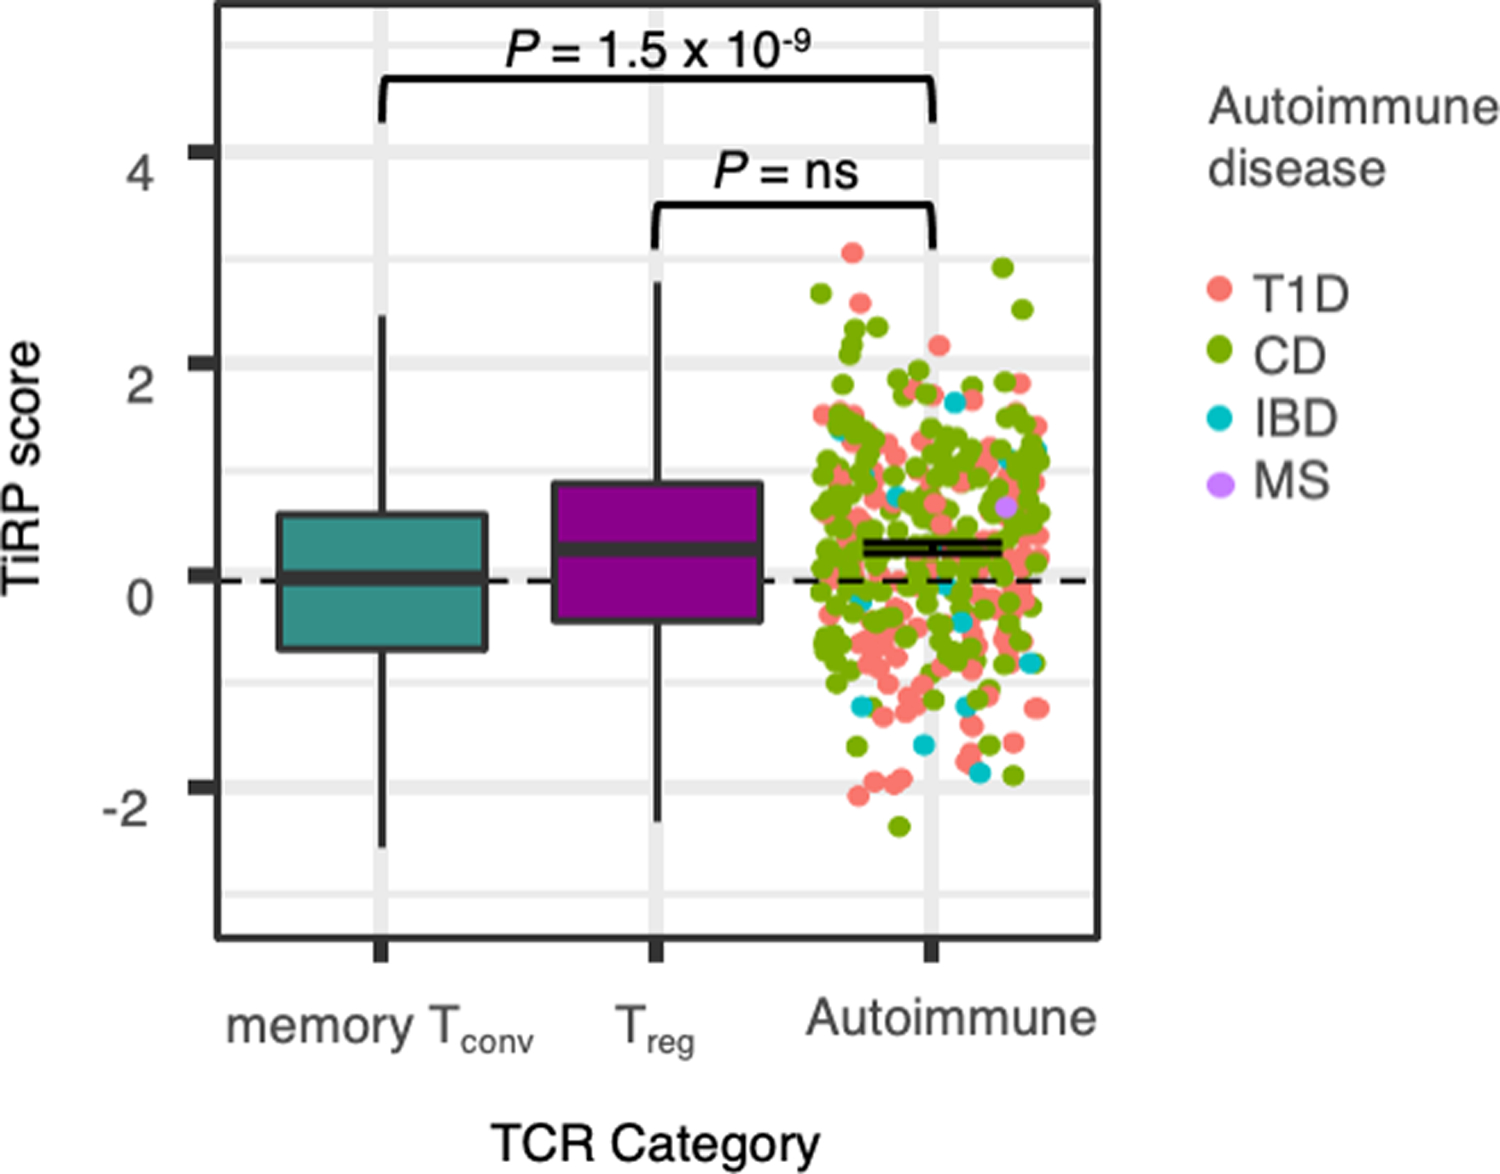
TiRP scores of McPAS and VDJdb autoimmune TCRs (points) compared to memory Tconvs and Tregs from the replication dataset held out for testing (boxplots). Each point in the autoimmune category represents one TCR from McPAS or VDJdb. Error bar denotes standard error of the mean TiRP for autoreactive TCRs, which is higher than reference memory Tconvs (P = 1.5 × 10⁻⁹, two-sided Wald test), but not significantly different from reference Tregs (P = 0.43, two-sided Wald test). Within each boxplot, the horizontal lines reflect the median, the top and bottom of each box reflect the interquartile range (IQR), and the whiskers reflect the maximum and minimum values within each grouping no further than 1.5 × IQR from the hinge.
T1D = Type 1 Diabetes
CD = Celiac Disease
IBD = Inflammatory Bowel Disease
MS = Multiple Sclerosis
Supplementary Material
Acknowledgments
We thank Michael B. Brenner for helpful scientific conversations regarding this work.
K.A. Lagattuta and J.B. Kang are each supported by award number T32GM007753 from the National Institute of General Medical Sciences.
A. Nathan is supported by award number T32AR007530 from the National Institute of Arthritis and Musculoskeletal and Skin Diseases.
D.A. Rao is supported by NIH NIAMS K08 AR072791 and a Career Award for Medical Sciences from the Burroughs Wellcome Fund.
A.H. Sharpe is supported by NIH P01 AI039671, P01 CA236749, and P01 AI108545.
SR is supported by the National Institutes of Health (NIH) grants U19-AI111224-01, P01AI148102-01A1, U01-HG009379-04S1, 1R01AR063759 and UH2-AR067677.
Footnotes
Competing interests statement
The authors declare no competing interests.
Code availability
Custom analysis scripts are available on GitHub (https://github.com/immunogenomics/TiRP)
Data availability
Data analyzed in this study were previously deposited in the following locations:
immuneACCESS
DOI: https://doi.org/10.21417/B73S3K
DOI: https://doi.org/10.21417/B7C88S
DOI: https://doi.org/10.21417/AMT2019EJI
DOI: https://doi.org/10.21417/CS2020CR
DOI: https://doi.org/10.21417/B7001Z
Gene Expression Omnibus (GEO)
Github
URL: https://github.com/aleksobrad/humanized-mouse-data
Zenodo
DOI: https://doi.org/10.5281/zenodo.3711134
ArrayExpress
E-MTAB-8581
10X Genomics
URL: https://cf.10xgenomics.com/supp/cell-exp/refdata-gex-GRCh38-2020-A.tar.gz
McPAS-TCR
URL: http://friedmanlab.weizmann.ac.il/McPAS-TCR
VDJdb
References
- 1.Jordan MS et al. Thymic selection of CD4+CD25+ regulatory T cells induced by an agonist self-peptide. Nat. Immunol. 2, 301–306 (2001). [DOI] [PubMed] [Google Scholar]
- 2.Yun TJ & Bevan MJ The Goldilocks conditions applied to T cell development. Nature immunology vol. 2 13–14 (2001). [DOI] [PubMed] [Google Scholar]
- 3.Sakaguchi S, Yamaguchi T, Nomura T & Ono M Regulatory T cells and immune tolerance. Cell 133, 775–787 (2008). [DOI] [PubMed] [Google Scholar]
- 4.Klein L, Hinterberger M, Wirnsberger G & Kyewski B Antigen presentation in the thymus for positive selection and central tolerance induction. Nat. Rev. Immunol. 9, 833–844 (2009). [DOI] [PubMed] [Google Scholar]
- 5.Romagnoli P & van Meerwijk JPM Thymic Selection and Lineage Commitment of CD4+Foxp3+ Regulatory T Lymphocytes. in Progress in Molecular Biology and Translational Science (ed. Liston A) vol. 92 251–277 (Academic Press, 2010). [DOI] [PubMed] [Google Scholar]
- 6.Moran AE et al. T cell receptor signal strength in Treg and iNKT cell development demonstrated by a novel fluorescent reporter mouse. J. Exp. Med. 208, 1279–1289 (2011). [DOI] [PMC free article] [PubMed] [Google Scholar]
- 7.Ohkura N et al. T cell receptor stimulation-induced epigenetic changes and Foxp3 expression are independent and complementary events required for Treg cell development. Immunity 37, 785–799 (2012). [DOI] [PubMed] [Google Scholar]
- 8.Li MO & Rudensky AY T cell receptor signalling in the control of regulatory T cell differentiation and function. Nat. Rev. Immunol. 16, 220–233 (2016). [DOI] [PMC free article] [PubMed] [Google Scholar]
- 9.Sidwell T et al. Attenuation of TCR-induced transcription by Bach2 controls regulatory T cell differentiation and homeostasis. Nat. Commun. 11, 252 (2020). [DOI] [PMC free article] [PubMed] [Google Scholar]
- 10.Bolotin DA et al. Antigen receptor repertoire profiling from RNA-seq data. Nat. Biotechnol. 35, 908–911 (2017). [DOI] [PMC free article] [PubMed] [Google Scholar]
- 11.Seay HR et al. Tissue distribution and clonal diversity of the T and B cell repertoire in type 1 diabetes. JCI Insight 1, e88242 (2016). [DOI] [PMC free article] [PubMed] [Google Scholar]
- 12.Gomez-Tourino I, Kamra Y, Baptista R, Lorenc A & Peakman M T cell receptor β-chains display abnormal shortening and repertoire sharing in type 1 diabetes. Nat. Commun. 8, 1792 (2017). [DOI] [PMC free article] [PubMed] [Google Scholar]
- 13.Park J-E et al. A cell atlas of human thymic development defines T cell repertoire formation. Science 367, (2020). [DOI] [PMC free article] [PubMed] [Google Scholar]
- 14.Khosravi-Maharlooei M et al. Cross-reactive public TCR sequences undergo positive selection in the human thymic repertoire. J. Clin. Invest. 129, 2446–2462 (2019). [DOI] [PMC free article] [PubMed] [Google Scholar]
- 15.Sharon E et al. Genetic variation in MHC proteins is associated with T cell receptor expression biases. Nat. Genet. 48, 995–1002 (2016). [DOI] [PMC free article] [PubMed] [Google Scholar]
- 16.Reche PA & Reinherz EL Sequence variability analysis of human class I and class II MHC molecules: functional and structural correlates of amino acid polymorphisms. J. Mol. Biol. 331, 623–641 (2003). [DOI] [PubMed] [Google Scholar]
- 17.Stadinski BD et al. Hydrophobic CDR3 residues promote the development of self-reactive T cells. Nat. Immunol. 17, 946–955 (2016). [DOI] [PMC free article] [PubMed] [Google Scholar]
- 18.Azizi E et al. Single-Cell Map of Diverse Immune Phenotypes in the Breast Tumor Microenvironment. Cell 174, 1293–1308.e36 (2018). [DOI] [PMC free article] [PubMed] [Google Scholar]
- 19.Yost KE et al. Clonal replacement of tumor-specific T cells following PD-1 blockade. Nat. Med. 25, 1251–1259 (2019). [DOI] [PMC free article] [PubMed] [Google Scholar]
- 20.Samstein RM, Josefowicz SZ, Arvey A, Treuting PM & Rudensky AY Extrathymic generation of regulatory T cells in placental mammals mitigates maternal-fetal conflict. Cell 150, 29–38 (2012). [DOI] [PMC free article] [PubMed] [Google Scholar]
- 21.Cebula A et al. Thymus-derived regulatory T cells contribute to tolerance to commensal microbiota. Nature 497, 258–262 (2013). [DOI] [PMC free article] [PubMed] [Google Scholar]
- 22.Zhou X et al. Instability of the transcription factor Foxp3 leads to the generation of pathogenic memory T cells in vivo. Nat. Immunol. 10, 1000–1007 (2009). [DOI] [PMC free article] [PubMed] [Google Scholar]
- 23.Setoguchi R, Hori S, Takahashi T & Sakaguchi S Homeostatic maintenance of natural Foxp3(+) CD25(+) CD4(+) regulatory T cells by interleukin (IL)-2 and induction of autoimmune disease by IL-2 neutralization. J. Exp. Med. 201, 723–735 (2005). [DOI] [PMC free article] [PubMed] [Google Scholar]
- 24.Komatsu N et al. Pathogenic conversion of Foxp3+ T cells into TH17 cells in autoimmune arthritis. Nat. Med. 20, 62–68 (2014). [DOI] [PubMed] [Google Scholar]
- 25.Zemmour D et al. Single-cell gene expression reveals a landscape of regulatory T cell phenotypes shaped by the TCR. Nat. Immunol. 19, 291–301 (2018). [DOI] [PMC free article] [PubMed] [Google Scholar]
- 26.Kang JB et al. Efficient and precise single-cell reference atlas mapping with Symphony. Nat. Commun. 12, 5890 (2021). [DOI] [PMC free article] [PubMed] [Google Scholar]
- 27.Nathan A et al. Multimodally profiling memory T cells from a tuberculosis cohort identifies cell state associations with demographics, environment and disease. Nat. Immunol. 22, 781–793 (2021). [DOI] [PMC free article] [PubMed] [Google Scholar]
- 28.Jorgensen JL, Esser U, Fazekas de St Groth B, Reay PA & Davis MM Mapping T-cell receptor-peptide contacts by variant peptide immunization of single-chain transgenics. Nature 355, 224–230 (1992). [DOI] [PubMed] [Google Scholar]
- 29.Garcia KC et al. An alphabeta T cell receptor structure at 2.5 A and its orientation in the TCR-MHC complex. Science 274, 209–219 (1996). [DOI] [PubMed] [Google Scholar]
- 30.Thornton AM et al. Helios+ and Helios- Treg subpopulations are phenotypically and functionally distinct and express dissimilar TCR repertoires. Eur. J. Immunol. 49, 398–412 (2019). [DOI] [PMC free article] [PubMed] [Google Scholar]
- 31.Soto C et al. High Frequency of Shared Clonotypes in Human T Cell Receptor Repertoires. Cell Rep. 32, 107882 (2020). [DOI] [PMC free article] [PubMed] [Google Scholar]
- 32.Tickotsky N, Sagiv T, Prilusky J, Shifrut E & Friedman N McPAS-TCR: a manually curated catalogue of pathology-associated T cell receptor sequences. Bioinformatics 33, 2924–2929 (2017). [DOI] [PubMed] [Google Scholar]
- 33.Shugay M et al. VDJdb: a curated database of T-cell receptor sequences with known antigen specificity. Nucleic Acids Res. 46, D419–D427 (2018). [DOI] [PMC free article] [PubMed] [Google Scholar]
- 34.Lee YK, Mukasa R, Hatton RD & Weaver CT Developmental plasticity of Th17 and Treg cells. Curr. Opin. Immunol. 21, 274–280 (2009). [DOI] [PubMed] [Google Scholar]
- 35.Daley SR et al. Cysteine and hydrophobic residues in CDR3 serve as distinct T-cell self-reactivity indices. J. Allergy Clin. Immunol. 144, 333–336 (2019). [DOI] [PMC free article] [PubMed] [Google Scholar]
- 36.Košmrlj A, Jha AK, Huseby ES, Kardar M & Chakraborty AK How the thymus designs antigen-specific and self-tolerant T cell receptor sequences. Proc. Natl. Acad. Sci. U. S. A. 105, 16671–16676 (2008). [DOI] [PMC free article] [PubMed] [Google Scholar]
- 37.Miyazawa S & Jernigan RL Estimation of effective interresidue contact energies from protein crystal structures: quasi-chemical approximation. Macromolecules 18, 534–552 (1985). [Google Scholar]
Methods References
- 38.Witten IH, Frank E, Hall MA, Pal CJ & Data M Practical machine learning tools and techniques. in DATA MINING vol. 2 4 (2005). [Google Scholar]
- 39.Shannon CE & Weaver W The Mathematical Theory of Communication. (University of Illinois Press, 1998). [Google Scholar]
- 40.Ihara S Information Theory for Continuous Systems. (World Scientific, 1993). [Google Scholar]
- 41.Zarembka P & Harcourt Brace & Company (1993–1999). Frontiers in Econometrics. (Academic Press, 1974). [Google Scholar]
- 42.Fox J & Monette G Generalized Collinearity Diagnostics. J. Am. Stat. Assoc. 87, 178–183 (1992). [Google Scholar]
- 43.Wimley WC & White SH Experimentally determined hydrophobicity scale for proteins at membrane interfaces. Nat. Struct. Biol. 3, 842–848 (1996). [DOI] [PubMed] [Google Scholar]
- 44.Hdbk of chemistry & physics 72nd edition. (CRC Press, 1991). [Google Scholar]
- 45.Zamyatnin AA Protein volume in solution. Prog. Biophys. Mol. Biol. 24, 107–123 (1972). [DOI] [PubMed] [Google Scholar]
- 46.Korsunsky I et al. Fast, sensitive and accurate integration of single-cell data with Harmony. Nat. Methods 16, 1289–1296 (2019). [DOI] [PMC free article] [PubMed] [Google Scholar]
- 47.Schuldt NJ & Binstadt BA Dual TCR T Cells: Identity Crisis or Multitaskers? J. Immunol. 202, 637–644 (2019). [DOI] [PMC free article] [PubMed] [Google Scholar]
Associated Data
This section collects any data citations, data availability statements, or supplementary materials included in this article.
Supplementary Materials
Data Availability Statement
Data analyzed in this study were previously deposited in the following locations:
immuneACCESS
DOI: https://doi.org/10.21417/B73S3K
DOI: https://doi.org/10.21417/B7C88S
DOI: https://doi.org/10.21417/AMT2019EJI
DOI: https://doi.org/10.21417/CS2020CR
DOI: https://doi.org/10.21417/B7001Z
Gene Expression Omnibus (GEO)
Github
URL: https://github.com/aleksobrad/humanized-mouse-data
Zenodo
DOI: https://doi.org/10.5281/zenodo.3711134
ArrayExpress
E-MTAB-8581
10X Genomics
URL: https://cf.10xgenomics.com/supp/cell-exp/refdata-gex-GRCh38-2020-A.tar.gz
McPAS-TCR
URL: http://friedmanlab.weizmann.ac.il/McPAS-TCR
VDJdb


