

Abstract
Isocitrate dehydrogenase 1 mutations (mIDH1) are common in cholangiocarcinoma. (R)-2-hydroxyglutarate generated by the mIDH1 enzyme inhibits multiple α-ketoglutarate-dependent enzymes, altering epigenetics and metabolism. Here, by developing mIDH1-driven genetically engineered mouse models, we show that mIDH1 supports cholangiocarcinoma tumor maintenance through an immunoevasion program centered on dual (R)-2-hydroxyglutarate-mediated mechanisms — suppression of CD8+ T cell activity and tumor cell-autonomous inactivation of TET2 DNA demethylase. Pharmacological mIDH1 inhibition stimulates CD8+ T cell recruitment and IFN-γ expression and promotes TET2-dependent induction of IFN-γ response genes in tumor cells. CD8+ T cell depletion or tumor cell-specific ablation of TET2 or Interferon-gamma receptor 1 causes treatment resistance. Whereas immune checkpoint activation limits mIDH1 inhibitor efficacy, CTLA4 blockade overcomes immunosuppression, providing therapeutic synergy. The findings in this mouse model of cholangiocarcinoma demonstrate that immune function and the IFN-γ-TET2 axis are essential for response to mIDH1 inhibition and suggest a novel strategy for harnessing these inhibitors therapeutically.
Introduction
IDH1 is the most commonly mutated metabolic gene across human cancers, with highest mutational frequency observed in AML, glioma, chondrosarcoma, and intrahepatic cholangiocarcinoma (ICC; cancer of liver bile ducts) (1–4). Mutations of the hot spot R132 codon alter the activity of the IDH1 enzyme, resulting in the NADPH-dependent conversion of α-ketoglutarate to (R)-2-hydroxyglutarate [(R)-2HG], which accumulates to mM levels within tumors (5,6). (R)-2HG competitively inhibits a range of enzymes that utilize α-ketoglutarate (7–9) Targets include the JmjC family histone demethylases and TET family DNA demethylases (2,8,10) whose inhibition is linked to the altered epigenetic state characteristic of many mIDH tumors. Additional (R)-2HG targets participate in diverse biological processes, including amino acid and RNA metabolism (BCAT transaminases) (11), collagen maturation (12), DNA repair (13,14), mTOR signaling (15), and hypoxic response (16). (R)-2HG has also been implicated in immunosuppression via both transcriptional control of cytokine production in tumor cells and direct, paracrine effects of secreted (R)-2HG on various immune cell types (17–20). Since cancer-associated mutational variants at IDH1-R132 differ markedly in their (R)-2HG generating activity (5,21–23), and since the reported inhibitory values for candidate targets span a wide (R)-2HG concentration range (8,9), there may be significant context-specificity to the outputs of mutant IDH. Overall, the pleiotropic effects of (R)-2HG have complicated the elucidation of the molecular targets and resulting biological processes by which mIDH drives tumor initiation and potentially contributes to maintenance of advanced tumors in different tissues.
Pharmacological inhibition of mIDH in human cancers has shown variable efficacy whose mechanistic basis requires further study. In AML, the requirement for mIDH in sustained tumor growth is well established and selective small molecule mIDH1 and mIDH2 inhibitors have received regulatory approval in this setting (24). The frequent complete remissions upon mIDH inhibitor treatment and acquisition of secondary IDH mutations as a clinical resistance mechanism highlight the oncogene addiction phenotype driven by mIDH in AML (25). Responses are associated with differentiation of the leukemic stem cells to mature myeloid cells, pointing to mIDH inhibition as a form of differentiation-based therapy (26–28). mIDH has also been shown to influence cell fate decisions in multiple additional tissues, including the liver (23,29–31). However, the functions of mIDH in the maintenance of ICC and other solid tumors remain unclear. While mIDH1 inhibition provides clinical benefit for ICC and glioma patients, this strategy typically delays progression rather than significantly shrinking tumors, and the efficacy is often short-lived (32–34). Moreover, mIDH inhibition has not produced consistent or robust responses in different solid tumor model systems, and several studies report that the mutant IDH allele is selectively lost upon malignant progression or limits initial tumor growth (35–38). In this regard, (R)-2HG has been shown to suppress DNA repair and promote genomic instability, effects consistent with greater impact on tumor initiation than maintenance. These observations have motivated the search for alternative therapeutic strategies, which, rather than inhibiting the mutant enzyme, harness the alterations in cellular circuitry resulting from high (R)-2HG levels (11,39–44)
A potential limitation of prior experimental studies on the roles of mIDH in the sustained growth of advanced solid malignancies relates to the available model systems—including xenografts and cell line or spheroid models as well as engineered cancer models in which ectopic mIDH1 expression does not contribute to tumor initiation — which may not fully recapitulate relevant biological features of native tumors. Here, we report the generation of GEM models to probe the functions of mutant IDH1 in ICC pathogenesis. Using a GEMM where mutant IDH1 strongly promotes development of ICC and associated allografts models, we establish a central (R)-2HG-controlled pathway coordinating epigenetic reprogramming and immune escape, whose inhibition potentiates responsiveness to immunotherapy.
Results
Selective induction of murine ICC by the high (R)-2HG-producing Idh1R132C allele
The profile of mutational variants at the hotspot IDH1 R132 codon differs across human cancer types, with R132C representing >70% of mIDH1 ICCs compared to R132H, which has <1% incidence in ICC but is prevalent in glioma (Figure 1A). To assess the capacity of these mIDH1 variants to promote ICC in genetically engineered mice, we developed latent knock-in alleles of both Idh1R132H and Idh1R132C in which expression of the mutant alleles from the endogenous locus is controlled by a floxed stop cassette (Figure 1B; Supplementary Figure S1A; Methods). These strains were crossed to Alb-Cre transgenic mice to generate animals with liver-specific activation of mutant IDH1, designated C (Alb-Cre), CIR132C (Alb-Cre; Idh1R132C), and CIR132H (Alb-Cre; Idh1R132H) cohorts. The compound mutant mice were born at the expected Mendelian frequency and without overt pathology. Examination of livers at 11 weeks confirmed that (R)-2HG concentrations were markedly elevated upon mIDH1 expression, with particularly high levels produced by the Idh1R132C allele (median concentration of (R)-2HG: C: 0.07 nmol/mg; CIR132H: 7.8 nmol/mg; CIR132C: 35.3 nmol/mg) (Supplementary Figure S1B).
Figure 1. Development of an IDH1-R132C-driven GEMM of ICC.
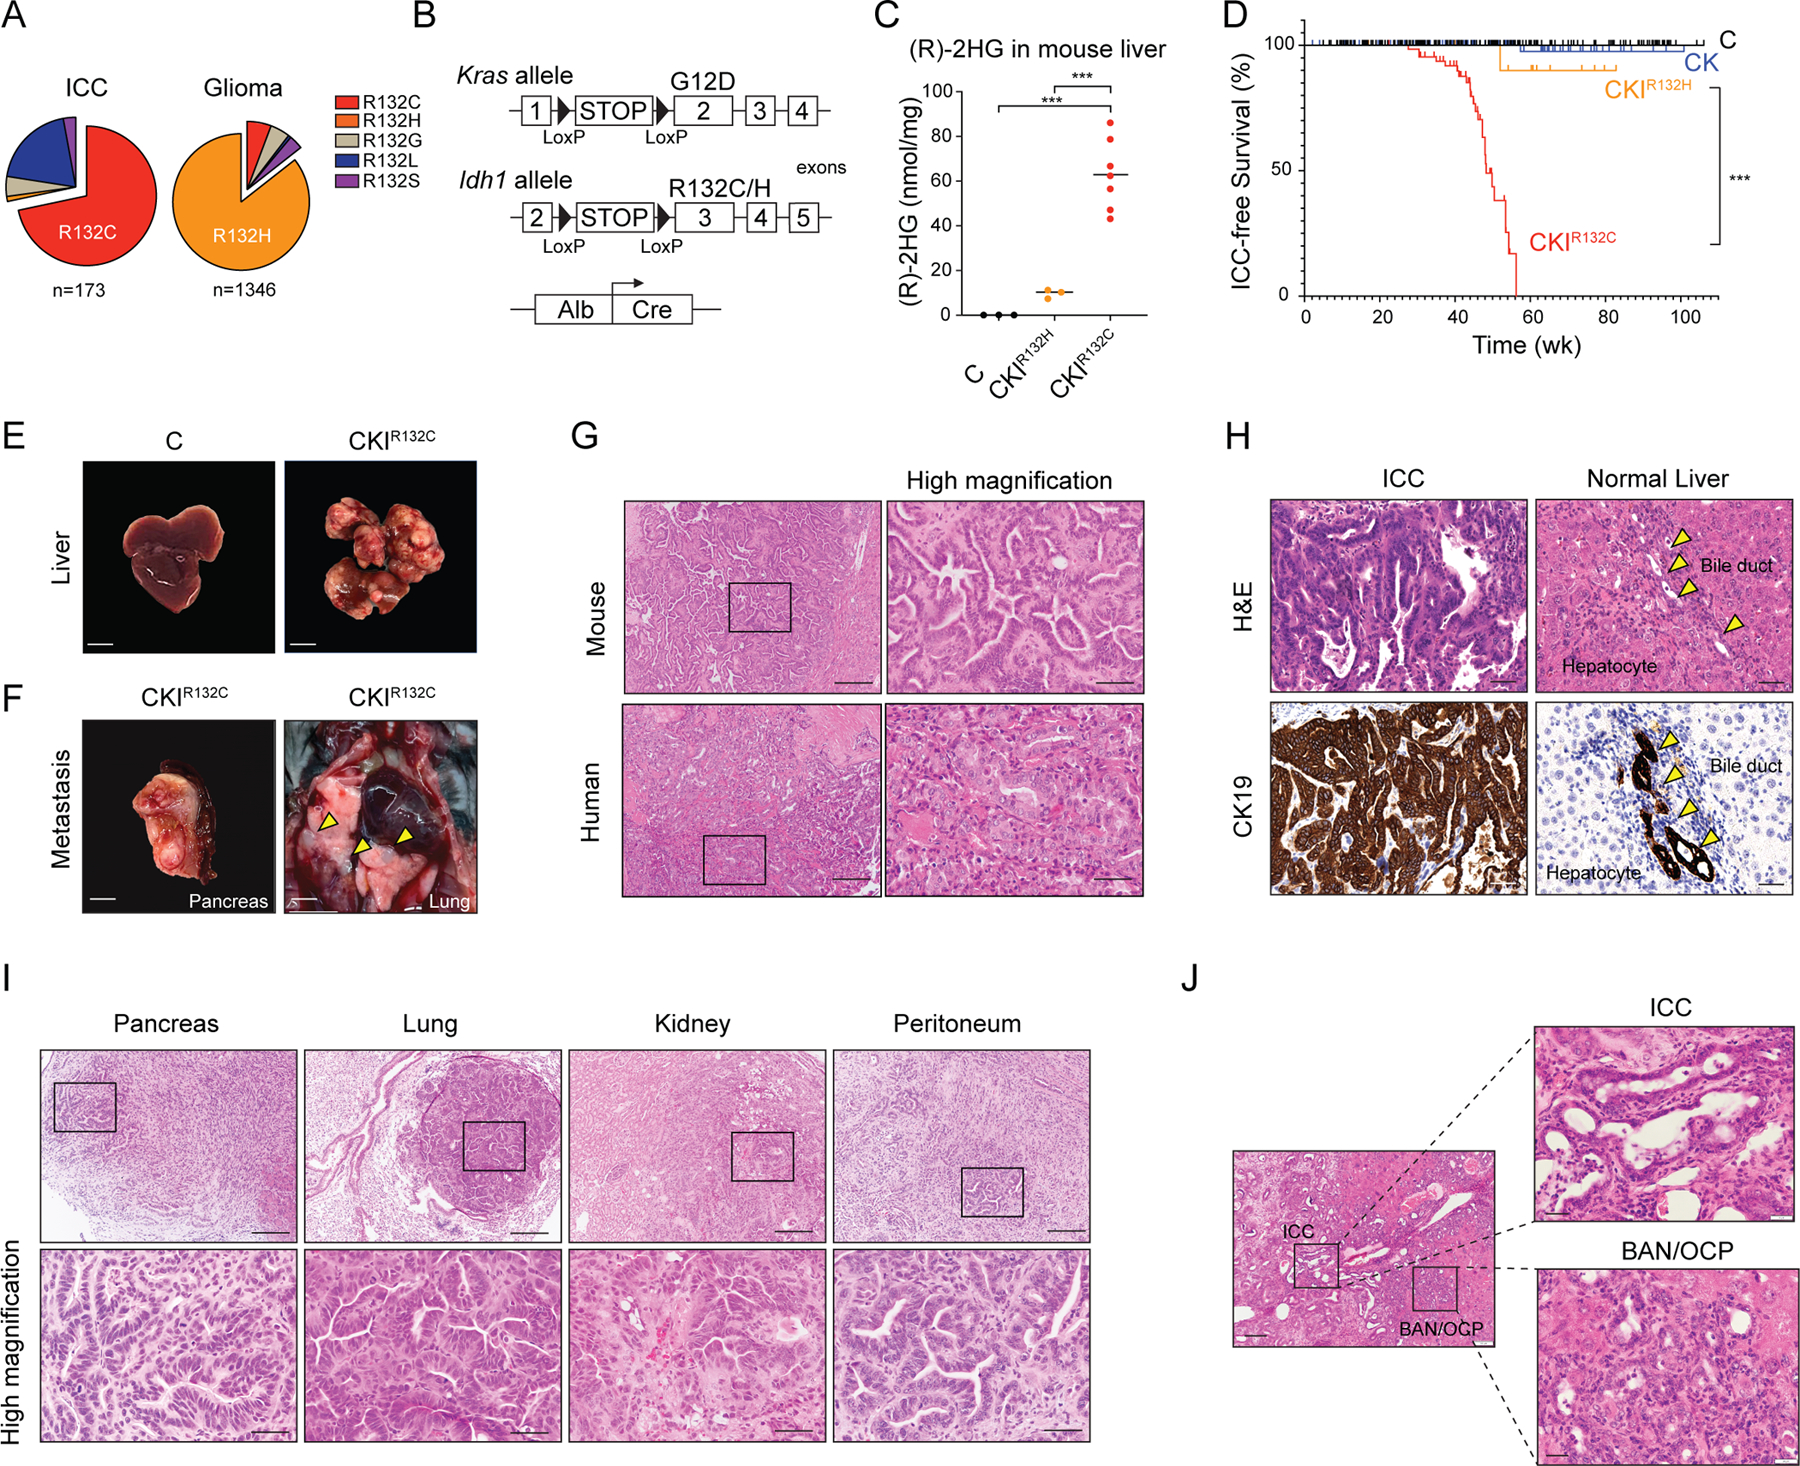
(A) Relative frequency of IDH1 mutant variants in human ICC and glioma (data obtained from AACR Project GENIE). (B) Schematic of mouse strains. (C) Concentration of (R)-2HG in livers from mice with the indicated genotypes at 11 weeks of age detected by colorimetric (R)-2HG assay kit. C: N=3; CKIR132H: N = 3; CKIR132C: N = 7 (N represents mouse numbers). (D) Kaplan-Meier analysis for time until ICC tumor progression necessitated euthanasia. C: N = 263; CK: N = 125; CKIR132H: N = 18; CKIR132C: N = 108 (N represents mouse numbers). Kaplan-Meier curves were analyzed by log-rank test. ***P < 0.001 was considered statistically significant. (E) Representative photographs depicting livers from 43-week-old mice of the indicated genotypes. (F) Representative gross photographs of metastatic tumors from CKIR132C mice. (G) Representative H&E-stained section of ICC from a CKIR132C mouse (top panels) and a human mIDH1 ICC shown for comparison (lower panels). (H) Tissue sections of ICC and adjacent normal liver from a representative CKIR132C mouse subjected to H&E staining (top panels) and IHC staining against CK19 (lower panels). (I) H&E-stained sections from CKIR132C mice revealing metastatic spread of ICC to the indicated tissues. Lower panels show higher magnification. (J) H&E-stained sections of precursor biliary adenomatous neoplasia (BAN) and oval cell proliferation (OCP) from CKIR132C mice at 35 weeks. The boxed regions in left panel are shown in higher magnification in the right panels. Scale bars: 1 cm (E), 2mm (F), 200 μm (I, upper panels), 100 μm (J, left panel), 50 μm (H; I, bottom panels, 20 μm (J, right panel).
Since IDH1 mutations co-exist with activating genetic alterations in different RTK-RAS-MEK pathway genes in ~28 % of human ICCs — with KRAS mutations most common (Supplementary Figure S1C; data accessed from www.cbioportal.org/genie/)(45–47) — we intercrossed the above strains with LSL-KrasG12D mice (Figure 1B) to establish CK (Alb-Cre; KrasG12D), CKIR132H (Alb-Cre; KrasG12D; Idh1R132H) and CKIR132C (Alb-Cre; KrasG12D; Idh1R132C) cohorts. As seen in the single mutant strains, Idh1R132C produced much greater levels of hepatic (R)-2HG than Idh1R132H in the context of KrasG12D (Figure 1C). Longitudinal monitoring of these animals revealed pronounced cooperativity between Idh1R132C and KrasG12D in promoting aggressive ICC. CKIR132C mice developed poor body condition and palpable liver masses requiring euthanasia between 27 and 54 weeks (median tumor-free survival: 49.3 weeks) (Figure 1D; Supplementary Figure S1D–E). Necropsy demonstrated multifocal liver tumors (Figure 1E) with pancreatic, lung, kidney and/or peritoneal metastases observed in 20.4% of mice (Figure 1F; Supplementary Figure S1F). Histopathologic analysis and CK19 staining established ICC with similar morphological features to human mIDH1 ICC as the main tumor phenotype in 68.5% of the animals, with the rest typically showing foci of ICC against the backdrop of HCC histology (Figure 1G and H; Supplementary Figure S1G, S2A–D); all metastases had ICC histology (Figure 1I; Supplementary Figure 1F). By contrast, most CK, CIR132C, and CIR132H mice remained tumor-free for >90 weeks and, when tumors were observed, exhibited HCC features as the predominant malignant phenotype with minor presence of ICC (of tumor-bearing CK, CIR132C, and CIR132H mice, 6.9%, 0%, and 0% showed mainly ICC pathology, respectively) (Supplementary Figure S1D, S1G and S2D). In addition, hepatomegaly was common and eventually necessitated euthanasia of subsets of these animals without evidence of neoplasia. CKIR132H mice exhibited intermediate features, with a tumor-free survival of 60.2 weeks, and a phenotype dominated by HCC (92.3% of tumor-bearing mice) with very rare presence of frank ICC (7.7% of mice) (Figure 1D; Supplementary Figure S1G and S2B). Unlike the CKIR132C cohort, metastases were not observed in any of the other genotypes (Supplementary Figure S1F). Serial analysis of mice at time points prior to clinical evidence of disease reinforced the selective capacity of IDH1R132C to incite ICC development, with CKIR132C livers exhibiting biliary atypia (oval cell proliferation; OCP) and precursor lesions (biliary adenomatous neoplasia, BAN), contiguous with incipient ICC (Figure 1J). Collectively, these results demonstrate a specific and potent role of IDH1R132C in driving invasive and metastatic ICC in a GEM model that effectively recapitulates the histopathogenesis of the human disease. The distinct ability of IDH1R132C to promote ICC compared to IDH1R132H is in accord with the relative frequencies of these alleles in human ICC, indicating cross-species conservation of tumorigenic mechanisms, and suggesting a requirement for the very high (R)-2HG levels generated by IDH1R132C to elicit ICC development.
mIDH1 inhibition stimulates IFN response and requires intact immune function for efficacy
In order to have a tractable system to study the functions of mutant IDH1 in the growth of advanced ICC, we established multiple independent primary ICC cell cultures from the CKIR132C GEM model (Supplementary Figure S3A). We confirmed that these cell lines produced greatly elevated levels of 2HG as compared to ICC cell lines derived from a separate GEM model that harbors wildtype IDH alleles (Alb-Cre; KrasG12D; p53flox/+ [CKP]) (48) (Supplementary Figure S3B). Subcutaneous or orthotopic (intrahepatic) injection of CKIR132C ICC cells into immune competent syngeneic animals resulted in allograft tumors with close histopathologic similarity to the tumors arising natively in the GEM model (Figure 2A–B).
Figure 2. mIDH1 inhibition in ICC activates IFN-γ signaling and requires intact immune function for therapeutic efficacy.
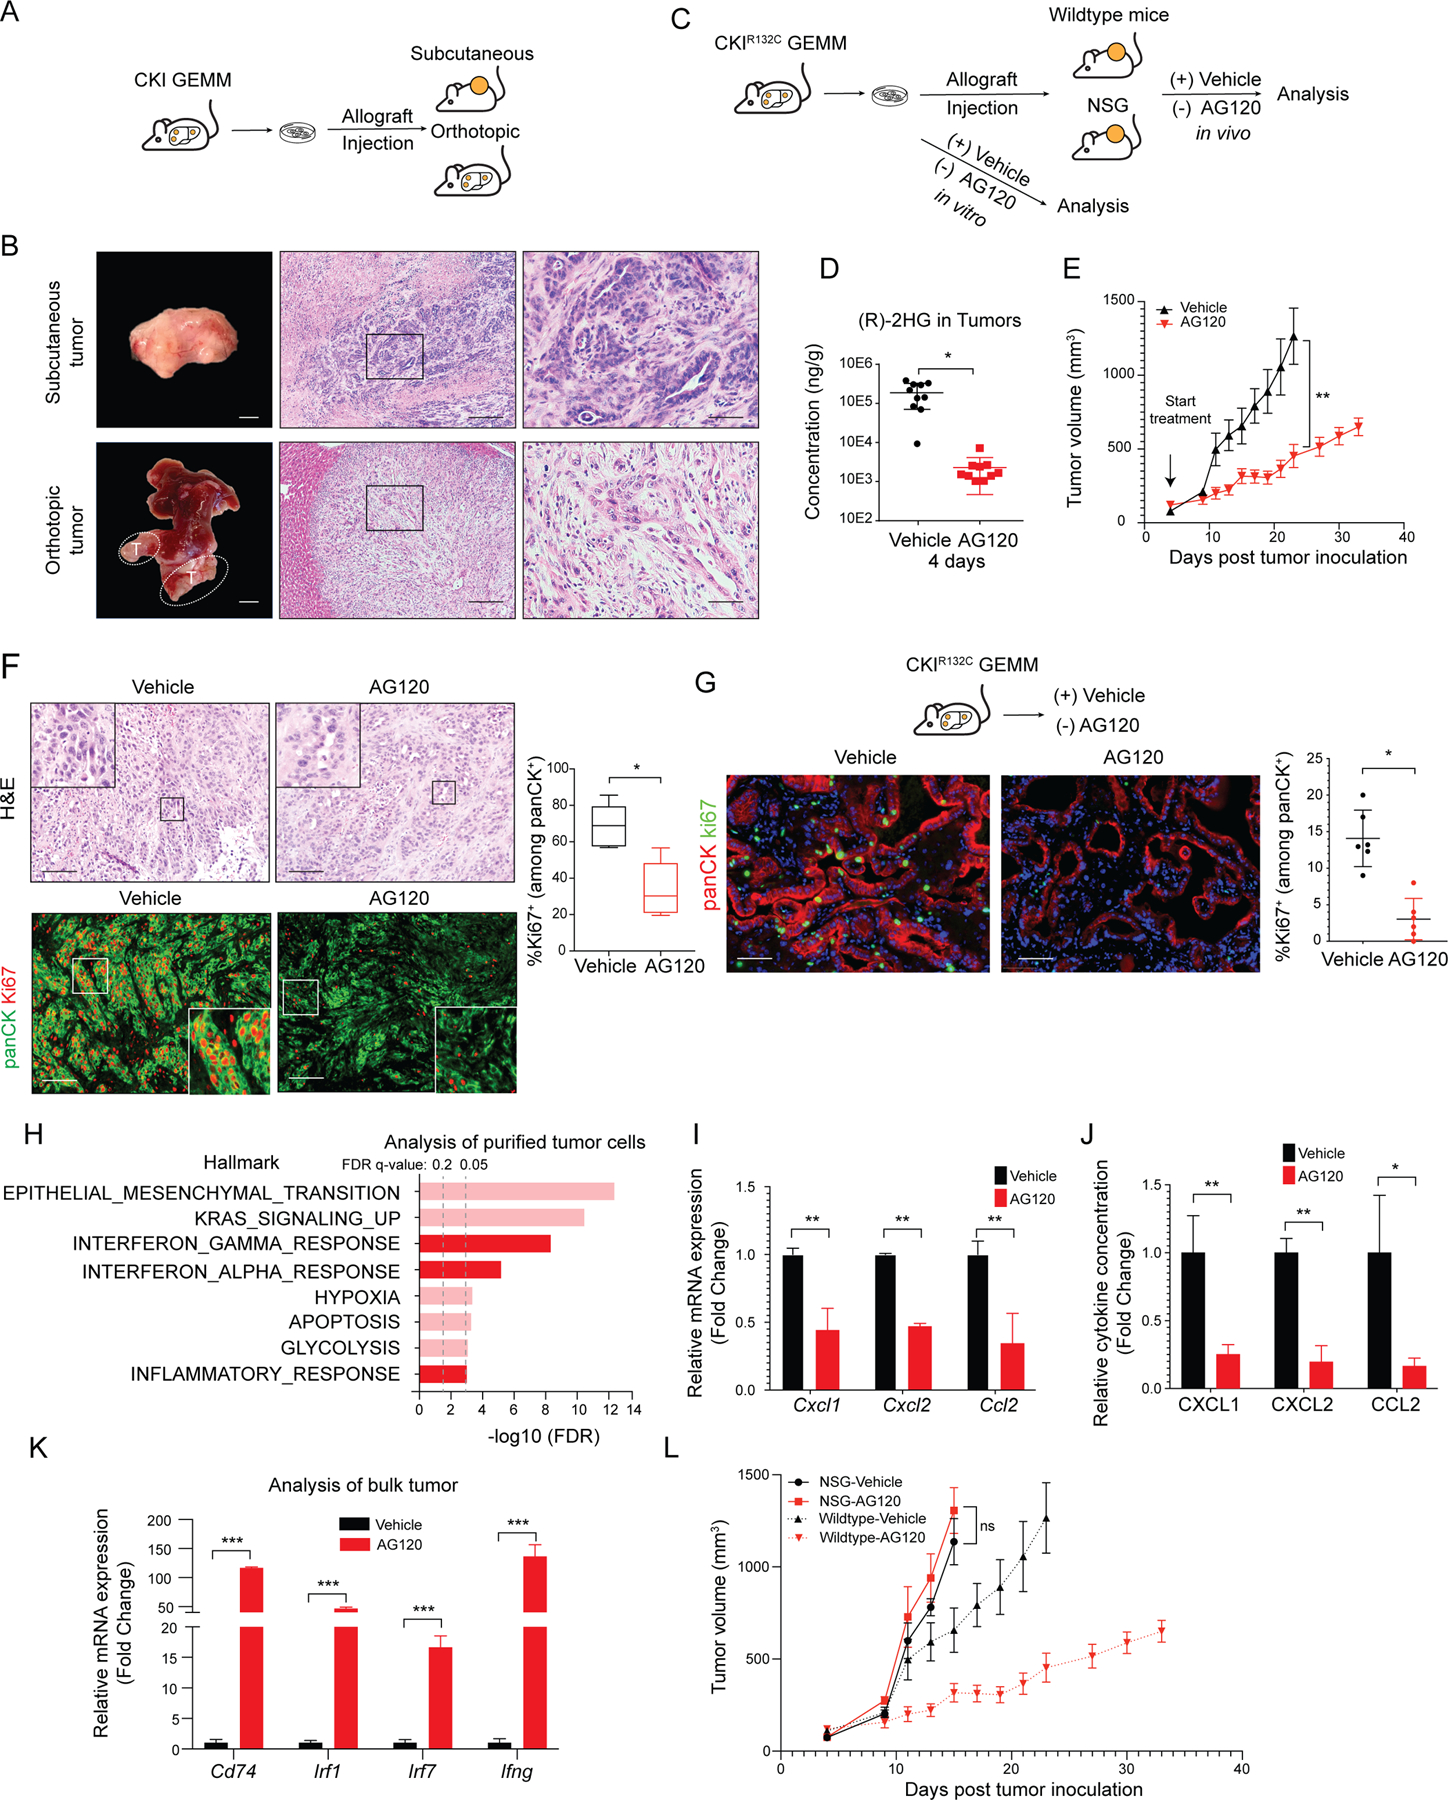
(A) Schematic of development of CKIR132C allograft tumor model. (B) Representative images of subcutaneous (upper panels) and orthotopic ICC allografts (lower panels). Left: gross photographs; middle: H&E staining. The boxed area is showed at higher magnification at the right. (C) Approach to studying the response to mIDH1 inhibition in vitro and in vivo. (D) LC-MS/MS measurement of relative level of (R)-2HG in ICCs collected 12 hours after the last dose of the 4-day treatment. Data represents mean ± SD. *P < 0.05; unpaired t-test. (E) Immunocompetent wildtype mice were injected subcutaneously with a CKIR132C primary cell line (2205). When tumors reached ~100 mm3 in volume, animals were randomized to receive AG120 or vehicle and then analyzed for serial changes in tumor volume. N = 10 mice per group. Data represent means ± SEM. ***P < 0.001; unpaired t-test. (F) Representative sections of tumors from mice treated with vehicle or AG120 for 7 days. Top panels: H&E staining. Bottom panels: Immunofluorescence for panCK (green), Ki67 (red). IF data are quantified in graph at the right and represent mean ± SD. *P < 0.05. (G) Upper: Schematic of treatment study against autochthonous ICCs arising in the CKIR132C GEM model. Bottom: Immunofluorescence staining for Ki67 (green), panCK (red), and DAPI (blue) in ICCs from CKIR132C mice after 6 days treatment with vehicle or AG120. Data are quantified at the right and represent mean ± SD. *P < 0.05; unpaired t-test. (H) GSEA comparing RNA-sequencing profiles of malignant cells (isolated by magnetic bead-mediated depletion of stromal populations) from subcutaneous allograft tumors from immunocompetent mice treated with AG120 and vehicle for 6 days. The vertical axis represents 8 top ranked pathways in the Hallmark database based on FDR q-values. Interferon and inflammatory pathways are highlighted in dark red. The horizontal axis represents -log10FDR of differentially expressed genes (DEGs) in each Hallmark term. (I) Cxcl1, Cxcl2 and Ccl2 mRNA levels in purified malignant cells from AG120-treated and vehicle-treated tumors. Transcript levels were measured as FPKM values by RNA-seq analysis. Data represents mean ± SD. **P < 0.01; unpaired t-test. (J) Bar graphs showing CXCL1, CXCL2 and CCL2 cytokine levels in the medium from tumor spheroids freshly prepared from CKIR132C allografts and cultured for 3 days in the presence of 1 μM AG120 or vehicle. The cytokine concentrations were measured by Luminex-based multiplex assays. Data represents mean ± SD; **P<0.01, *P<0.05; unpaired t-test. (K) Relative mRNA expression of the indicated genes in vehicle- and AG120-treated bulk (unsorted) tumors. mRNA expression was analyzed by two-step real-time RT-PCR. All data were normalized to Actb then to the geometric mean of vehicle-treated tumors. Data represents mean ± SD; ***P<0.001; unpaired t-test. (L) Immunodeficient mice (NSG mice) were injected subcutaneously with CKIR132C primary cell line. When tumors reached ~100 mm3 in volume, animals were randomized into AG120 (solid red line) and vehicle (solid black line) conditions and analyzed for serial changes in tumor volume. N = 10 mice per group. Data represent mean ± SEM; ns: not significant. Dashed lines are data from (E, above) depicting comparable studies using wildtype mice and shown for comparison. Scale bars: 1 cm (B, bottom left), 2 mm (B, upper left), 200 μm (B, middle panels), 100 μm (F), 50 μm (B, right panels; G).
We next used the ICC cell cultures and allografts to investigate the response to p ,.?harmacological inhibition of mIDH1 in vitro and in vivo (Figure 2C). Under standard in vitro culture conditions, CKIR132C ICC cells showed no change in viability upon treatment with the selective mIDH1 inhibitor, AG120 (1 μM), despite reducing (R)-2HG levels by 96% (Supplementary Figure S3C–D).
For in vivo studies, mice bearing tumors ~100 mm3 were administered 150 mg/kg AG120 twice/daily, which mimicked the pharmacokinetics and pharmacodynamics observed at the clinical dose in humans (49), including durable reduction in intratumoral (R)-2HG by 95% (Figure 2D and Supplementary Figure S3E–L). In contrast to the in vitro findings, AG120 treatment slowed growth in two independent subcutaneous allograft models (2205 and 2275–4) (Figure 2E and Supplementary Figure S3M). Analysis of tumor specimens after 7 days treatment revealed that AG120 decreased tumor cell proliferation significantly (%Ki-67+/panCK+ cells) (Figure 2F) and induced a degree of cell death (cleaved caspase-3, Supplementary Figure S3N). The observed disease stabilization rather than tumor regression is in line with the human clinical trial data (32,34). AG120 treatment did not affect tumor growth or proliferation of IDH wildtype ICC allografts (CKP model) (Supplementary Figure S3O), indicating that the responses seen in CKIR132C allografts were due to on-target inhibition of the mutant IDH1 enzyme. Efficacy was also seen in CKIR132C orthotopic allografts, in which AG120 treatment initiated following engraftment resulted in a 3–5-fold decrease in tumor volume compared to vehicle after 3 weeks, accompanied by marked reduction in tumor cell proliferation and increased cell death (Supplementary Figure S3P–R). Importantly, we observed comparable anti-tumor effects of AG120 against autochthonous ICCs arising in the CKIR132C GEM model. Based on the established kinetics of the model (Figure 1D–J), mice aged 42–45 weeks were examined for palpable abdominal tumors and then randomized to receive AG120 or vehicle (N=6/group). Analysis after six days revealed significantly lower levels of tumor cell proliferation upon AG120 treatment versus vehicle (3.0% ± 2.8% versus 14.1% ± 3.9%, respectively) (Figure 2G). Long-term monitoring of the allograft models demonstrated that AG120 extended survival, however, the tumors reached an inflection point after approximately 22 days of treatment and then progressed (Figure 2E; Supplementary Figure S3M). Thus, although mIDH1 activity is dispensable for the growth of CKIR132C ICC cells in vitro, it is important for tumor maintenance in vivo, since AG120 treatment provoked strong suppression of tumor cell proliferation despite the concurrent presence of the potent KrasG12D oncogene. Nevertheless, the gradual but consistent development of AG120-insensitivity suggests that adaptive changes eventually lead to mIDH1-independent ICC growth.
To gain insight into the mechanisms underlying the anti-tumor efficacy of AG120 we conducted RNA-sequencing (RNA-seq) analysis of purified tumor cells. For these studies, the immune-competent 2205 subcutaneous allograft model was treated with AG120 or vehicle for 6 days and non-tumor cells were removed by magnetic bead sorting (negative selection for CD45+ immune cells, CD31+ endothelial cells, TER119+ erythrocytes, and CD90.2+ fibroblasts). We used gene set enrichment analysis (GSEA) to query the differentially expressed genes against the “Hallmark” database as well as against a curated set of hepatocyte lineage genes, based on prior studies linking mIDH to liver fate decisions (23). Consistent with the paradigm that mIDH enforces a differentiation block in cancer cells and, correspondingly, that mIDH inhibition acts as a differentiation therapy, we observed increased expression of hepatocyte marker genes, including targets of the master transcriptional regulator of hepatocyte identity, HNF4α (Liver specific genes: NES=2.09, FDR q-value<0.001; Targets of HNF4α: NES=1.97, FDR q-value<0.001) (Supplementary Figure S3S and T). mIDH1 inhibition also led to a comparable or even more pronounced induction of the Interferon gamma (IFN-γ) transcriptional response signature (NES=2.43, FDR q-value<10−4) and other inflammatory signatures, which were among the most highly enriched pathways (Figure 2H). Concomitant with upregulation of interferon signatures upon mIDH1 inhibition, we also observed decreased mRNA and protein levels of tumor-intrinsic chemokines, such as CXCL1, CXCL2 and CCL2 (Figure 2I and J), which are implicated in restricting lymphocyte infiltration and promoting immune evasion (50–52). IFN-γ is mainly produced by tumor-infiltrating T and natural killer (NK) cells (53), and accordingly, qRT-PCR analysis of RNA from bulk (unsorted) tumor tissue revealed dramatic increases in Ifng gene expression upon AG120 treatment and corroborated the increased expression of multiple IFN-γ response genes (Figure 2K). Collectively, these gene expression data indicate that mIDH1 inhibition promotes features of hepatocyte differentiation in tumor cells while also provoking rapid changes in tumor-immune interplay and interferon pathway activation.
We next tested whether such interplay contributes to the efficacy of mIDH1 inhibition by implanting CKIR132C ICC cells in immunodeficient NOD-scid Il2rg−/− (NSG) mice and assessing AG120 responsiveness. Remarkably, the benefit of AG120 was completely lost in this setting, with tumors growing at identical rates in the AG120- and vehicle-treated groups (Figure 2L). Thus, the therapeutic effect of mIDH inhibition in ICC requires intact immune function.
Anti-tumor efficacy of mIDH1 inhibition in ICC is mediated by CD8+ T cell effector functions
The above findings contrast with observations in AML where clinical response to mIDH inhibition likewise involves induction of tumor cell differentiation but where the therapeutic efficacy is recapitulated in immunodeficient models (26–28,54). While there is limited insight into the mechanisms underlying therapeutic impact of mIDH inhibition in solid tumors, mIDH and (R)-2HG have emerging roles in immunomodulation. Distinct processes and cell types have been implicated in suppressing anti-tumor immunity downstream of mIDH, including impaired recruitment of tumor infiltrating lymphocytes due to reduced expression of chemokines by tumor cells, and defects in T cell survival, migration, and effector function due to direct paracrine effects of (R)-2HG (17–20,55,56). To determine the effects of mIDH1 inhibition on the immune microenvironment of ICC, we performed single-cell RNA sequencing (scRNAseq) after enrichment of CD45+ cells from orthotopic ICC tumors treated for 6 days (Supplementary Figure S4A). We identified 19 cell clusters of the expected lymphoid and myeloid immune subsets in addition to populations of fibroblasts, endothelial cells, adipocytes, and other stromal cells (Supplementary Figure S4A and S4B). Analysis of cluster dynamics across conditions revealed remarkable changes in the immune composition in AG120-treated tumors. In particular, we observed pronounced alterations in the phenotype and proportions of myeloid cells including higher frequencies of proinflammatory M1 macrophages and decreased presence of neutrophils and monocytes after mIDH1 inhibition (Supplementary Figure S4C and S4D), suggesting a shift toward a less immune suppressive myeloid infiltrate.
Our gene expression profiling of purified ICC cells from AG120-treated tumors revealed strong enrichment of the IFN-γ response gene signature (Figure 2H). Because IFN-γ is produced primarily by tumor-infiltrating T cells and NK cells (Supplementary Figure S4E), we re-clustered the scRNAseq data to more carefully interrogate these lineages (Figure 3A). This analysis revealed 10 populations of T or NK cells, including 5 distinct subsets of CD8+ T cells representing a range of phenotypes from naive to terminal effector (Figure 3A; Supplementary Figure S4F). A comparison of the AG120 to the vehicle-treated condition revealed higher proportions of terminal effector and proliferating CD8+ T cells (Gzmbhigh and Prf1high), fewer naive and Tcf7+ progenitor CD8+ T cells (57–59), and an increased number of NK cells in the AG120-treated condition (Figure 3A–C; Supplementary Figure S4F). Moreover, GSEA on CD8+ T cells showed increased effector T cell gene signatures, cytolytic activity, and IFN response scores after mIDH1 inhibition (Fig 3D; Supplementary Table S1). To better understand the molecular mechanisms that enhance acquisition of T and NK cell effector phenotypes, we also performed GSEA to query the Hallmarks database. mIDH1 inhibition markedly enhanced expression of crucial metabolic pathways that support T cell fate decisions and effector functions, such as oxidative phosphorylation, fatty acid metabolism, and glycolysis in CD8+ T cells (Figure 3E; Supplementary Figure S4G–H) (56). These differences were more pronounced in effector CD8+ T cell subsets compared to naive or Tcf7+ progenitor CD8+ T cells (Figure 3F; Supplementary Figure S4G). NK cells also exhibited enrichments of signatures of oxidative phosphorylation and fatty acid metabolism, but not glycolysis, and did not show changes in cytolytic activity (Supplementary Figure S4H).
Figure 3. mIDH1 inhibition in ICC promotes CD8+ T cell effector function.
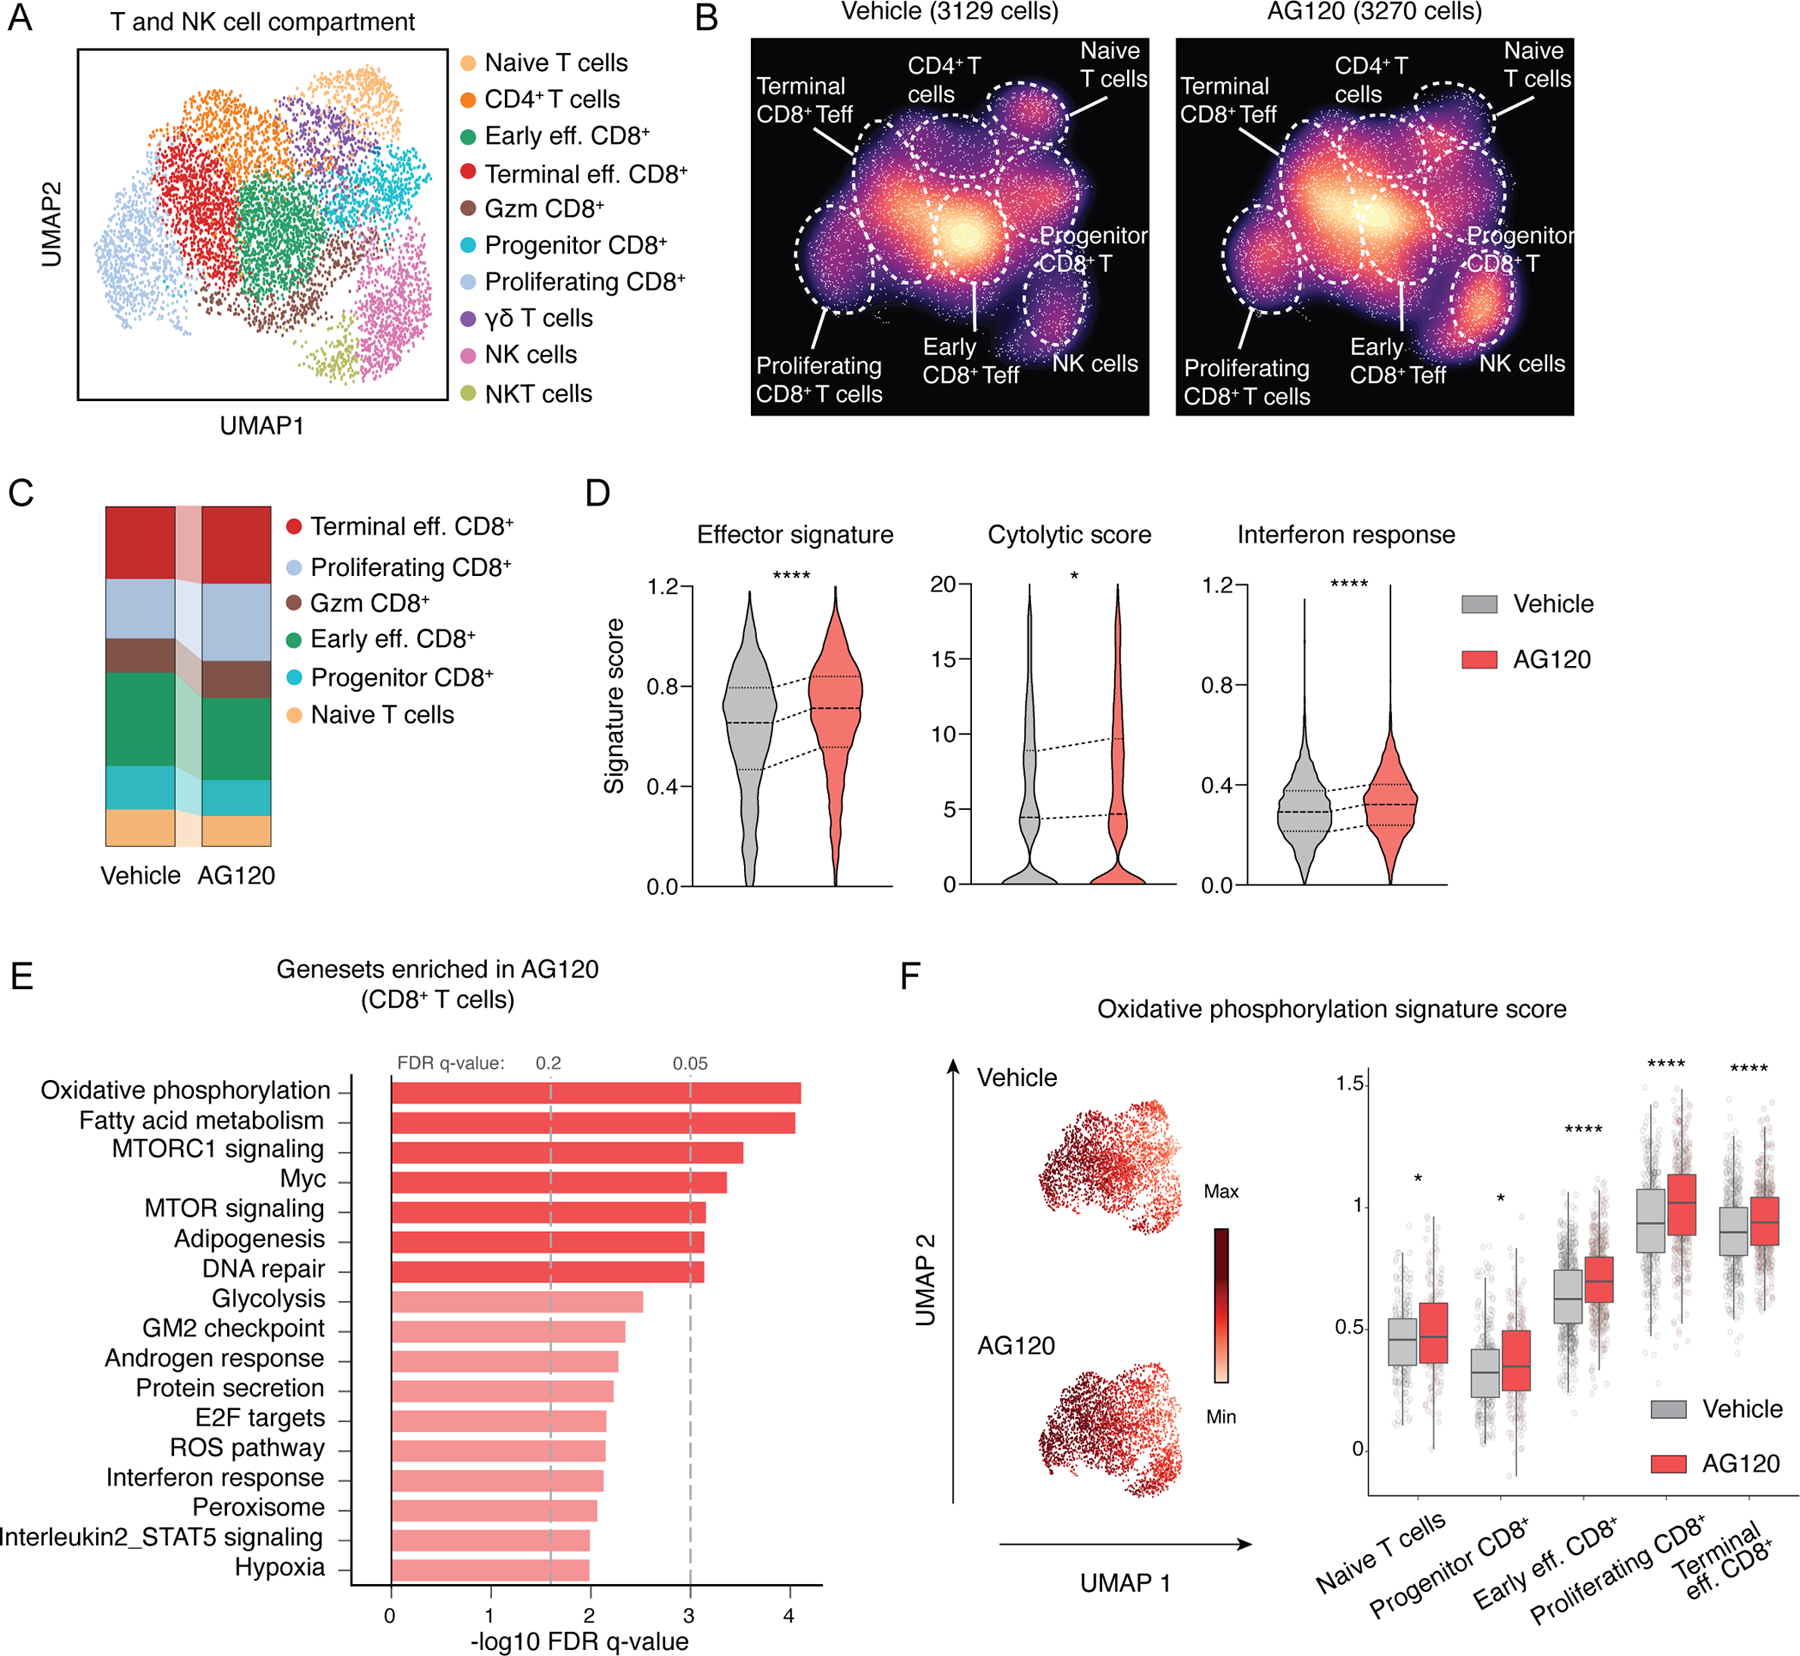
(A and B) Identification of tumor-infiltrating T/NK cell populations. Uniform manifold approximation and projection (UMAP) embeddings of single-cell RNA-seq profiles CD45+ leukocyte cells from ICC allografts. Representative of one experiment, N = 4 pooled vehicle-treated mice and N = 4 pooled AG120-treated mice. (C) Proportion of different clusters of CD8+ T cells. (D) Violin plot indicating effector signatures, cytolytic score and interferon response signatures. ****P<0.0001; * P<0.05. (E) GSEA of differentially expressed genes in CD8+ T cells within tumors from mice treated with AG120 and vehicle for 6 days. The vertical axis represents the 17 top ranked pathways in the Hallmark database with the smallest FDR q-values, and the horizontal axis represents -log10FDR q-value of significantly DEGs in each Hallmark terms. (F) Oxidative phosphorylation signature score in different CD8+ T cells populations. ****P<0.0001; * P<0.05.
Based on these observations, we focused on CD8+ T cells for further analysis. The very high levels of (R)-2HG produced by CKIR132C ICCs, as well as the cytokines and other potential metabolic shifts regulated by mIDH1 could mediate crosstalk with immune cells in the tumor microenvironment. In this regard, while (R)-2HG is not cell-permeable, T cell populations take up this metabolite through their expression of the SLC13A3 transporter (18). Moreover, we found that CD8+ T cells in our mIDH1 ICC allografts accumulate significant amounts of 2HG (Supplementary Figure S5A). Since engagement of glycolysis and mitochondrial fitness are required for T cell effector function and our GSEA studies revealed evidence of upregulation of these pathways upon mIDH1 inhibition in vivo, we examined the impact of mIDH1-controlled secreted factors on the physiology of activated CD8+ T cell in vitro. To this end, murine CD8+ T cells were activated by anti-CD3/CD28 antibody beads and subsequently cultured in the presence of either exogenous (R)-2HG or conditioned media from mIDH1 ICC cells grown with or without AG120 treatment. Conditioned media from an IDH1 WT ICC cell line (CKP) was used as a control. IFN-γ, TNFα and Granzyme B production upon re-stimulation were strongly reduced by exogenous (R)-2-HG (Supplementary Figure S5B–D) or by conditioned media from vehicle-treated mIDH1 ICC cells as compared to that from either AG120-treated mIDH1 ICC cells or from CKP ICC cells (Supplementary Figure S5E–G). These (R)-2HG-induced impairments in cytokine production were associated with reduced extracellular acidification rate (ECAR, glycolysis) and, to a lesser extent, maximal oxygen consumption rate (OCR, mitochondrial fitness) in resting and stimulated CD8+ T cells (Supplementary Figure S5H and I). Therefore, (R)-2HG released from mIDH1 ICC is sufficient to restrict cytokine production and metabolic fitness in activated CD8+ T cells in vitro, suggesting a paracrine role for this metabolite in the alterations in CD8+ T cell effector function observed upon AG120 treatment in vivo.
We performed immunostaining for CD8+ cells to complement the scRNAseq data with spatial information. We first compared tumors from the CKIR132C GEMM with those from the IDH wildtype CKP GEMM by immunohistochemistry (IHC). Whereas CD8+ cells were readily detected in CKP tumors, CKIR132C tumors showed only sparse staining (78 cells /HPF versus 20 cells /HPF; Figure 4A). Importantly, staining of a collection of 43 primary human tumor samples also demonstrated very low CD8+ T cell infiltration in mIDH1 ICCs compared to IDH wildtype ICC (Figure 4B). To extend these observations to an independent cohort of human ICCs, we applied the CIBERSORTX tool to predict immune cell abundance from the publicly available International Cancer Genome Consortium (ICGC) RNAseq data set (110 total ICC patient samples) (60), which again highlighted the reduced CD8+ T cell infiltration associated with IDH mutations (Figure 4C). Conversely, AG120 treatment of CKIR132C allograft models for 6 days resulted in increased total intratumoral CD8+ cells and CD8+Granzyme B+ cytotoxic T cells relative to vehicle control (Figure 4D; Supplementary Figure S5J–L). Importantly, AG120 stimulated similar T cell recruitment in autochthonous ICCs arising in the CKIR132C GEM model (Figure 4E). Thus, mIDH1 ICCs have low numbers of CD8+ T cells with reduced effector function at baseline, whereas AG120 treatment stimulates rapid CD8+ cell infiltration and effector function.
Figure 4. Therapeutic efficacy of mIDH1 inhibition in ICC requires recruitment of tumor-infiltrating CD8+ T cells.
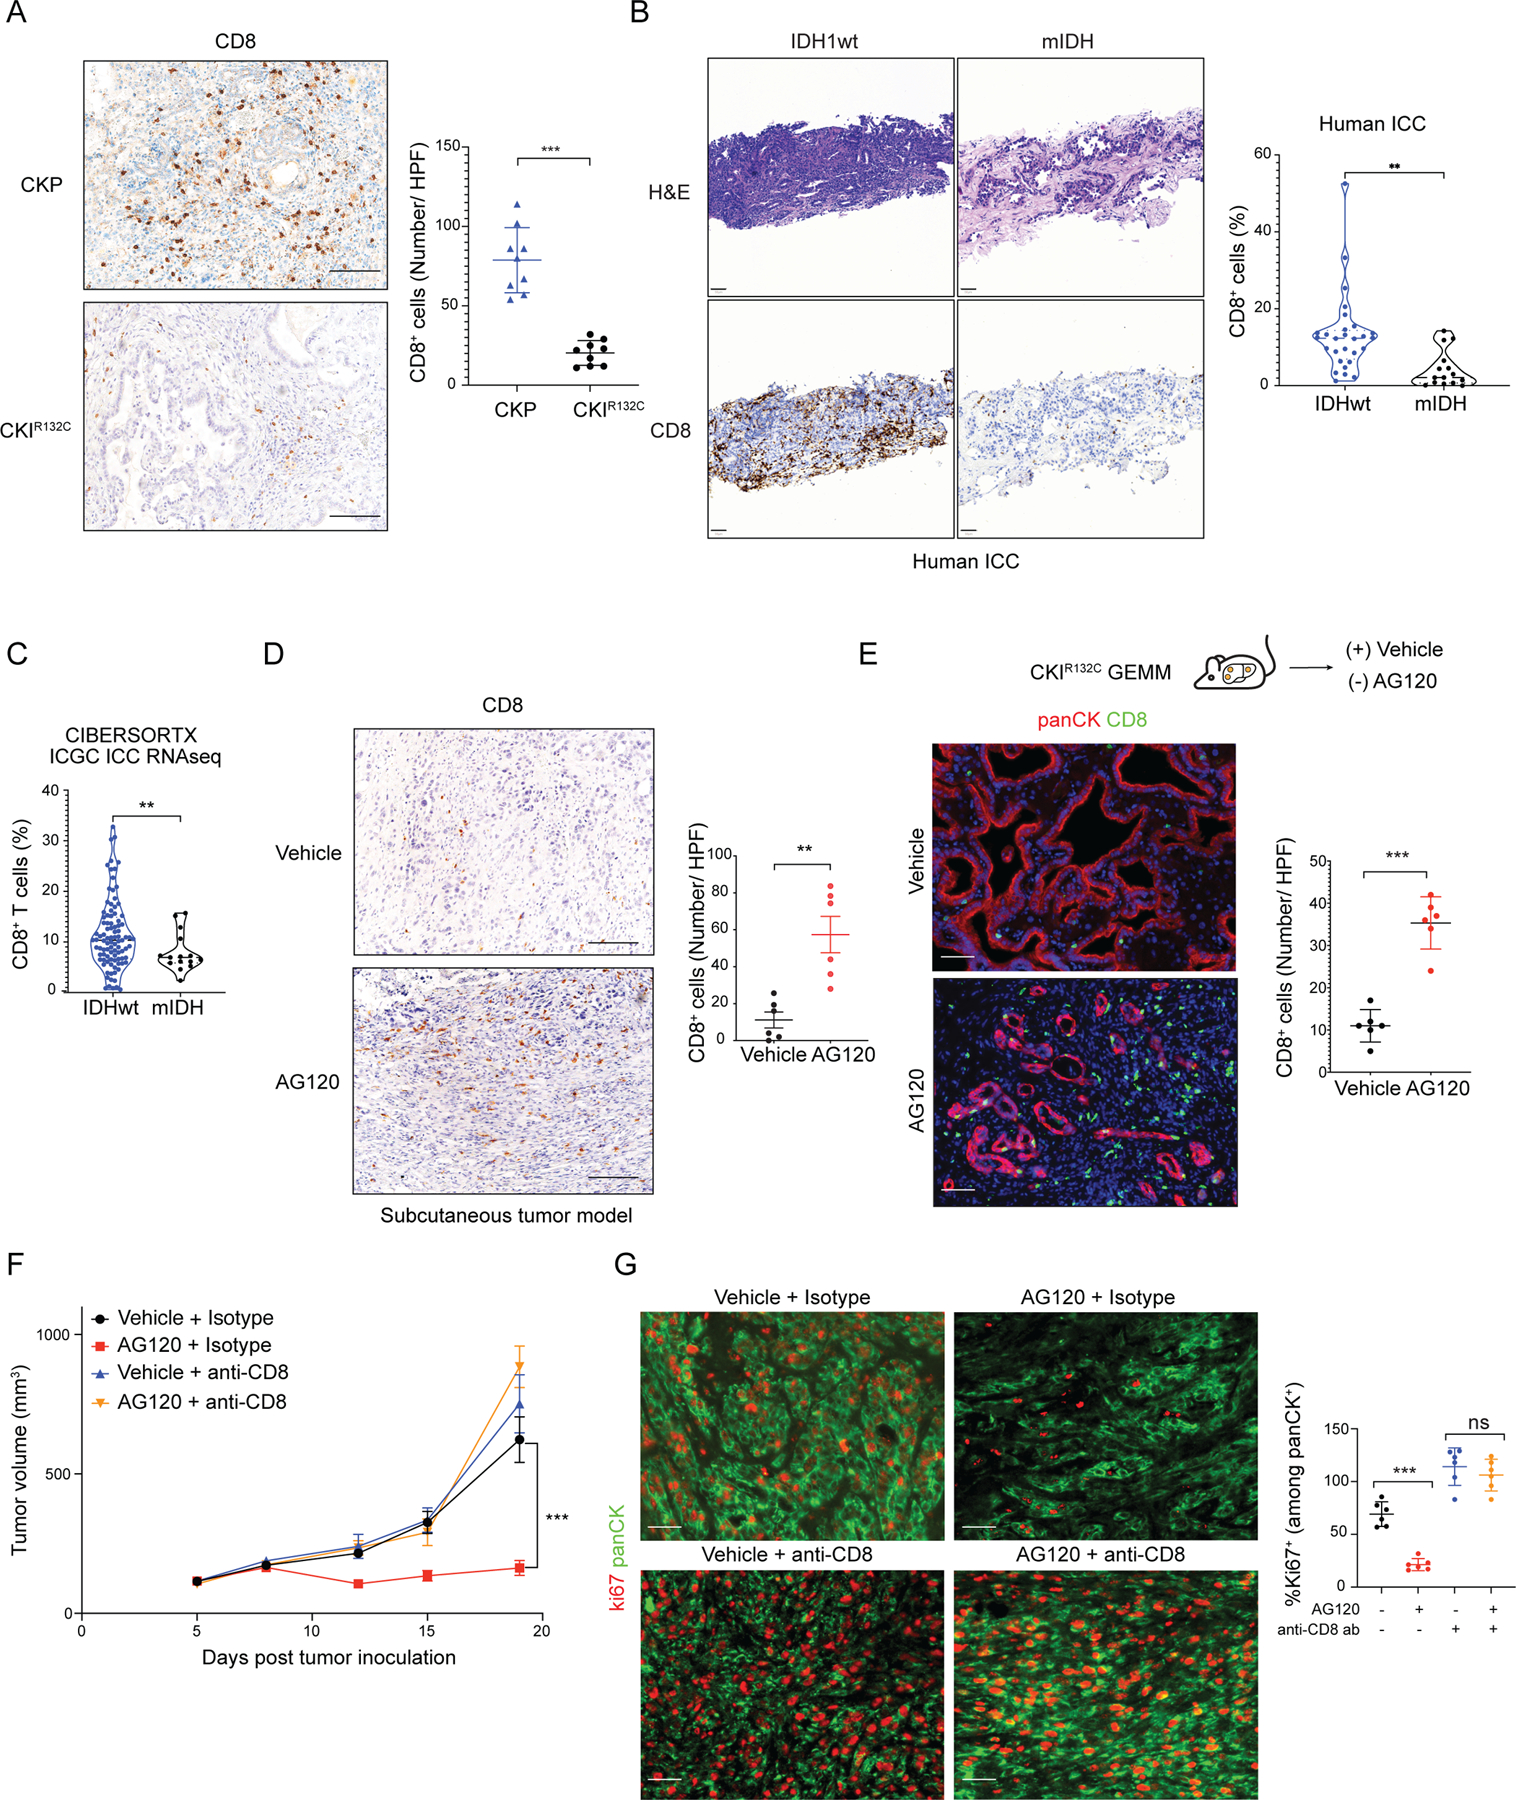
(A) IHC staining for CD8 in ICC from the CKP and CKIR132C GEM models; right: quantification. N = 9 mice/group. Data represents mean ± SD; ***P<0.001; unpaired t-test. (B) H&E staining (upper panels) and IHC staining for CD8 (bottom panels) of primary human ICCs with either IDH wildtype (IDHwt) or IDH mutant genotypes; right: quantification. Data represents mean ± SD; **P<0.01; unpaired t-test). (C) CIBERSORTX analysis of CD8+ T cells in IDHwt (N = 95) and mIDH (N = 15) ICC in the ICGC expression data set. Total N = 110 biologically independent samples. **P<0.01; unpaired t-test. (D) IHC staining for CD8 in CKIR132C subcutaneous allograft ICCs after 6 days treatment with vehicle or AG120; right: quantification. Data represents mean ± SD; **P<0.01; unpaired t-test. (E) Study of CD8+ T cell infiltrate in ICCs arising autochthonously in the CKIR132C GEM model after 6 days treatment with vehicle or AG120. Lower: fluorescence-stained sections; green: CD8, red: panCK, blue: DAPI; right: quantification. Data represents mean ± SD; ***P<0.001; unpaired t-test. (F, G) Immunocompetent wildtype mice were injected subcutaneously with a CKIR132C primary ICC cell line. Mice were randomized into two groups and injected with anti-CD8 antibody or isotype control three days before tumor cell inoculation. When tumors reached ~100 mm3 in volume, animals in each group were randomized into AG120 and vehicle conditions. (F) Analysis of serial changes in tumor volume. N = 6 mice per group. Data represent means ± SEM; ***P<0.001; unpaired t-test. (G) Representative fluorescence-stained sections of tumors following 14 days treatment with vehicle or AG120; green: panCK, red: Ki67; right: quantification. Data represents mean ± SD. ***P < 0.001, ns: not significant; unpaired t-test. Scale bars: 100 μm (A; D), 50 μm (B; D; E; G).
To formally test the requirement for cytotoxic T cells for response to mIDH1 inhibition, we treated mice with anti-CD8 antibody or isotype control prior to generation of subcutaneous allografts, and then assessed AG120 efficacy. The results showed that the anti-tumor activity of AG120 against CKIR132C allografts was completely lost upon CD8+ T cell depletion, as reflected by tumor volume and cell proliferation measurements (Figure 4F and 4G). Collectively, these data reveal that mIDH1 drives an immunosuppressive phenotype in ICC and that stimulation of a cytotoxic T cell-mediated immune response is essential for the therapeutic efficacy of AG120.
TET2 reactivation is required for the antitumor immunity induced by mIDH1 inhibition
The above findings demonstrate a critical role for T cell immunity in AG120 response of mIDH1 ICCs and point to paracrine immunomodulatory effects of (R)-2HG in this context. However, they leave open the question of whether mIDH1-regulated tumor cell-intrinsic factors are also central to coordinating tumor-immune interplay and growth control. Among candidate (R)-2HG targets, we focused on TET2, which is an established tumor suppressor in AML. The relatively high reported IC50 for inhibition of TET2 by (R)-2HG (7,61) suggests that TET2 would be strongly compromised in IDH1R132C-expressing livers but only weakly so in the less tumor-prone IDH1R132H-expressing livers, based on the observed (R)-2HG levels (Figure 1C). While less studied in solid tumors, TET2 has recently been found to hydroxymethylate chemokine gene promoters in complex with STAT1 upon IFN-γ stimulation of colon cancer and melanoma cell lines, leading to increased chemokine gene expression and lymphocyte infiltration (Figure 5A) (62). First, we measured global levels of 5-hydroxymethylcytosine (5hmC) to gauge TET2 activity in tumors from CKP and CKIR132C mice and in the single ICC observed in the CKIR132H model. CKIR132C tumors showed the lowest level of global 5hmC by a wide margin, followed by the CKIR132H model, and then CKP tumors, correlating inversely with relative 2HG concentrations (Figure 5B; Supplementary Figure S6A). Importantly, AG120 treatment resulted in a marked (~2-fold) increase in global 5hmC compared to vehicle in CKIR132C tumors (Figure 5C), directly linking mIDH1 and suppression of TET demethylase activity in vivo. In addition, AG120 treatment restored 5hmC levels in both CKIR132H and CKIR132C ICC cells in a dose-dependent manner in vitro. Notably, greater AG120 levels were required to restore TET activity in CKIR132C cells, consistent with their 2HG concentrations surpassing considerably the IC50 value for TET2 inhibition (0.5 mM AG120 was required to effectively restore 5hmC levels in CKIR132C cells whereas only 0.1 mM AG120 was required in CKIR132H cells; Supplementary Figure S6B–C).
Figure 5. Restoration of the TET2-mediated anti-tumor immunity is required for mIDH inhibitor efficacy.
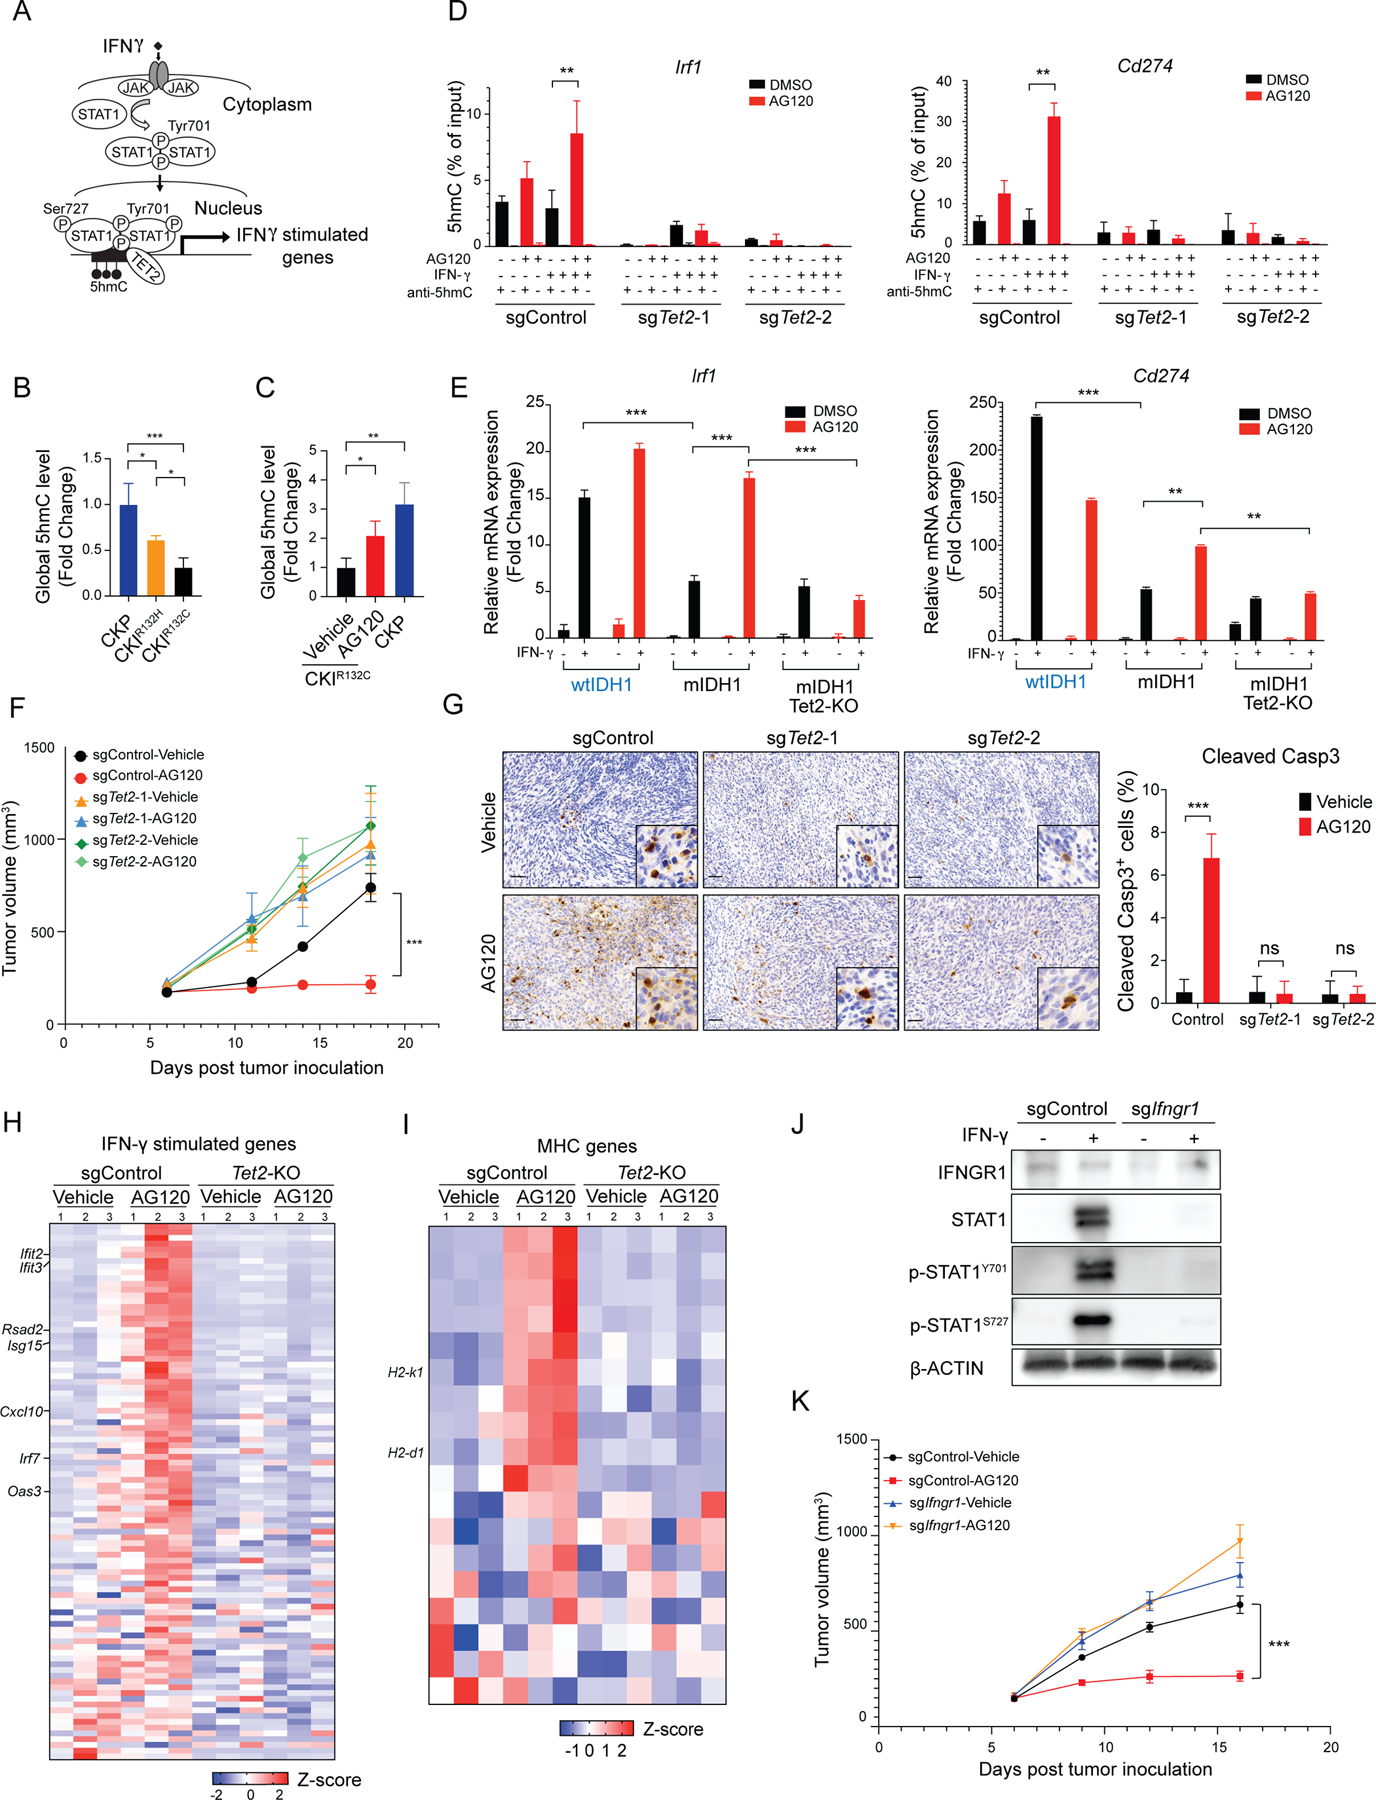
(A) Schematic of IFN-γ- TET2 signaling. (B and C) Global levels of 5hmC (measured by ELISA) relative to total input DNA in ICCs from (B) the CKP, CKIR132H and CKIR132C models, and (C) CKIR132C ICC allografts treated with vehicle or AG120 versus CKP control. Data represent mean ± SD. N=3 tumor per group. *P < 0.05, **P<0.01, ***P<0.001; unpaired t-test. (D) hMeDIP assays with anti-5hmC or IgG antibody were performed in the indicated CRISPR-engineered derivatives of CKIR132C ICC cells grown ± IFN-γ and ± AG120 in vitro. 5hmC levels on the Irf1and Cd274 promoters were determined by two-step real-time RT-PCR. Data represent mean ± SD for triplicate experiments. (E) Relative mRNA expression of Irf1 and Cd274 in the indicated CRISPR-engineered derivatives (wtIDH1 and mIDH1-sgControl and mIDH1-sgTet2–2) of CKIR132C ICC cells grown ± IFN-γ and ± AG120 in vitro. mRNA expression was analyzed by two-step real-time RT-PCR. All data were normalized to Actb then to geometric mean of the vehicle-treated condition. Data represents mean ± SD. In the in vitro experiments above, AG120 treatment was for three days and IFN-γ treatment was for 24 hours. (F-I) Immunocompetent wildtype mice were injected subcutaneously with the indicated derivatives of CKIR132C ICC cells. When tumors reached ~100 mm3 in volume, animals were randomized into vehicle and AG120 groups. (F) Analysis of serial changes in tumor volume. N = 6 mice per group. Data represent means ± SEM. ***P < 0.001; unpaired t-test. (G) IHC staining for cleaved Caspase 3 at 15 days of treatment; right: quantification. Data represents mean ± SD; ***P<0.001; *P<0.05; unpaired t-test. Heatmap of relative expression of an annotated panel of (H) IFN-γ-stimulated genes (I) murine MHC genes in magnetic bead-sorted tumor cells from the indicated allograft models treated with AG120 or vehicle for 5 days. The analysis used the nCounter PanCancer Mouse Immune Profiling gene expression platform (NanoString Technologies). (J and K) CKIR132C ICC cells were CRISPR-engineered with control sgRNA and sgIfngr1. (J) Detection of IFNGR1, STAT1, p-STAT1Y701, p-STAT1S727 protein by immunoblot. β-ACTIN serves as an internal loading control. (K) Immunocompetent wildtype mice were injected subcutaneously with the indicated derivatives of CKIR132C ICC cells. When tumors reached ~100 mm3 in volume, animals were randomized into vehicle and AG120 groups. Analysis of serial changes in tumor volume. N = 6 mice per group. Data represent means ± SEM. ***P < 0.001; unpaired t-test. Scale bar: 100 μm (G).
To examine the specific contribution of TET2 to AG120 response, we deleted Tet2 (Tet2-KO) in CKIR132C ICC cells using CRISPR/Cas9 genome editing with the Selective CRISPR Antigen Removal (SCAR) vector system (63). This system is optimized for non-immunogenic lentiviral engineering of target cells. Two Tet2-KO lines were generated using distinct sgRNA guides (sgTet2-1, sgTet2-2) (Supplementary Figure S6D–E). sgTet2 and sgControl cells were treated in vitro with IFN-γ and AG120, alone or in combination, to test whether mIDH1 causes cell autonomous defects in IFN-γ response and correspondingly, whether TET2 reactivation is required for stimulation of IFN-γ target genes in the setting of mIDH1 inhibition.
Hydroxymethylated DNA immunoprecipitation (hMeDIP)-qPCR showed that 5hmC levels at the Irf1 and Cd274 promoters were increased in sgControl ICC cells upon treatment with AG120, but not with IFN-γ, whereas the combination led to a further boost in 5hmC (Figure 5D). By contrast, in Tet2-KO CKIR132C ICC cells, baseline levels of these modifications were barely detectable and no significant effects of AG120 and IFN-γ were seen (Figure 5D). Accordingly, CKIR132C ICC cells showed an attenuated induction of Irf1 and Cd274 mRNA expression in response to IFN-γ treatment as compared to CKP ICC cells (Figure 5E). AG120 potentiated IFN-γ-mediated stimulation of these genes in CKIR132C ICC cells, an effect abolished (Irf1) or partially overcome (Cd274) by Tet2 deletion (Figure 5E). Tet2-deletion did not reduce phosphorylation of STAT1 (Supplementary Figure S6F). Thus, mIDH1 blocks induction of IFN-γ target genes in ICC cells due to 2HG-dependent inhibition of TET2, whereas upstream IFN-γ-JAK-STAT1 signaling remains intact.
We next corroborated these findings in a set of human cholangiocarcinoma cell lines, including two with wildtype IDH1/IDH2 (ICC15 and ICC18) and two with mutant IDH1 (RBE and SNU1079). mIDH1 cholangiocarcinoma cell lines had low 5hmC levels relative to the WT cholangiocarcinoma cell lines, while AG120 treatment strongly boosted 5hmC levels in the mIDH1 cells (Supplementary Figure S6G). Moreover, whereas the wtIDH1 cell lines were highly responsive to IFN-γ treatment, showing pronounced upregulation of established target genes (15–30-fold induction of IRF1, CD274, and IFIT3), the mIDH1 lines showed muted response (most with less than 2-fold induction) (Supplementary Figure S6H). Importantly, AG120 treatment significantly enhanced the response of mIDH1 cells to IFN-γ. Thus, mIDH1 leads to defects in TET activity and IFN-γ response in human ICC cells, effects that are reversed by mIDH1 inhibition.
Next, we tested the impact of TET2 status on AG120 response in vivo by generating syngeneic immunocompetent mouse models using mIDH1 ICC sgControl cells and mIDH1 ICC-Tet2-KO (sgTet2-1, sgTet2-2) cells. Consistent with our prior studies, AG120 treatment slowed progression and induced cell death (cleaved Caspase 3) of mIDH1 ICC-control tumors, whereas the mIDH1 ICC-Tet2-KO tumors were completely unaffected (Figure 5F and 5G). However, both the recruitment of CD8+ T cells and induction of IFN-γ expression in the bulk tumor were increased by AG120 regardless of TET2 status in the malignant cells (Supplementary Figure S7A and 7B). Moreover, IHC staining revealed that total nuclear STAT1 and phosphorylated STAT1 were increased upon mIDH1 inhibition in the tumors in both the Control and Tet2-KO groups (Supplementary Figure S7C). Thus, TET2 reactivation is essential for the therapeutic efficacy of AG120 but is dispensable for stimulation of the upstream induction of IFN-γ signaling.
We used the NanoString Immune Profiling gene expression platform to investigate the contributions of TET2 to the tumor-intrinsic immune response resulting from mIDH1 inhibition in vivo. This analysis surveyed 770 immune-related genes in magnetic bead-purified tumor cells from the mIDH1 ICC-control and mIDH1 ICC-Tet2-KO models after 5 days treatment with AG120 or vehicle. Among the annotated set of 93 IFN-γ-stimulated genes, 37 were induced >2-fold (and 54 were >1.5-fold) after AG120 treatment in mIDH1 ICC sgControl tumor cells, whereas none were induced by AG120 in the mIDH1 ICC-Tet2-KO model (Figure 5H shows heatmap of IFN-γ-stimulated genes; Supplementary Figure S7D, shows representative genes). The IFN-γ response pathway remained upregulated in ICC cells in a TET2-dependent manner after 15 days treatment, as demonstrated by targeted RT-qPCR analysis (Supplementary Figure S7E). These observations support a key role of TET2 in mediating tumor cell response to mIDH1 inhibition by epigenetically activating IFN-γ target genes in vivo.
IFN-γ signaling can stimulate specific anti-tumor immune responses by upregulating expression of MHC class I or II molecules on tumor cells. We found that mIDH1 inhibition in ICC allografts led to the prominent TET2-dependent upregulation of a broad set of MHC genes (e.g., H2-k1, H2-d1) (Figure 5I). Moreover, in the context of IFN-γ treatment, mIDH1 inhibition increased MHCI (H2Kb/H2Db) at the cell surface in sgControl cells but not in sgTet2 cells (Supplementary Figure S7F). These data implicate IFN-γ-TET2-mediated induction of MHCI in the AG120 response.
We engineered CKIR132C ICC cells with SCAR-mediated deletion of Interferon gamma receptor 1 (Ifngr1-KO) to formally test the requirement for IFN-γ signaling in AG120 efficacy. Importantly, as observed for Tet2 deletion, allografts established from Ifngr1-KO ICC cells were resistant to AG120 (Figure 5J and 5K). Collectively, these data point to dual mechanisms by which mIDH1 inhibition restores anti-tumor immunity in ICC, involving increased CD8+ T cell infiltration and effector function as well as reactivation of TET2 to enable the IFN-γ-induced epigenetic response program in the malignant cells. Notably, NanoString profiling of a custom panel of hepatocyte lineage genes showed that TET2 inactivation did not compromise the hepatocyte marker induction caused by AG120 treatment (Supplementary Figure S7G), consistent with the primacy of immune crosstalk rather than cellular differentiation in therapeutic efficacy.
Anti-CTLA4 synergizes with mIDH1 inhibition by overcoming the IFN-γ-induced checkpoints
The inflammatory effects of the IFN-γ signaling can be limited by feedback activation of immunological checkpoints, which ultimately compromise anti-tumor immune responses, suggesting a possible explanation for the lack of durable response to AG120 observed in our models. Indeed, mRNA and protein levels of the IFN-γ target, CD274 (PD-L1) (64), were increased after AG120 treatment (Supplementary Figure S8A and B). Additionally, mIDH1 inhibition caused accumulation of terminal effector CD8+ T cells which have a more exhausted phenotype with higher expression of inhibitory checkpoint receptors such as Pdcd1 (PD-1), Ctla4, Lag3 or Havcr2 (Tim3) (Supplementary Figure S4F). Accordingly, we tested whether AG120 has cooperative effects with immune checkpoint inhibition using anti-PD-1 antibodies to enhance the CD8+ T cell response to ICC (Supplementary Figure S8C). However, despite the observed CD8+ T cell recruitment and PD-L1 induction, this combination did not have a cooperative effect in reducing tumor volume (Supplementary Figure S8D–E). Treg cells and other immunosuppressive cells have been implicated in resistance to PD-1 blockade (65) and arise as compensatory mechanisms in highly inflammatory environments. We therefore hypothesized that by promoting IFN-γ responsiveness, AG120 could also promote Treg recruitment into the tumors. In this regard, AG120 treatment also increased the mRNA levels of a group of cytokines with Treg attractant and activation properties, including Il16, Il6, Il1a and Il17d (Figure 6A). Correspondingly, we observed enhanced numbers of intratumoral Treg cells in tumors evident after 6 days treatment (Figure 6B). Furthermore, there was a significant increase in mRNA and protein expression of the CTLA-4 ligand, CD80, in the tumor microenvironment (Figure 6C and D).
Figure 6. mIDH inhibition stimulates immune checkpoints and Treg recruitment and synergizes with anti-CTLA4 antibody treatment.
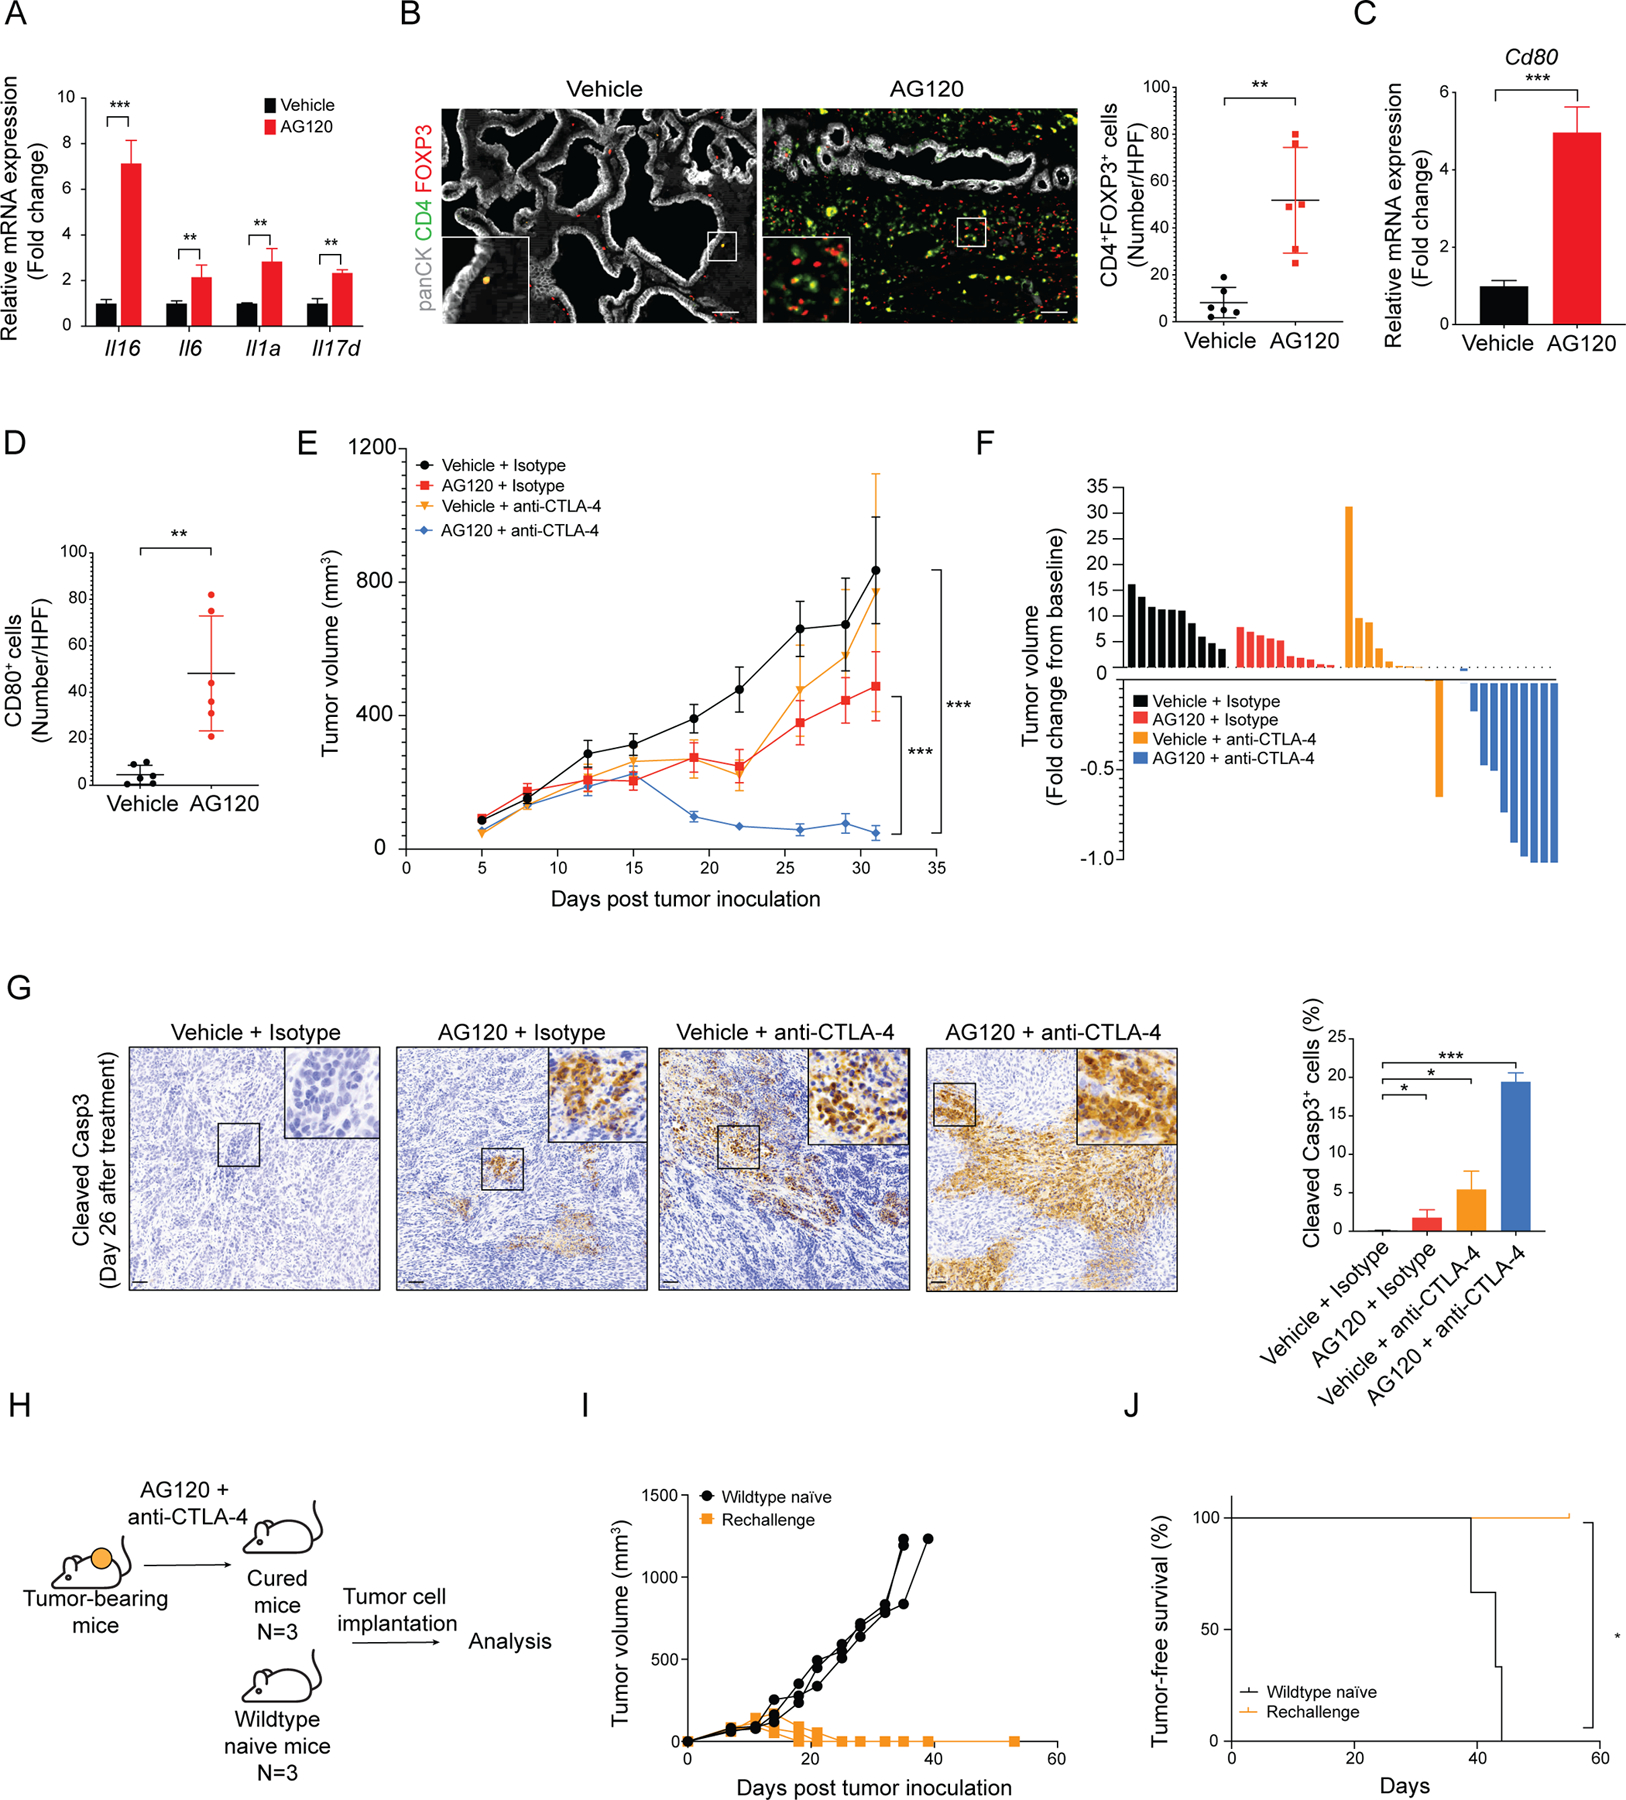
(A) Levels of Il16, Il6, Il1a and Il17d mRNA in purified ICC cells from AG120-treated and vehicle-treated CKIR132C allograft tumors. Transcript levels were measured as FPKM values by RNA-seq analysis. Data represents mean ± SD. **P < 0.01, ***P<0.001; unpaired t-test. (B) Representative fluorescence-stained sections of ICCs arising in the CKIR132C GEM model upon treatment with vehicle or AG120 for 6 days; green: panCK, red: FOXP3, magenta: CD4; right: quantification. Data represents mean ± SD. *P < 0.05; unpaired t-test. (C) Relative mRNA expression of Cd80 in vehicle- and AG120-treated bulk tumors by two-step real-time RT-PCR. All data were normalized to Actb then to geometric mean of vehicle-treated tumors. Data represents mean ± SD; ***P<0.001; unpaired t-test. (D) Quantification of IHC stained sections for CD80 in tumors from vehicle-treated mice and AG120-treated mice. Data represents mean ± SD; **P<0.01; unpaired t-test. (E, F) Immunocompetent wildtype mice were injected subcutaneously with CKIR132C ICC cells. When tumors reached ~100 mm3 in volume, animals were randomized into vehicle + isotype antibody, AG120 + isotype, vehicle + anti-CTLA-4 antibody, and AG120 + anti-CTLA-4 antibody groups. (E) Analysis of serial changes in tumor volume. N = 10 mice per group. Data represent means ± SEM. ***P < 0.001; unpaired t-test. (F) Waterfall plot of the maximum percentage change in tumor volume from baseline at day 32 after tumor inoculation (26 days treatment) in each group. (G) IHC staining for cleaved Caspase 3 in ICC allografts from mice in the indicated treatment groups; right: quantification. Data represents mean ± SD; ***P<0.001; *P<0.05; unpaired t-test. (H) Approach to studying whether combination treatment elicited durable immune memory. (I) Tumor-naïve immunocompetent wildtype mice and mice cured by the AG120 + anti-CTLA4 therapy 125 days after primary challenge were injected subcutaneously with CKIR132C primary ICC cells and analyzed for serial changes in tumor volume. N = 3 mice per group. (J) Kaplan-Meier analysis for time until tumor progression necessitated euthanasia (N=3; N represents mouse numbers). Kaplan-Meier curves were analyzed by log-rank test. *P < 0.05 was considered statistically significant. Scale bars: 100 μm (B), 50 μm (G).
Anti-CTLA-4 antibody therapy can function as a checkpoint blockade as well as deplete Treg cells which express CTLA-4 (66) by antibody-dependent cell-mediated cytotoxicity (ADCC) (67), prompting us to assess the efficacy of AG120 plus anti-CTLA-4 antibody treatment against mIDH1 ICCs. Tumor-bearing mice were treated with AG120 twice daily and anti-CTLA4 antibody every three days for 26 days. This regimen demonstrated a synergistic anti-tumor effect compared to either agent alone (Figure 6E and F; Supplementary Figure S8F–H). While tumor regressions were not observed upon AG120 treatment (0/10 mice) and were seen in only 1/10 mice administered anti-CTLA4 antibody, 9/10 mice receiving the combination showed marked tumor regression, including 3/10 with complete responses by the end of the 26-day treatment course. Five mice/group were euthanized for analysis at this time point. Staining of tumor tissue for cleaved caspase-3 revealed pronounced induction of cell death by the AG120 + anti-CTLA4 combination compared to the other treatment conditions (Figure 6G). Combination treatment also decreased the number of Treg cells which was elevated by single agent AG120 treatment (Supplementary Figure S8G). The remaining animals were monitored long-term without treatment to assess the completeness and durability of this response. Strikingly, whereas tumors in the single agent and vehicle groups all showed rapid progression requiring euthanasia (median, 30–40 days after treatment initiation), three of five mice in the combination group remained tumor-free for >125 days and the other two progressed at 55 and 70 days (Supplementary Figure S8H and I).
To investigate whether combination treatment elicited sustained tumor-specific T cell responses, mice that were apparently cured by AG120 + anti-CTLA4 therapy (125 days following initial treatment/90 days after cessation of treatment) were rechallenged by injection of CKIR132C ICC cells. Tumor-naïve mice were used as controls. All three cured mice exhibited complete protection from rechallenge, showing no evidence of tumors after >50 days post tumor inoculation, compared to naïve animals which displayed the expected rapid tumor development (Figure 6H–J). Thus, while AG120 treatment results in the simultaneous recruitment of effector and immunoregulatory cells, additional CTLA-4 blockade favored the effector response, resulting in an almost complete tumor remission and sustained immunological memory in this mIDH1 ICC model.
Discussion
Our studies addressed the functions of mutant IDH1 in the sustained growth of an advanced solid malignancy. By developing a mouse model that recapitulates the genetics and histopathologic features of human ICC, we demonstrated that mIDH1 supports ICC tumor maintenance through (R)-2HG-mediated TET2 inactivation and suppression of anti-tumor immunity. mIDH1 inhibition reverted the immune evasion phenotype, provoking rapid CD8+ T cell recruitment and effector function, TET2-dependent epigenetic response to IFN-γ in tumor cells, and decreased tumor growth. While immune checkpoint activation and Treg stimulation led to eventual tumor progression, dual treatment with anti-CTLA4 antibody conferred complete and durable responses.
The data show that mIDH1 causes insensitivity of ICC cells to immune-derived signals and impaired CD8+ T cell function through distinct, TET2-dependent and -independent mechanisms.
TET2 activity was compromised in our mIDH1 CKIR132C model and in human mIDH1 ICC cells due to high (R)-2HG levels, whereas TET2 function was restored by AG120 treatment. TET2 knockout conferred complete resistance to AG120 treatment in vivo but did not affect CD8+ T cell infiltration or IFN-γ induction. Rather, TET2-deficient ICC cells failed to induce the IFN-γ response program. IFNGR1 ablation also caused mIDH1 tumors to become AG120 insensitive, consistent with IFN-γ response serving as the primary growth inhibitory output of TET2 in this setting. The anti-tumor effects of IFN-γ-TET2 pathway stimulation following mIDH1 inhibition were linked to promotion of tumor cell death, proliferative arrest, and antigen presentation (Figure 5I; Supplementary Figure S7F).
mIDH1 inhibition rapidly stimulated CD8+ T cell infiltration and effector function in the ICC model. Our data support a role for reduction in direct paracrine signaling by (R)-2HG signaling in modulating effector function. mIDH1 tumors secrete high levels of (R)-2HG (Supplementary Figure S3G, S3J and S3L). Moreover, CD8+ T cells in our mIDH1 ICC allograft model accumulate significant levels of (R)-2HG (Supplementary Figure S5A). Exogenous (R)-2HG has been reported to have diverse effects on T cell function, including suppressing proliferation and activation (18,68,69). We show that (R)-2HG treatment of activated CD8+ T cells in vitro impairs production of IFN-γ and other cytokines, associated with defects in glycolysis and mitochondrial fitness— findings that are in keeping with scRNAseq analysis of CD8+ TILs revealing increased effector scores and enrichment of these metabolic signatures in upon AG120 treatment in vivo. These observations complement studies from Bunse et al. (18) showing that (R)-2HG suppresses activation of naïve T cell populations, particularly CD4+T cells. The defect in lymphocyte recruitment may also involve direct paracrine effects of (R)-2HG but could also be the result of intrinsic defects in innate immunity of mIDH1 tumor cells. In this regard, we observed that AG120 coordinately downregulated the chemokines, CXCL1, CXCL2 and CCL2, that can potently suppress T cell recruitment. CXCL1 has been shown to be epigenetically activated by H3K4-targeted demethylases (70), which are potential targets of (R)-2HG (3,61). In addition, our RNAseq analysis indicates that AG120 induces immunostimulatory type I IFN signaling that can confer an innate immune response (Figure 2H). Defining the signals that direct the initial recruitment and activation of CD8+ T cells to these formerly immunologically cold tumors will be important in comprehensively explaining how mIDH1 inhibition induces anti-tumor immunity. More broadly, it will be critical to establish the sequential alterations in tumor biology resulting from mIDH1 inhibition, elucidating the full constellation of cell types in the tumor microenvironment targeted by (R)-2HG or by other tumor-derived factors, and deciphering the resulting crosstalk in mIDH1 ICC.
While the IFN-γ response was required for the therapeutic efficacy of mIDH1 inhibitor treatment, sustained IFN-γ signaling also likely contributed to the ultimate dampening of anti-tumor immunity via immune checkpoint activation. We observed induction of PD-L1 expression in the tumor cells, increased expression of inhibitory checkpoints in CD8+ cells—including Pdcd1 (PD-1) and Ctla4 (Supplementary Figure S4F), and elevation in CD80 in the tumor microenvironment (Figure 6C and D). AG120 also provoked significant recruitment of Tregs, which coupled with the ability of PD-1 blockade to activate and expand tumor-infiltrating PD-1+ Treg cells (71), may have contributed to the failure of AG120 + PD-1 blockade in our model. Conversely, the dual Treg-depleting and CD8+ T cell-reactivating ability of anti-CTLA4 antibody treatment (72) is consistent with the specific and potent synergy conferred by combined AG120 + CTLA4 blockade (Figure 6E). In addition to being the ligand for CTLA4, CD80 provides a co-stimulatory signal to T cells. Since CD80 is expressed primarily by antigen presenting cells (APCs), the increased number of CD80+ cells (Figure 6D) suggests that AG120 treatment augmented co-stimulatory capacity in the tumor microenvironment. However, the ability of CD80 to activate T cells is inhibited by Treg cells and CTLA4 on infiltrating CD8+ T cells. In this setting, CTLA4 blockade unleashes the co-stimulatory capacity of CD80 and promotes T cell activity (73). Thus, mIDH1 inhibition in patients with ICC and other solid tumor malignancies may enhance the response to immune checkpoint blockade by restoring tumor-intrinsic sensitivity to IFN-γ.
In AML patients and immunodeficient xenograft models of the disease, mIDH inhibition promotes maturation of leukemic stem cells to terminally differentiated myeloid cells — which have short lifespan like their normal equivalents — leading to frequent complete remissions (26). This central role of induction of differentiation in the therapeutic efficacy of mIDH inhibition is in keeping with the established treatment paradigm of differentiation therapy in hematopoietic malignancies. In solid tumors there is no clear precedent for differentiation-based treatments. Nevertheless, strong induction of hepatocyte lineage genes was observed in on-treatment versus pre-treatment biopsies from the Ivosidenib trial in mIDH1 ICC, correlating with improved patient outcomes (73), and consistent with prior observations linking mIDH1 to a block in hepatocyte differentiation (23). Although mIDH1 inhibition stimulated comparable hepatocyte signatures in our mouse ICC model, we found that these features of apparent differentiation could be uncoupled from therapeutic response; they were also stimulated by AG120 in the context of TET2 knockout, despite the lack of anti-tumor efficacy observed in this setting. Indeed, in the liver, where mature hepatocyte cells have long lifespan and retain high proliferative capacity, differentiation itself would not be expected to have analogous anti-tumor effects to those observed in hematopoietic malignancies. It remains possible that — while not sufficient — this hepatocyte differentiation program is indeed necessary for AG120 response. In this regard, hepatocytes possess intrinsic antiviral mechanisms that increase sensitivity to inflammatory cytokines (74,75) and, more generally, switches in cell lineage identity and associated cell surface antigens have been shown to increase CD8+ T cell anti-tumor immunity (76).
As for most genetic subsets of the disease, patients with mIDH1 ICC have poor outcomes upon treatment with current standard of care chemotherapy or immune checkpoint blockade. Divergent molecularly targeted therapeutic strategies are currently being explored preclinically and clinically for these tumors. The uncertain contributions of mIDH1 to tumor maintenance have prompted multiple studies aimed at identifying synthetic lethal therapeutic interactions with mIDH as a treatment approach, rather than inhibiting the mutant enzyme (11,14,40,41,43,44). On the other hand, mIDH itself is a particularly attractive target on which to base therapeutic strategies because of the very high specificity of mIDH inhibitors for the mutant tumor cells and consequent low systemic toxicity (32,34). Indeed, the increased progression-free survival conferred by Ivosidenib/AG120 in the phase III trial for mIDH1 ICC is an encouraging clinical advance, although the modest objective response rate highlights the need to understand the biological roles of mutant IDH in the ongoing growth of these tumors to inform further clinical development. Our studies in an aggressive ICC model reveal mechanisms by which mIDH1 supports tumor maintenance and show that inhibition of the mutant enzyme engenders sensitivity to immunotherapy.
In summary, we conclude that mIDH1 functions as an atypical oncogene in this model of advanced ICC, whose inhibition suppresses tumor growth in a manner that is fully dependent on intact immune function. The restoration of T cell immunity via the IFNγ-TET2 axis following mIDH1 inhibition and the preclinical efficacy of combined CTLA4 blockade provide a rational foundation for advancing immunotherapy in the treatment of mIDH1 ICC.
Methods
RESOURCE AVAILABILITY
Lead Contact
Further information and requests for resources and reagents should be directed to and will be fulfilled by the Lead Contact, Nabeel Bardeesy (bardeesy.nabeel@mgh.harvard.edu)
Materials Availability
• Mouse lines generated in this study may be available upon request.
• This study did not generate new unique reagents.
• All other relevant data is available upon request.
Data and Code Availability
Sorted tumor RNA-seq data have been deposited in the ArrayExpress database at EMBL-EBI (www.ebi.ac.uk/arrayexpress) under accession number E-MTAB-11112. 10X single-cell RNA sequencing data that support the findings of this study have been deposited in the GEO database under accession number GSE173612. Nanostring data is in Supplementary table S2.
Experimental Model and Subject Details
Mice
Mice were housed in pathogen-free animal facilities. All experiments were approved by the Massachusetts General Hospital (MGH) IACUC (protocols 2005N000148 and 2019N000116).
Mice were housed in pathogen-free animal facilities. Mouse strains including 129SF1 (Jackson Laboratories, #101043, RRID: IMSR_JAX:101043), C57Bl/6 (Jackson Laboratories, #000664, RRID: IMSR_JAX:000664), B6.Cg-Speer6-ps1Tg(Alb-cre)21Mgn (Jackson Laboratories, #003574, RRID: IMSR_JAX:003574), and NOD.CB17-PrkdcscidIl2rgtm1Wjl (Jackson Laboratories, #005557; RRID: IMSR_JAX:005557) were obtained from Jackson Laboratories. LSL-KrasG12D (Jackson Laboratories, #008179, RRID: IMSR_JAX: 008179) mice were kindly provided by D. Tuveson and T. Jacks. Mice were maintained on a mixed 129SF1/C57Bl/6 background and cross-bred at mendelian frequency to generate the Alb-Cre (C), Cre-Kras (CK), Cre-Kras-IDH1R132H (CKIR132H), Cre-Kras-IDH1R132C (CKIR132C) genotypes. Data presented include both male and female mice. Wildtype mice from littermate or B6129SF1/J (JAX #101043) used for subcutaneous (s.c.) and orthotopic injection were aged between 6–8 weeks at the time of implantation. Experimental groups were matched for age and sex. All experiments were carried out according to institutional guidelines at Massachusetts General Hospital. Mouse genotypes were monitored with routine genotyping of each litter and bred selectively in line with IACUC prescribed protocols.
Human Samples
Patient biopsy samples were collected and analyzed after written informed consent to the institutional tissue collection protocol, and approval by the Massachusetts General Hospital (MGH) institutional review board and Internal Review Board (IRB) of the Dana-Farber/Harvard Cancer Center (DFCI Protocol Nos.: 19–699, 14–046, and 13–416) –approved protocol and in accordance with the Declaration of Helsinki.
Cell Lines
Murine IDH1R132C intrahepatic cholangiocarcinoma (ICC) cell lines 2205 (male), 2275–4 (female), and 4411 (female) were derived from B6/129SF1 background CKIR132C ICC mice. The murine ICC IDH1R132H cell line, R132H was derived from a B6/129SF1 background CKIR132H ICC mouse. Murine ICC IDH1wt cell lines, 158 (male), 215 (female), and 254 (male) were derived from B6/129SF1 background CKP mice. ICC cell lines were validated by RT-qPCR (See Supplementary Figure 3A). The JF001 murine hepatocellular carcinoma (HCC) cell line used for comparative mRNA expression was derived from a Mst1/Mst2 KO GEMM (77). All of the above cell lines were cultured in RPMI 1640 [+] L-Glutamine, 25 mM HEPES (Corning, Cat# 10–041-CV) containing 10% FBS (GIBCO, Cat# 11995040) and 1% penicillin-streptomycin (PS) (GIBCO, Cat# 15140122). HEK293T cells used for packaging lentivirus were cultured in DMEM (GIBCO, Cat# 11995040) containing 10% FBS (GIBCO, Cat# 11995040) and 1% PS (GIBCO, Cat# 15140122). All cells were cultured using standard procedures in a 37°C humidified incubator with 5% CO2. Cells were tested routinely for mycoplasma using the PCR-based Venor™ GeM Mycoplasma Detection Kit (Sigma-Aldrich).
METHOD DETAIL
Generation of the latent LSL-Idh1 (R132H) knock-in mouse strain
To construct the latent LSL-Idh1R132H knock-in allele, the Idh1-containing locus was cloned from a bacterial artificial chromosome library. The targeting vector was generated by inserting a floxed Stop cassette (Lox-STOP-Lox into the mouse genomic Idh1 locus upstream of a modified exon 3 engineered to contain a G → A transition in codon 132. The construct was then electroporated into 129S6 embryonic stem (ES) cells. Targeted cells were selected by standard techniques and verified by Southern blot analysis. Blastocyst injections were carried out with three different targeted clones and transmitting chimeric mice were bred to generate the LSL-Idh1 (R132H) allele.
Generation of the latent Idh1 (R132C) knock-in mouse strain
To generate the latent IDH1R132C knock-in mouse strain, CRISPR/Cas9-mediated genome engineering in zygotes (78) was performed at the Harvard University Genome Modification Facility. In brief, LSL-Idh1(R132H) zygotes were subject to piezo-driven cytoplasmic injection of single-stranded IDH1R132C DNA donor, Cas9 protein (PNA Bio), and in vitro transcribed and purified sgRNAs against the IDH1 R132H locus. Following embryo transfer, offspring were genotyped by sequencing 800 bp surrounding the Idh1 R132 genomic locus. Multiple founders with the desired conversion of the LSL-IDH1R132H allele to the LSL-IDH1R132C allele were bred to the Albumin-Cre mouse strain and progeny for each founder were tested for (R)-2HG production in the liver. Four sequence- and (R)-2HG-validated founder lines were selected for further experimental study. Offspring were successively crossed with LSL-KRASG12D mice.
Histological characterization of GEM model
The following compound mutant mouse strains were studied for liver cancer and associated phenotypes: C (Alb-Cre), CIR132C (Alb-Cre; Idh1R132C), CIR132H (Alb-Cre; Idh1R132H), CK (Alb-Cre; KrasG12D), CKIR132H (Alb-Cre; KrasG12D; Idh1R132H) and CKIR132C (Alb-Cre; KrasG12D; Idh1R132C) cohorts. All experiments were performed on >85% C57/Bl/6 background. Hematoxylin and eosin staining was performed by iHisto (Salem, MA; iHisto.io). Formalin-fixed tumor samples were processed, embedded in paraffin, sectioned at 4 μm, and stained with hematoxylin and eosin. Histological characterization was performed in a manner blinded to genotype by an experienced gastrointestinal cancer pathologist (Vikram Deshpande, M.D.). The histological classification of each primary tumor and metastatic tumors reported in Supplementary Figure 1F–G was determined by evaluation of cross-sectional slides from two axes. Intrahepatic cholangiocarcinoma (ICC) was identified by morphological examination and validated by CK19 staining. For the cumulative analysis in Supplementary Figure 1G, the histological type representing the largest cross-sectional area (ICC or HCC) of each tumor-bearing mouse was reported as was the presence of each histological type in any proportion. Most CK, CIR132C, and CIR132H mice did not develop tumors, and those that did all exhibited HCC features as the predominant malignant phenotype with minor presence of ICC or undifferentiated tumor fractions. CKIR132H mice exhibited intermediate features with a phenotype dominated by HCC with undifferentiated tumor fractions, and with very rare presence of frank ICC. CKIR132C mice exhibited a phenotype dominated by ICC, and some mice developed the mixture presentation of ICC and HCC.
Survival Analysis
Groups were assigned based on regular genotyping of each litter and included both male and female mice. All mice included in the survival analysis were euthanized when criteria for disease burden were reached (including abdominal distension that impeded movement, loss of >15% of body weight, labored breathing, and/or abnormal posture). Overall survival refers to all mice that were euthanized based on poor body condition and includes tumors and other causes of morbidity (e.g., hepatomegaly). Tumor-free survival refers to the age of mice that were euthanized based on poor body condition and were found to have liver tumors as the primary morbidity. Additionally, ICC-free survival was monitored and recorded when mice meet criteria for disease burden with tumors dominated by ICC. Kaplan-Meyer estimators of survival were used to visualize the survival curves. Significant differences between groups were determined by log-rank test (p<0.001).
Tumor Dissociation, Cell Isolation, and Sorting
Mice were euthanized and tumors were dissected, then rinsed in ice-cold PBS (GIBCO) + 3% FBS (GIBCO) and cut into <3mm pieces with surgical scissors. Tumor fragments were then dissociated to single cell suspensions using the Miltenyi Mouse Tumor Dissociation Kit (Miltenyi, Cat# 130–096-730, RRID:SCR_020285) and gentleMacs Octo-Dissociator (Miltenyi, #130–095-937) on program 37C_m_TDK_2 as described by the manufacturer’s protocols. Following dissociation, reactions were quenched with 10 mL of ice-cold RPMI1640 (Corning) + 1%FBS (GIBCO) and strained through a 70 μM filter. In order to separate tumor cells from stromal cells or to isolate tumor infiltrating CD8+ T cells, the filtrate was then incubated with the Non-Tumor Cell Depletion Cocktail (Miltenyi, Cat# 130–110-187) or CD8 (TIL) MicroBeads for mouse (Miltenyi, Cat# 130–116-478) for 15 mins at 4°C, respectively. The samples were then magnetically separated by elution through a Miltenyi LS column (Miltenyi, Cat# 130–042-401) that was mounted on a MacsMultistand (Miltenyi, #130–042-303) as described by the manufacturer’s protocols. The isolated tumor cells were centrifuged at 1200 rpm for 5 minutes at 4°C and proceeded for further application or stored at −80°C.
Generation of Cell Lines
Mice exhibiting poor body condition or abdominal distension were euthanized in accordance with guidelines established by our institution’s IACAC. Upon necropsy, tumors were proceeded as “Tumor Dissociation, Cell Isolation, and Sorting” described. Cell pellet was resuspended in DMEM + 1% FBS before the cell suspension was spun down once more. Cells were then resuspended in RPMI 1640 containing 25 mM HEPES and 100 μg/mL L-Glutamine (CORNING) supplemented with 10% FBS (GIBCO) and 1% penicillin-streptomycin and seeded at a density of >3×10⁶ cells on a 6 cm collagen-coated plate. Cells were passaged at least five times until they were free of all fibroblasts. Cells were detached from the plate using 0.25% Trypsin-EDTA (GIBCO). IDH1 mutant cell lines were validated by confirmation of elevated 2-HG levels via mass spectrometry and by qRT-PCR analysis of ICC markers.
Immunoblotting
Tumor samples for immunoblotting were thawed and suspended in Invitrogen Lysis buffer (Invitrogen) supplemented with Pierce Halt™ Protease and Phosphatase Inhibitor Cocktail (Thermofisher). Tumor fragments were mechanically homogenized using a Precellys 24 Tissue Homogenizer (Bertin Instruments) and 2.8 mm disruptor beads (Bertin Instruments). Cell line samples for western blot analysis were lysed in similarly prepared Invitrogen Lysis buffer RIPA buffer. Lysates were then sonicated on ice for 6 minutes with a Bioruptor UCD-200 (Diagenode) and centrifuged. Total protein amounts were measured with Pierce BCA Protein Assay (Thermofisher) and sample concentrations were normalized with a lysis buffer. Samples were run on Tris-Glycine SDS polyacrylamide gels and transferred to PVDF membranes. Membranes were incubated overnight at 4°C with antibodies to Stat1 (Cell Signaling, Cat# 9172; RRID:AB_2198300, 1:1000), Phospho-Stat1 (Y701) (Cell Signaling Technology Cat# 5375, RRID:AB_10860071, 1:1000), Phospho-Stat1 (S727) (Cell Signaling, Cat# 8826; RRID:AB_2773718; 1:1000), β-Actin (Sigma Aldrich, Cat# A5316; Clone: AC-74; RRID:AB_476743; 1:10,000), and GAPDH (Thermo Fisher Scientific Cat# AM4300, RRID:AB_2536381; 1:10,000) suspended in 1X TBS-T with 5% (w/v) BSA (Thermofisher). After washing, membranes were then incubated with corresponding HRP-coupled secondary antibodies for 1 hr at RT on a platform shaker. Primary antibody binding was detected using an enhanced chemiluminescent substrate and imaged with a BioRad ChemiDoc Imaging System (BioRad).
mIDH1 Cell Viability Upon AG120 Treatment in vitro
The IDH1R132C cell lines, 2275–4, 4411, and 2205, were cultured in RPMI 1640 containing 25 mM HEPES and 100 μg/mL L-Glutamine (CORNING) supplemented with 10%FBS (GIBCO) and 1%PS (GIBCO) and seeded in triplicate onto a white clear-bottomed 96 well plate at a density of 1×10⁴ cells per well. Cells were treated with either 1 μM AG120 or DMSO for a period of five days. On day five of treatment, cell viability was measured using the CellTiter-Glo® Luminescent Cell Viability Assay (ProMega, Cat#G7573) in accordance with manufacturer recommended protocols.
Immunohistochemistry staining
Immunohistochemistry staining was performed by iHisto Inc. (Salem, MA; iHisto.io) Samples were processed, embedded in paraffin, and sectioned at 4 μm. Paraffin sections were then deparaffinized and hydrated using the following steps: 15 min in xylene twice; 5, 5, and 5 min in 100%, 100%, and 75% ethanol, respectively; and 5 min in PBS at room temperature repeated three times. Antigen retrieval was achieved by boiling the sections in 10 mM sodium citrate for 10 min in a microwave oven and 5 min of cooling at room temperature. Sections were then washed with PBS three times, treated with 3% H2O2 for 15 min and 5% bovine serum albumin for 20 min. The sections were incubated with primary antibodies Rabbit anti-CD8 (Cell Signaling Technology Cat# 98941, RRID:AB_2756376; 1:400) overnight at 4 °C. Subsequently, the sections were immunohistochemically stained with horseradish peroxidase-conjugated Goat anti-rabbit secondary antibodies (Thermo Fisher Scientific, Cat# G-21234, RRID: AB_2536530; 1:2000) for 50 min at room temperature. After incubation with the DAB Kit (Thermo Scientific). Whole slide scanning (40x) was performed on an EasyScan infinity (Motic).
Multiplex immunofluorescence staining (Normal)
Immunofluorescence staining was performed by iHisto Inc. (Salem, MA; iHisto.io) Samples were processed, embedded in paraffin, and sectioned at 4 μm. Paraffin sections were then deparaffinized and hydrated using the following steps: 15 min in xylene twice; 5, 5, and 5 min in 100%, 100%, and 75% ethanol, respectively; and 5 min in PBS at room temperature repeated three times. Antigen retrieval was achieved by boiling the sections in 10 mM sodium citrate for 10 min in a microwave oven and 5 min of cooling at room temperature. Sections were then washed with PBS three times, treated with 3% H2O2 for 15 min and 5% bovine serum albumin for 20 min. The sections were incubated with Rabbit anti-ki67 (Servicebio, Cat# GB13030–2; 1:500) and Mouse anti-panCK (Novus, Cat# NBP-29429; 1:200) overnight at 4 °C. Subsequently, the sections were immunohistochemically stained with CY3-conjugated goat anti-Rabbit (# A10520, Invitrogen, 1:2000) and FITC-conjugated Goat anti-Mouse (FITC), Thermo Fisher Scientific Cat# A10520, RRID:AB_2534029) for 50 min at room temperature. After incubation with the DAPI. Whole slide scanning (40x) was performed on a Panoramic midi scanner (3D histech).
Multiplex immunofluorescence staining (TSA)
Immunofluorescence staining was performed by iHisto Inc. (ihisto.io) Samples were processed, embedded in paraffin, and sectioned at 4 μm. Paraffin sections were then deparaffinized and hydrated using the following steps: 15 min in xylene twice; 5, 5, and 5 min in 100%, 100%, and 75% ethanol, respectively; and 5 min in PBS at room temperature repeated three times. Antigen retrieval was achieved by boiling the sections in 10 mM sodium citrate for 10 min in a microwave oven and 5min of cooling at room temperature. Sections were then washed with PBS three times, treated with 3% H2O2 for 15 min and 5% bovine serum albumin for 20min. The sections were incubated with the primary antibody rabbit Anti-Foxp3 (Cell Signaling Technology Cat# 12653, RRID: AB_2797979; 1:1000) overnight at 4°C. Sections were rinsed with PBS and incubated with secondary antibody horseradish peroxidase-conjugated Goat anti-rabbit secondary antibodies (Thermo Fisher Scientific, Cat# G-21234, RRID:AB_2536530; 1:2000) for 50 min at room temperature. After rinsing with PBS, sections were incubated for 10 minutes at room temperature in Alexa Fluor™ 555 Tyramide Reagent (Thermo Fisher Scientific, Cat# B40955). Antigen retrieval was achieved by boiling the sections in 10 mM sodium citrate for 10 min in a microwave oven and 5min of cooling at room temperature. Sections were then washed with PBS three times, treated with 3% H2O2 for 15 min, and 5% bovine serum albumin for 20min. The sections were incubated with Rabbit anti-CD4 (Cell Signaling Technology Cat# 25229, RRID:AB_2798898; 1:500) and Mouse anti-panCK (Novus, Cat# NBP-29429 1:200) overnight at 4 °C. Subsequently, the sections were immunohistochemically stained with CY5 conjugated goat anti-Rabbit (Thermo Fisher Scientific Cat# A-21245, RRID:AB_2535813; 1:2000) and FITC conjugated Goat anti-Mouse (FITC) (Thermo Fisher Scientific Cat# A16073, RRID:AB_2534746; 1:2000) for 50 min at room temperature. After incubation with the DAPI. Whole slide scanning (40x) was performed on a Panoramic midi scanner (3D histech).
In vitro T Cell Isolation and stimulation
In order to isolate murine T cells, healthy B6129SF1 (Jackson Laboratories, #101043, RRID: IMSR_JAX:101043) mice, aged 6–12 weeks old, were euthanized and their spleens were collected. Using antiseptic technique, spleens were then placed on a 70μM cell strainer (Fisher Scientific) and ground down with a rubber plunger. The cell filtrate was collected in a 50 mL conical tube and spun down (350xg, 5 mins, RT). The supernatant was gently decanted, and the pellet was resuspended in 5 mL of ACK Red Blood Cell Lysis Buffer (GIBCO) and incubated for 5 mins at RT. The solution was quenched with 45 mL of PBS and centrifuged (350xg, 5 mins, RT). The supernatant was aspirated, and the pellet was resuspended in 10mL of sterile MACS buffer (PBS, 0.5% BSA w/v). The live cells were counted using a glass hemocytometer before being centrifuged again (350xg, 5 mins, RT). The pellet was resuspended in 40 μL of MACS buffer per 10 million cells and transferred to a microcentrifuge tube. Using the naïve CD8+ T Cell Isolation Kit (Miltenyi, Cat# 130–096-543) according to manufacturer protocols, non-target cells were magnetically labelled. The cell suspension was then passed through a Miltenyi LS column mounted on a MACS Multistand (Miltenyi) and CD8+ T cells were collected in the flow-through. The filtrate was spun down (350xg, 5 mins, RT) and the cells were counted using a hemocytometer. Adjusting the concentration to 1 million cells/mL with RPMI 1640, IL-2 (BioLegend, Cat# 575404) was added to a final concentration of 100 U/mL, 2 μM 2-ME (Sigma-Aldrich) and Dynabeads mouse T-Activator CD3/CD28 beads (1:4 ratio) (Thermo Fisher Scientific, Cat# 11456D) was added to the culture. The cells were plated at 1 million cells per well and placed in the incubator for two days. On day 3, once it was evident that the cells were healthy and proliferating, the cells were collected and the anti-CD3/CD28 antibody coated magnetic beads was removed. The cells were centrifuged (350xg, 5 mins, RT) and counted while maintaining continuous IL-2 stimulation. Cells were expanded and kept in resting state by plating at 1 million cells per mL on appropriate culture plates.
Mitochondrial respiration and glycolysis measurement
Mitochondrial respiration and glycolysis were measured by oxygen consumption and extracellular acidification rate, respectively, using the XF Cell Mito Stress Test kit (Seahorse Bioscience). After pretreatment with (R)-2HG and stimulation with anti-CD3- and anti-CD28-coated beads (1:4), 500,000 resting CD8+ T cells per well were seeded on poly-D-lysine-coated Seahorse XF96 Cell Culture Microplate in RPMI 1640 Base Medium (US Biological, R9011, pH 7.4) supplemented with 10 mM glucose, 2 mM glutamine, and 1 mM sodium-pyruvate (all Sigma-Aldrich). Assays were performed using the XF Cell Mito Stress Test Kit (Seahorse Bioscience) according to manufacturer’s instructions using 1.5 μM oligomycin to inhibit ATP synthase, 1 μM FCCP to uncouple oxygen consumption from ATP production, and 0.5 μM rotenone/antimycin A to stop electron transport chain, on an XFe96 analyzer (Seahorse Bioscience). Data were analyzed with Wave software (Seahorse Bioscience) and plotted after export into Microsoft Excel.
Detection of global 5hmc level by DNA dot blot assay
Genomic DNA was denatured in 0.1 M NaOH, 10 mM EDTA at 95 °C for 10 min, and then neutralized by adding an equal volume of 20X Saline Sodium Citrate (SSC) buffer and immediately chilled on ice. Next, the denatured DNA samples (along with the 2-fold diluted sample: 500 ng, 250 ng, 125 ng and 62.5 ng) were spotted on an Amersham Hybond N+ membrane (GE Healthcare) by Bio-Dot (BIO-RAD). Then, the membrane was washed with 3X SCC twice and air dried for 20 minutes on Whitman paper. The membrane was then UV-cross-linked and blocked with Blocking Solution 5% milk, PBST (1×PBS + 0.1%Tween-20) overnight at 4 °C. After blocking, the membrane was incubated with polyclonal 5-hmC antibody (Active Motif, #39769, RRID: AB_10013602; 1:5000) and HRP-conjugated secondary antibody (Vector Laboratories, #PI-1000–1, RRID: AB_2313606; 1:5000) then visualized by SuperSignal West Dura Chemiluminescent Substrate (Thermo Scientific, Cat# 34075).
In Vitro Methylated DNA Immunoprecipitation
2205 TET2 (+) and 2205 TET2 (–) cells were cultured in RPMI1640 [+] L-glutamine 25mM HEPES (CORNING) 10%FBS (GIBCO) + 1%PS (GIBCO) and treated with either 1 μM AG120 or 10 μL DMSO for five days. On the fourth day of treatment, samples were either administered 50 ng/μL murine IFN-γ or 10 μL DMSO and incubated for 24 hours at 37°C. Cells were washed with D-PBS, scraped, collected, and centrifuged for 5 mins at 1200 rpm before being stored overnight at −80°C. DNA was extracted from cell pellets using the Zymo Research Quick-DNA Miniprep Kit as described by the manufacturer. 15 μg of genomic DNA from each sample was then sheared to ~400bp fragments using a Bioruptor UCD-200 (Diagenode) at high power for three 15-minute cycles running at 30 second on/off increments. Shearing of genomic DNA to 300bp-500bp sized fragments was confirmed by electrophoresis on a 1.5% agarose gel followed by UV transillumination. Immunoprecipitation was conducted using the Active Motif MeDIP kit (Active Motif, Cat# 55009) as described by the manufacturer. Following immunoprecipitation, the DNA was purified using the Qiaquick PCR Purification kit (Qiagen, Cat# 28014) according to the manufacturer-supplied protocol. Purified sheared DNA was used for downstream qPCR analysis.
RNA Extraction, Reverse Transcription, and Real-Time qPCR
Single-cell suspensions from dissociated tumors and cells cultured in a monolayer were homogenized in 300–600 μL of TRIzol™. RNA was extracted from homogenized samples using the Direct-zol® RNA Miniprep Plus kit (ZYMO RESEARCH, Cat# R2072) in accordance with the manufacturer-prescribed protocol. Total RNA was quantified and assessed for quality using a Nanodrop™ spectrophotometer (Thermofisher). Subsequently, 1000 ng of RNA from each sample was converted to cDNA using the Quantitect Reverse Transcription kit (Qiagen, Cat# 205311) as directed by the manufacturer. cDNA as well as genomic DNA isolated by immunoprecipitation were quantitatively amplified using Universal SYBR Green (BioRad). Samples were processed using a CFX384 Touch Real-Time PCR Detection System (BioRad) and relative mRNA expression was normalized to Actb or Gapdh controls. Primers targeting genes associated with biliary differentiation were custom selected from overlapping lists of trademark hepatic and biliary genes as described by Aizarani et al and MacParland et al (79,80). Primer sequences are listed in Supplementary Table S3.
Nanostring nCounter Immune Profiling
Total RNA was extracted as described above. RNA concentrations were quantified and evaluated for purity using a nanodrop spectrophotometer (Thermofisher, # ND-ONE-W). For immune profiling we utilized Nanostring’s 770-gene Mouse nCounter® PanCancer Immune Profiling Panel. Reporter codesets were thawed at room temperature and subsequently mixed with 70 μL of hybridization buffer to form a master mix. From this master mix, 8 μL was aliquoted into PCR tubes. RNA samples were normalized to 10 ng/uL and 5 μL from each sample was added into the PCR tubes. Next, 2uL of Capture probeset was added to each tube. The reaction mixture was then gently mixed, spun down, and loaded into a prewarmed 65°C thermocycler with a heated lid set to 70°C. Samples were allowed to hybridize for 16–20 hours, after which they were immediately placed on ice. At this time, a SPRINT cartridge was thawed and allowed to equilibrate to RT. Samples were then individually loaded into the cartridge and inserted into the NanoString nCounter SPRINT Profiler machine (NanoString nCounter Analysis System, RRID:SCR_021712). Raw data was analyzed using NanoString nSolver 4.0. mRNA counts were processed to account for hybridization efficiency, background noise, and sample content, and were normalized using the geometric mean of housekeeping genes.
RNA sequencing of sorted tumor cells
Tumors were proceeded as “Tumor Dissociation, Cell Isolation, and Sorting” described. RNA was extracted as described above in accordance with the manufacturer-prescribed protocol. Total RNA was quantified and assessed for quality using a NanodropTM spectrophotometer (Thermofisher). RNA sequencing (RNA-Seq) library preparation used the NEBNext® Ultra™ Directional RNA Library Prep Kit for Illumina by following the manufacturer’s recommendations (NEB). Briefly, mRNA was first enriched with NEBNext® rRNA Depletion Kit v2 (Human/Mouse/Rat) with RNA Sample Purification Beads. Enriched mRNAs were fragmented for 15 minutes at 94°C. First-strand and second-strand cDNA were subsequently synthesized. cDNA fragments were end repaired and adenylated at the 3′ ends, and universal adapter was ligated to cDNA fragments, followed by index addition and library enrichment with limited-cycle PCR. Sequencing libraries were validated using a DNA Chip on the Agilent 2100 Bioanalyzer (Agilent Technologies) and quantified by using Qubit 2.0 Fluorometer (Thermo Fisher Scientific–Invitrogen). The constructed library was submitted to GENEWIZ (South Plainfield, NJ). Total RNA was sequenced on Illumina HiSeq 3000 (2×150, paired end) and aligned to the mouse mm10 reference genome using TopHat. The gene expression values (FPKM) were calculated with Cufflinks and significant changes in transcript expression were determined with Cuffdiff. After extraction of gene hit counts, the gene hit counts table was used for downstream differential expression analysis. Using DESeq2, a comparison of gene expression between the groups of samples was performed. The Wald test was used to generate P values and log2 fold changes. Genes with adjusted P values less than 0.05 and absolute log2 fold changes greater than 1 were called as differentially expressed genes for each comparison.
Single cell RNA sequencing of tumor-infiltrating immune cells
Eight mice were orthotopically implanted with 106 CKIR132C ICC cells. The tumors were allowed seven days to develop masses and were administered an AG120 treatment regimen for six days. Tumors were dissected from mice on day thirteen post-inoculation, disassociated using the Miltenyi Mouse Tumor Dissociation Kit and gentleMACS Octo-Dissociator (Miltenyi) as per manufacturer’s instructions. After filtering through a 70-mm filter, live cells were isolated using a gradient with Lympholyte-M separation media (Fisher Scientific) as per manufacturer’s instructions. Tumor-infiltrating lymphocytes were enriched by CD45+ MACS positive selection (Miltenyi, Cat# 130–052-301). Four representative samples each of Vehicle-treated and AG120-treated tumors were selected and droplet-based isolation of single cells was performed with the Chromium Controller (10X Genomics). Subsequent generation of 5′ sequencing libraries was performed as per manufacturer’s instructions (10X Genomics). Characterization of the sequencing library was performed with TapeStation (Agilent) and Qubit (ThermoFisher) instruments.
Pooled equimolar 5’ 10X output libraries were sequenced using an Illumina SP flow cell using paired-end 91bp reads and downstream preprocessing steps were performed using cellranger version 3.0.1. Individual replicate quality was evaluated based on the number of cells recovered, mean reads per cell, and median genes per cell. Early QC metrics determined no replicates should be excluded. After initial processing, 43,359 cells were recovered across conditions. Additional cell filtering and downstream analysis was performed using Scanpy version 1.7 (81) to evaluate the number of genes recovered per cell and the percentage of mitochondrial genes. Cells with more than 2500 genes were excluded as suspected doublets, while cells that had less than 500 genes were excluded due to poor gene capture. Cells with greater than 10 percent mitochondrial gene content were excluded. The resulting filtering left 39,810 immune cells. In addition, genes that were not recovered in any cell were also excluded from the downstream analysis.
Gene counts per cell were normalized so that every cell has the same total gene count after normalization. The resulting gene counts matrix were then log (1 + p) transformed, where p is the gene transcript count. Principal component analysis and nearest neighborhood graphs were calculated in order to visualize on a umap projection. Harmony was then used to correct PCA embeddings for technical batch effects between replicates (82). Cells were then grouped into 19 distinct clusters using the leiden algorithm. Cell type classification and labeling was done by calculating differentially expressed marker genes, which can be found in Supplementary Table S4. To gain more granularity between the T and NK cell subtypes, sub clustering was performed on cells in clusters expressing Cd8a, Cd4, and Ncr1 transcripts. New PCA embeddings, nearest neighborhood graphs, and harmony batch corrections were calculated for this subgroup on a set of 10,000 highly variable genes.
Gene set scoring was performed by using the average expression of genes in a given geneset and subtracting from a reference set of genes. Differentially expressed genes between treatment conditions were calculated using a logistic regression model (83). Ranked lists of differential genes were created using signed p-values calculated by the logistic regression model and passed to GSEA Prerank to search for enriched genesets by treatment (84,85).
Quantitative flow cytometry tumor immune profiling
Cells were stained either with a panel of lymphocyte-associated antibodies against CD8a (BioLegend, Cat# 100705; Clone: 53–6.7 RRID:AB_312744; 1:100), CD4 (BioLegend, Cat# 116023; Clone: RM4–4; RRID:AB_2800579; 1:100), CD45 (BioLegend, Cat# 103155; Clone: 30-F11; RRID:AB_2650656; 1:200), and LIVE/DEAD™(Thermo Fisher Scientific, Cat# L34957; 1:1000), Granzyme B (BioLegend, Cat# 515403; Clone: GB11; RRID:AB_2114575; 1:100), IFN-γ (BioLegend, Cat# 505808; Clone: XMG1.2; RRID:AB_315402; 1:100), TNF-α (BioLegend, Cat# 506321; Clone: MP6-XT22; RRID:AB_961435; 1:100), H-2Kb/H-2Db (BioLegend Cat# 114608, RRID:AB_313599).
Generation of Tet2 or Ifngr1 Knockout Cell Lines Using SCAR Technology
Tet2- or Ifngr1 knockout tumor cells were generated using Selective CRISPR Antigen Removal (SCAR), a novel lentiviral system which eliminates immunogenic CRISPR-associated neoantigens from virally transduced cell lines. sgRNAs targeting Tet2 or Ifngr1 were designed using an online tool (www.benchling.com/crispr). sgRNA sequences are listed on Supplementary Table S3. To package the SCAR-Cas9 lentivirus, HEK293T cells were co-transfected with pSCAR-Cas9-hygro_GFP ( (63), Addgene, Cat# 162075, RRID:Addgene_162075), psPAX2 (Addgene, Cat# 12260, RRID:Addgene_12260), and pMD2.G (Addgene, Cat# 12259, RRID:Addgene_12259) introduced via X-tremeGene™ 9 DNA Transfection Reagent (Roche, Cat# XTG9-RO). Viral medium was collected for three days, filtered, and stored at 4°C. On the third day, 2205 cells were incubated with filtered viral medium and 4 μg/mL polybrene (MilliporeSigma™, Cat# TR-1003). At 24- and 48-hours post-infection, the medium was replaced with fresh viral medium. Cells were negatively selected with hygromycin (200 μg/mL) over the course of one week, after which GFP-positive cells were isolated by flow cytometry. SCAR-Cas9 expressing cells were transduced with lentivirus containing pSCAR_sgRNA_pruo-mkate-lox2272 (Addgene, Cat# 162076, RRID:Addgene_162076) vectors ligated with either Tet2- or Ifngr1- specific sgRNA or a control vector (prepared as described above). Successfully transduced cells were selected with puromycin (2μg/mL) over the course of 5 days before GFP/mKate2 double-positive cells were isolated by flow cytometry. We then floxed out the CRISPR-associated neoantigens by transfecting HEK293T cells with a modified psPAX2 (psPAX2_D64V, Addgene_63586, RRID:Addgene_63586) to produce a non-integrative Cre-expressing lentivirus, which was administered to both the sgControl and sgTet2-1, sgTet2-2, sgIfngr1 cells continuously for three days. Ten days following Cre transduction, GFP/mKate2-double-negative cells were isolated by flow cytometry. Tet2 or Ifngr1 knockouts were confirmed by Sanger sequencing of genomic DNA, realtime PCR or immunoblotting. Successful removal of CRISPR-associated neoantigens was confirmed by western blotting with a Cas9 specific antibody (Cell Signaling Technology Cat# 14697, RRID:AB_2750916; 1:1000).
Syngeneic Tumor Models, Treatment, and Analysis
In Vivo Implantation and Growth Monitoring of Tumor Cells
Cultured tumor cells were dissociated into single cell suspensions with 0.25% Trypsin (GIBCO) and rinsed twice with D-PBS (GIBCO), counted, and suspended in 1:1 mixture of D-PBS (GIBCO) and growth factor reduced matrigel (Corning). Mice for s.c (subcutaneous) models were briefly anesthetized and injected s.c. on the rear flank with 1×10⁶ ICC cells. These studies used the following GEMM-derived cell lines: the CKIR132C cell lines, 2205, or any of its genetically engineered derivatives (2275–4 and 4411), or the CKP cell line, 215 or 254. Once tumors were observed to reach 100 mm3 in volume, animal groups were randomized, and treatment was administered by group. During subcutaneous tumor experiments, tumor growth was monitored twice a week by measuring tumor size with a digital caliper and tumor volume was calculated with the formula length x width2 where the shorter of the two measurements was used as width. In accordance with institutional guidelines, mice with masses measuring >20mm in diameter were euthanized. For orthotopic allograft models, mice were anesthetized under 2.5% isoflurane and injected with 1×10⁶ tumor cells directly to the lobe of the liver using the CKIR132C cell lines, 2205 and 2275–4. Following injection, the peritoneum and skin were sutured with silk (5–0G, Ethilon). In pilot studies, mice were euthanized at serial time points to define the kinetics of engraftment and growth of the orthotopic tumors and thereby determine the time post-injection to begin treatment studies using these models. These studies established that orthotopic tumors of size 150cm3 developed by 10 days, which was subsequently selected as the start point for therapeutic studies. Researchers were not blinded throughout conducting the experiments. Tumor growth was not affected by sex of the host-mouse.
AG120 monotherapy
Five days following s.c. or orthotopic tumor cell inoculation, groups of wildtype littermates, C57BL/6/129SF1 or NOD-scid ilr2−/− mice were administered either: (1) Vehicle preparation of 0.5% Methyl Cellulose (cP 400) + 4.5% HPMC-ACS + 0.2% Tween 80 in water b.i.d. via oral gavage, or (2) AG120 (Agios Pharmaceuticals) administered b.i.d. via oral gavage at a dose of 150 mg/kg. For GEM model for AG120 treatment, in pilot studies, CKIR132C mice were euthanized at serial time points to define the kinetics of tumor formation. Mice were monitored for palpable tumor at 40–45 weeks to determine the time to begin AG120 treatment. The administration of AG120 followed the statement above. Following the completion of the planned treatment regimen, all tumor samples were collected for further analysis within 1 hour of final dosage.
AG120 Efficacy Following CD8 Depletion
αCD8β antibody (Bio X Cell Cat# BE0223, RRID:AB_2687706) or IgG1 Isotype control (200 μg per mice, Bio X Cell Cat# BE0088, RRID:AB_1107775) was administered (200 μg per mouse) by intraperitoneal injection 3 days prior to inoculation with tumor cells and was continued at the same dose once every four days throughout treatment. Five days following s.c. tumor cell-inoculation, mice were administered AG120 therapy as described above.
Combination AG120/αPD-1 ICB Therapy
Seven days post-inoculation, mice were randomized to receive one of the following regimens: (1) Vehicle (described above) followed by IgG1 Isotype control (200 μg per mice, Bio X Cell Cat# BE0088, RRID:AB_1107775) injected intraperitoneally starting at Day-0 and continuing once every three days; (2) AG120 administered b.i.d. via oral gavage at 150 mg/kg followed by intraperitoneal injection of IgG1 Isotype starting at Day-0 and continuing once every three days; (3) Vehicle followed by one 200 mg dose of αPD-1 antibody (Bio X Cell Cat# BE0146, RRID:AB_10949053) injected intraperitoneally at Day-0 and continuing once every three days; (4) AG120 administered b.i.d. via oral gavage at 150 mg/kg followed by intraperitoneal injection of 100 μg αPD-1 antibody starting at Day-0 and continuing once every three days.
Combination AG120/αCTLA-4 ICB Therapy
Five days following s.c. tumor inoculation, mice were randomized to receive one of the following regimens: (1) Vehicle (described above) followed by 200 μg of IgG2b Isotype control (Bio X Cell Cat# BE0086, RRID:AB_1107791) injected intraperitoneally starting at Day-0 and continuing once every three days; (2) AG120 administered b.i.d. via oral gavage at 150 mg/kg followed by intraperitoneal injection of IgG1 Isotype starting at Day-0 and continuing once every three days; (3) Vehicle followed by one 200 μg dose of αCTLA-4 antibody (Bio X Cell Cat# BE0164, RRID:AB_10949609) injected intraperitoneally at Day-0 and continuing once every three days; (4) AG120 administered b.i.d. via oral gavage at 150 mg/kg followed by intraperitoneal injection of 200 mg αCTLA-4 antibody starting at Day-0 and continuing once every three days.
Immune memory rechallenges
Tumor-naive immunocompetent wildtype mice and mice cured by the AG120 + anti-CTLA4 therapy 125 days after primary challenge were injected s.c. with 1×10⁶ cells, using a CKIR132C primary ICC cells (the 2205 cell line). Mice were monitored for serial changes in tumor volume for 50 days or until tumor-burden required euthanasia.
Luminex cytokine assay
Media from cultures were collected and stored at −80 °C. Before testing the conditioned media were thawed on ice. The media were tested with MILLIPLEX MAP MOUSE CYTOKINE/CHEMOKINE MAGNETIC BEAD Panel kit (Millliopore, Cat#: MCYTMAG-70K-PX32) according to manufacturer’s instructions. The data was analyzed with Milliplex Analyst software. Fold changes relative to the control were calculated and plotted as log2FC. Lower and upper limits of quantitation (LLOQ/ULOQ) were imputed from standard curves for cytokines above or below detection.
LC-MC/MS AG-120 Measurement in Plasma and Tumor:
The concentrations of AG120 in plasma and tumor samples were determined using liquid chromatography with tandem mass spectrometry (LC-MS/MS) methods. Tumor samples were homogenized using a FastPrep homogenizer for 60 seconds, with 10 volumes (volume-by-weight [v/w]) of methanol:water (80:20 [v/v]) to get a homogenate with a dilution factor of 11. Calibration standards and quality control (QC) samples were prepared in blank mouse plasma. A 10-μL aliquot of calibration standards, QCs, unknown plasma, and tumor homogenate were mixed with 200 μL of acetonitrile containing the internal standard (IS) AGI-0018070 (25 ng/mL) for protein precipitation. The mixture was vortexed at 800 rpm for 4 min and centrifuged at 4000 rpm for 10 min at 4°C. A 100‑μL aliquot of supernatant was mixed with 100 μL of water, vortexed and then analyzed on a SCIEX Triple Quad™ 6500+ with Exion LC™ AD system. A reversed-phase gradient method using a Waters ACQUITY UPLC HSS T3 Column (100Ã, 1.8μm, 2.1 mm X 50 mm) maintained at 50 °C, provided chromatographic separation. Water with 0.1% formic acid and acetonitrile with 0.1% formic acid were used as mobile phase A and B respectively, at a total flow rate of 600 μL/min. AG-120 and the IS were ionized under a positive ion electrospray mode and detected through the multiple-reaction monitoring (MRM) transitions of m/z 583.2/214.0 and m/z 587.3/214.0. Data was acquired using Analyst 1.6.3 (AB Sciex, Foster City, CA). The standard curve had a coefficient of determination (R2) value >0.98 in a linear regression with 1/X2 weighting. The quality control samples had a precision and accuracy within 20% of theoretical values. The peak area ratios of analyte relative to IS were used for AG-120 quantitation. Linearity was achieved in the AG-120 concentration range from 1 ng/mL to 30,000 ng/mL.
GC-MS analysis for total 2HG
The method was adapted from Elia et al (86)10 mg/mL 2HG stock solution was prepared in water. 1 mg/mL glutaric acid stock solution was also prepared in water. 75 μL of glutaric acid stock solution was premixed with 30 mL of milli-Q water and 50 mL of methanol (extraction solvent 1, ES1), and was stored at −20°C until extraction. Chloroform was prechilled at −20°C until extraction (extraction solvent 2, ES2). Calibration standards was prepared by serial dilution of 2HG stock solution by using methanol and dried by using speedvac. 800 μL of ES1 and 500 μL of ES2 were added to 20 μL of culture media samples or cell pellet samples. Samples were vortexed for 10 min and centrifuged for 10 min at 21300 rcf. Upper phase was collected and transferred to new microtubes and dried by using speedvac. 20 mg/mL Methoxyamine hydrochloride solution (MOX) was freshly prepared in pyridine. 15 μL of MOX was added to each dried sample, and samples were resuspended in the MOX, vortexed and spun down, and heated at 37°C for 90 min. 30 uL of TBDMS was added to each dried sample. Samples were vortexed, heated at 60°C for 60 min, and centrifuged for 5 min at 21300 rcf. Supernatant was transferred to glass inserts, and was analyzed by using GC-MS.
An Agilent 7890B GC system was coupled to an Agilent 5977B single quadrupole mass spectrometer equipped with an electron ionization source. Automated injections were performed with an Agilent 7693 autosampler. The injector temperature was held constant at 270 °C. Injections of 1 μL were made in splitless mode. Chromatography was performed on a HP-5ms Ultra Inert Column (30 m x 0.25 mm, 0.25 μm film thickness, Agilent). Helium carrier gas was used at a constant flow of 1ml/min. At the beginning of the experiments, the GC oven temperature program was 100 °C initial temperature with 3 min hold time and ramping at 2.5 °C/min to a final temperature of 300 °C with 2 min hold time. After that, in order to reduce the runtime, the GC oven temperature program was modified to be 100 °C initial temperature with 3 min hold time and ramping at 10 °C/min to a final temperature of 300 °C with 12 min hold time. The transfer line temperature was 250 °C, and the source temperature was 230 °C. After a solvent delay of 5.5 min, mass spectra were acquired at 2.9 scans/s with a mass range of 50 to 550 m/z. Data processing was performed with MassHunter Workstation Software Quantitative Analysis (Version B.09.00 / Build 9.0.647.0, for GCMS and LCMS.
Enzymatic measurement of (R)-2-HG in GEMM livers
10 mg liver samples were collected from 11-week-old CK, CKIR132C and CKIR132H mice immediately following euthanasia. Tissue samples were snap-frozen and stored at −80°C. Enzymatic measurement of (R)-2-HG was performed using the the BioVision Colorimetric D-2-Hydroxyglutarate (D2HG/(R)-2HG) Assay Kit (BioVision, Cat# K213) according to manufacturer’s protocol with slight modification. In brief, samples were thawed, suspended in 100 mL of ice-cold D2HG Assay Buffer, and mechanically disrupted. After a 10-minute incubation on ice, samples were centrifuged at 10,000 x g, 4°C for 5 min, and the supernatant was collected for separation of small molecule fraction by Amicon low molecular weight cutoff filter (Millipore Sigma, Cat# UFC201024). 30 mL of each sample was added to three wells of a 96-well plate and designated either internal control, sample, or background. (R)-2-HG enzyme was administered to the internal control and sample wells while a blank was added to the background well. The internal control was dosed with 5 nmol of (R)-2-HG and the samples were incubated for 1 hour at 37°C. Samples were measured using a spectrophotometer OD450nm and (R)-2HG amount was calculated by subtracting the ODbackground from each sample and following the equation:
Quantification and Statistical Analysis
Semi-automated IHC quantification
Scanned IHC slides were analyzed using QuPath, a free, open-source software for bioimaging analysis (https://qupath.github.io). Depending on the size of tissue, five to ten different 1600μm2 areas (40X magnification field) of each tumor that exhibited clear ICC phenotypes and were free of necrosis were selected. Signal positive cells were quantitated by automated positive cell selection analysis at a fixed threshold and maximum background intensity across all samples. HPF was calculated by averaging these values for each sample.
Quantification and statistical analysis
Statistical tests were performed with GraphPad Prism software. An unpaired two-tailed student t-test was used to determine significant difference between two variables (Figures: 1C, 2D–2G, 2I–2L, 3D, 3F, 4A–4G, 5B–5G, 5K, 6A–6E, 6G; Supplementary Figures: S1B, S3C, S3D, S3I–S3L, S3N–R, S4G–H, S5A–S5G, S5J–L, S6A, S6D–E, S7A, S7D–L, S7O–R, S8A–B, S8D, S8G). Log-rank test was used to determine statistically significant difference between two or more Kaplan-Meier survival curves (Figures: 1D, 6J; Supplementary Figures: S1D, S1E, S8I). * p < 0.05, ** p < 0.01, *** p < 0.001, **** p < 0.0001, ns p > 0.05. Statistics were performed and graphs were generated in Prism v9.10 (Graphpad).
Gene set enrichment analysis
To test whether gene sets were enriched in response to different conditions, we utilized GSEA MsigDB gene set enrichment analysis for hallmark gene signatures (84,85)and liver-specific geneset: “HSIAO_LIVER_SPECIFIC_GENES” (87)(http://software.broadinstitute.org/gsea/msigdb) as well as a gene list of HNF4α target genes from TRANSFAC Predicted Transcription Factor Targets (http://gene-regulation.com/) (Supplementary Table S5)(88). Hallmarks with enrichment scores (ES) greater than 1.7 and possessing an FDR q-value < 0.2 were considered significantly enriched.
Supplementary Material
Statement of significance.
Mutant IDH1 inhibition stimulates cytotoxic T cell function and de-repression of the DNA demethylating enzyme, TET2, which is required for tumor cells to respond to interferon-γ. The discovery of mechanisms of treatment efficacy and the identification of synergy by combined CTLA4 blockade provide the foundation for new therapeutic strategies.
Acknowledgements:
This work was supported by the following sources: NCI SPORE P50 CA127003, the Gallagher Chair in Gastrointestinal Cancer Research, ProjectLiv, and TargetCancer Foundation (to N. Bardeesy), NIH R01-HG010646 (to R.M. Kohli). Cholangiocarcinoma Foundation Postdoctoral Fellowship and American Cancer Society Postdoctoral Fellowship PF-20-136-01-TBG (to M. J. Wu). The Cholangiocarcinoma Foundation Christopher J. Wilke Memorial Research Fellowship, MGH Fund for Discovery, MGH Excellence Award, NCI K99CA245194, and NCI SPORE P50CA127003 (to L. Shi). The authors would like to thank C-J. Lio, W-L Wang, R. Mostoslavsky, W. Y. Kim, L. Ellisen, and A.X. Zhu for their critical reading of the manuscript.
Declaration of Interests
L. Goyal is a consultant/advisory board member for Alentis Therapeutics AG, Black Diamond, Basilea, Exelixis, H3Biomedicine, Incyte Corporation, QED Therapeutics, Servier, Sirtex Medical Ltd, Taiho Oncology Inc, serves on Data Safety Monitoring Committees for AstraZeneca and receives grant/research support (to institution) from Adaptimmune, Bayer, Eisai, Merck, Macrogenics, Genentech, Novartis, Incyte, Eli Lilly, Loxo Oncology, Relay Therapeutics, QED, Taiho Oncology, Leap Therapeutics, Bristol Meyers Squibb, Nucana, Servier. C. Hudson, S. Ronseaux, and B. Nicolay were employees of Agios Pharmaceuticals. R. Jenkins reports other support from Xsphera Biosciences and other support from Monopteros Therapeutics outside the submitted work. R. T. Manguso reports grants from Calico Life Sciences LLC and personal fees from Bristol Myers Squibb outside the submitted work. N. Bardeesy reports grants from NIH/NCI, grants and personal fees from Agios Pharma, grants from TargetCancer, grants from ProjectLiv, and grants from Cholangiocarcinoma Foundation during the conduct of the study. No potential conflicts of interest were disclosed by the other authors.
REFERENCES
- 1.Borger DR, Tanabe KK, Fan KC, Lopez HU, Fantin VR, Straley KS, et al. Frequent Mutation of Isocitrate Dehydrogenase (IDH)1 and IDH2 in Cholangiocarcinoma Identified Through Broad-Based Tumor Genotyping. Oncol. 2012;17:72–9. [DOI] [PMC free article] [PubMed] [Google Scholar]
- 2.Waitkus MS, Diplas BH, Yan H. Biological Role and Therapeutic Potential of IDH Mutations in Cancer. Cancer Cell. 2018;34:186–95. [DOI] [PMC free article] [PubMed] [Google Scholar]
- 3.Ye D, Guan K-L, Xiong Y. Metabolism, Activity, and Targeting of D- and L-2-Hydroxyglutarates. Trends in Cancer. 2018;4(2):151–165. [DOI] [PMC free article] [PubMed] [Google Scholar]
- 4.Lowery MA, Ptashkin RN, Jordan EJ, Berger MF, Zehir A, Capanu M, et al. Comprehensive molecular profiling of intra- and extrahepatic cholangiocarcinomas: potential targets for intervention. Clin Cancer Res. 2018;24:clincanres.0078.2018. [DOI] [PMC free article] [PubMed] [Google Scholar]
- 5.Ward PS, Patel J, Wise DR, Abdel-Wahab O, Bennett BD, Coller HA, et al. The Common Feature of Leukemia-Associated IDH1 and IDH2 Mutations Is a Neomorphic Enzyme Activity Converting α-Ketoglutarate to 2-Hydroxyglutarate. Cancer Cell. 2010;17:225–34. [DOI] [PMC free article] [PubMed] [Google Scholar]
- 6.Dang L, White DW, Gross S, Bennett BD, Bittinger MA, Driggers EM, et al. Cancer-associated IDH1 mutations produce 2-hydroxyglutarate. Nature. 2009;462:739–44. [DOI] [PMC free article] [PubMed] [Google Scholar]
- 7.Xu W, Yang H, Liu Y, Yang Y, Wang P, Kim S-H, et al. Oncometabolite 2-Hydroxyglutarate Is a Competitive Inhibitor of α-Ketoglutarate-Dependent Dioxygenases. Cancer Cell. 2011;19:17–30. [DOI] [PMC free article] [PubMed] [Google Scholar]
- 8.Losman J-A, Koivunen P, Kaelin WG. 2-Oxoglutarate-dependent dioxygenases in cancer. Nat Rev Cancer. 2020;20:710–26. [DOI] [PubMed] [Google Scholar]
- 9.Chowdhury R, Yeoh KK, Tian Y, Hillringhaus L, Bagg EA, Rose NR, et al. The oncometabolite 2-hydroxyglutarate inhibits histone lysine demethylases. Embo Rep. 2011;12:463–9. [DOI] [PMC free article] [PubMed] [Google Scholar]
- 10.Figueroa ME, Abdel-Wahab O, Lu C, Ward PS, Patel J, Shih A, et al. Leukemic IDH1 and IDH2 Mutations Result in a Hypermethylation Phenotype, Disrupt TET2 Function, and Impair Hematopoietic Differentiation. Cancer Cell. 2010;18:553–67. [DOI] [PMC free article] [PubMed] [Google Scholar]
- 11.McBrayer SK, Mayers JR, DiNatale GJ, Shi DD, Khanal J, Chakraborty AA, et al. Transaminase Inhibition by 2-Hydroxyglutarate Impairs Glutamate Biosynthesis and Redox Homeostasis in Glioma. Cell. 2018;175:101–116.e25. [DOI] [PMC free article] [PubMed] [Google Scholar]
- 12.Sasaki M, Knobbe CB, Itsumi M, Elia AJ, Harris IS, Chio IIC, et al. D-2-hydroxyglutarate produced by mutant IDH1 perturbs collagen maturation and basement membrane function. Gene Dev. 2012;26:2038–49. [DOI] [PMC free article] [PubMed] [Google Scholar]
- 13.Wang P, Wu J, Ma S, Zhang L, Yao J, Hoadley KA, et al. Oncometabolite D-2-Hydroxyglutarate Inhibits ALKBH DNA Repair Enzymes and Sensitizes IDH Mutant Cells to Alkylating Agents. Cell Reports. 2015;13:2353–61. [DOI] [PMC free article] [PubMed] [Google Scholar]
- 14.Sulkowski PL, Oeck S, Dow J, Economos NG, Mirfakhraie L, Liu Y, et al. Oncometabolites suppress DNA repair by disrupting local chromatin signalling. Nature. 2020;582:586–91. [DOI] [PMC free article] [PubMed] [Google Scholar]
- 15.Carbonneau M, Gagné LM, Lalonde M-E, Germain M-A, Motorina A, Guiot M-C, et al. The oncometabolite 2-hydroxyglutarate activates the mTOR signalling pathway. Nat Commun. 2016;7:12700. [DOI] [PMC free article] [PubMed] [Google Scholar]
- 16.Koivunen P, Lee S, Duncan CG, Lopez G, Lu G, Ramkissoon S, et al. Transformation by the (R)-enantiomer of 2-hydroxyglutarate linked to EGLN activation. Nature. 2012;483:484–8. [DOI] [PMC free article] [PubMed] [Google Scholar]
- 17.Kohanbash G, Carrera DA, Shrivastav S, Ahn BJ, Jahan N, Mazor T, et al. Isocitrate dehydrogenase mutations suppress STAT1 and CD8+ T cell accumulation in gliomas. J Clin Invest. 2017;127:1425–37. [DOI] [PMC free article] [PubMed] [Google Scholar]
- 18.Bunse L, Pusch S, Bunse T, Sahm F, Sanghvi K, Friedrich M, et al. Suppression of antitumor T cell immunity by the oncometabolite (R)-2-hydroxyglutarate. Nat Med. 2018;24:1192–203. [DOI] [PubMed] [Google Scholar]
- 19.Amankulor NM, Kim Y, Arora S, Kargl J, Szulzewsky F, Hanke M, et al. Mutant IDH1 regulates the tumor-associated immune system in gliomas. Gene Dev. 2017;31:774–86. [DOI] [PMC free article] [PubMed] [Google Scholar]
- 20.Leca J, Fortin J, Mak TW. Illuminating the cross-talk between tumor metabolism and immunity in IDH-mutated cancers. Curr Opin Biotech. 2021;68:181–5. [DOI] [PubMed] [Google Scholar]
- 21.Ward PS, Lu C, Cross JR, Abdel-Wahab O, Levine RL, Schwartz GK, et al. The Potential for Isocitrate Dehydrogenase Mutations to Produce 2-Hydroxyglutarate Depends on Allele Specificity and Subcellular Compartmentalization*. J Biol Chem. 2013;288:3804–15. [DOI] [PMC free article] [PubMed] [Google Scholar]
- 22.Lemonnier F, Cairns RA, Inoue S, Li WY, Dupuy A, Broutin S, et al. The IDH2 R172K mutation associated with angioimmunoblastic T-cell lymphoma produces 2HG in T cells and impacts lymphoid development. Proc National Acad Sci. 2016;113:15084–9. [DOI] [PMC free article] [PubMed] [Google Scholar]
- 23.Saha SK, Parachoniak CA, Ghanta KS, Fitamant J, Ross KN, Najem MS, et al. Mutant IDH inhibits HNF-4α to block hepatocyte differentiation and promote biliary cancer. Nature. 2014;513:110–4. [DOI] [PMC free article] [PubMed] [Google Scholar]
- 24.DiNardo CD, Stein EM, de Botton S, Roboz GJ, Altman JK, Mims AS, et al. Durable Remissions with Ivosidenib in IDH1-Mutated Relapsed or Refractory AML. New Engl J Med. 2018;378:2386–98. [DOI] [PubMed] [Google Scholar]
- 25.Intlekofer AM, Shih AH, Wang B, Nazir A, Rustenburg AS, Albanese SK, et al. Acquired resistance to IDH inhibition through trans or cis dimer-interface mutations. Nature. 2018;559:125–9. [DOI] [PMC free article] [PubMed] [Google Scholar]
- 26.Stein E, Yen K. Targeted Differentiation Therapy with Mutant IDH Inhibitors: Early Experiences and Parallels with Other Differentiation Agents. Annu Rev Cancer Biology. 2017;1:379–401. [Google Scholar]
- 27.Wang F, Travins J, DeLaBarre B, Penard-Lacronique V, Schalm S, Hansen E, et al. Targeted Inhibition of Mutant IDH2 in Leukemia Cells Induces Cellular Differentiation. Science. 2013;340:622–6. [DOI] [PubMed] [Google Scholar]
- 28.Yen K, Travins J, Wang F, David MD, Artin E, Straley K, et al. AG-221, a First-in-Class Therapy Targeting Acute Myeloid Leukemia Harboring Oncogenic IDH2 Mutations. Cancer Discov. 2017;7:478–93. [DOI] [PubMed] [Google Scholar]
- 29.Amary MF, Bacsi K, Maggiani F, Damato S, Halai D, Berisha F, et al. IDH1 and IDH2 mutations are frequent events in central chondrosarcoma and central and periosteal chondromas but not in other mesenchymal tumours. J Pathology. 2011;224:334–43. [DOI] [PubMed] [Google Scholar]
- 30.Yan H, Parsons DW, Jin G, McLendon R, Rasheed BA, Yuan W, et al. IDH1 and IDH2 Mutations in Gliomas. New Engl J Medicine. 2009;360:765–73. [DOI] [PMC free article] [PubMed] [Google Scholar]
- 31.Lu C, Ward PS, Kapoor GS, Rohle D, Turcan S, Abdel-Wahab O, et al. IDH mutation impairs histone demethylation and results in a block to cell differentiation. Nature. 2012;483:474–8. [DOI] [PMC free article] [PubMed] [Google Scholar]
- 32.Abou-Alfa GK, Macarulla T, Javle MM, Kelley RK, Lubner SJ, Adeva J, et al. Ivosidenib in IDH1-mutant, chemotherapy-refractory cholangiocarcinoma (ClarIDHy): a multicentre, randomised, double-blind, placebo-controlled, phase 3 study. Lancet Oncology. 2020;21(6):796–807. [DOI] [PMC free article] [PubMed] [Google Scholar]
- 33.Mellinghoff IK, Ellingson BM, Touat M, Maher E, Fuente MIDL, Holdhoff M, et al. Ivosidenib in Isocitrate Dehydrogenase 1 – Mutated Advanced Glioma. J Clin Oncol. 2020;38:3398–406. [DOI] [PMC free article] [PubMed] [Google Scholar]
- 34.Zhu AX, Macarulla T, Javle MM, Kelley RK, Lubner SJ, Adeva J, et al. Final results from ClarIDHy, a global, phase III, randomized, double-blind study of ivosidenib (IVO) versus placebo (PBO) in patients (pts) with previously treated cholangiocarcinoma (CCA) and an isocitrate dehydrogenase 1 ( IDH1 ) mutation. J Clin Oncol. 2021;39:266–266. [Google Scholar]
- 35.Johannessen T-CA, Mukherjee J, Viswanath P, Ohba S, Ronen SM, Bjerkvig R, et al. Rapid Conversion of Mutant IDH1 from Driver to Passenger in a Model of Human Gliomagenesis. Am Assoc Cancer Res. 2016;14:molcanres.0141.2016. [DOI] [PMC free article] [PubMed] [Google Scholar]
- 36.Mazor T, Chesnelong C, Pankov A, Jalbert LE, Hong C, Hayes J, et al. Clonal expansion and epigenetic reprogramming following deletion or amplification of mutant IDH1. Proc National Acad Sci. 2017;114:10743–8. [DOI] [PMC free article] [PubMed] [Google Scholar]
- 37.Moure CJ, Diplas BH, Chen LH, Yang R, Pirozzi CJ, Wang Z, et al. CRISPR Editing of Mutant IDH1 R132H Induces a CpG Methylation-Low State in Patient-Derived Glioma Models of G-CIMP. Mol Cancer Res. 2019;17:2042–50. [DOI] [PMC free article] [PubMed] [Google Scholar]
- 38.Núñez FJ, Mendez FM, Kadiyala P, Alghamri MS, Savelieff MG, Garcia-Fabiani MB, et al. IDH1-R132H acts as a tumor suppressor in glioma via epigenetic up-regulation of the DNA damage response. Sci Transl Med. 2019;11:eaaq1427. [DOI] [PMC free article] [PubMed] [Google Scholar]
- 39.Inoue S, Li WY, Tseng A, Beerman I, Elia AJ, Bendall SC, et al. Mutant IDH1 Downregulates ATM and Alters DNA Repair and Sensitivity to DNA Damage Independent of TET2. Cancer Cell. 2016;30:337–48. [DOI] [PMC free article] [PubMed] [Google Scholar]
- 40.Sulkowski PL, Corso CD, Robinson ND, Scanlon SE, Purshouse KR, Bai H, et al. 2-Hydroxyglutarate produced by neomorphic IDH mutations suppresses homologous recombination and induces PARP inhibitor sensitivity. Sci Transl Med. 2017;9:eaal2463. [DOI] [PMC free article] [PubMed] [Google Scholar]
- 41.Tateishi K, Wakimoto H, Iafrate AJ, Tanaka S, Loebel F, Lelic N, et al. Extreme Vulnerability of IDH1 Mutant Cancers to NAD+ Depletion. Cancer Cell. 2015;28:773–84. [DOI] [PMC free article] [PubMed] [Google Scholar]
- 42.Sulkowski PL, Oeck S, Dow J, Economos NG, Mirfakhraie L, Liu Y, et al. Oncometabolites suppress DNA repair by disrupting local chromatin signalling. Nature. 2020;582:586–91. [DOI] [PMC free article] [PubMed] [Google Scholar]
- 43.Wang Y, Wild AT, Turcan S, Wu WH, Sigel C, Klimstra DS, et al. Targeting therapeutic vulnerabilities with PARP inhibition and radiation in IDH-mutant gliomas and cholangiocarcinomas. Sci Adv. 2020;6:eaaz3221. [DOI] [PMC free article] [PubMed] [Google Scholar]
- 44.Chan SM, Thomas D, Corces-Zimmerman MR, Xavy S, Rastogi S, Hong W-J, et al. Isocitrate dehydrogenase 1 and 2 mutations induce BCL-2 dependence in acute myeloid leukemia. Nat Med. 2015;21:178–84. [DOI] [PMC free article] [PubMed] [Google Scholar]
- 45.Gao J, Aksoy BA, Dogrusoz U, Dresdner G, Gross B, Sumer SO, et al. Integrative Analysis of Complex Cancer Genomics and Clinical Profiles Using the cBioPortal. Sci Signal. 2013;6:pl1–pl1. [DOI] [PMC free article] [PubMed] [Google Scholar]
- 46.Cerami E, Gao J, Dogrusoz U, Gross BE, Sumer SO, Aksoy BA, et al. The cBio Cancer Genomics Portal: An Open Platform for Exploring Multidimensional Cancer Genomics Data. Cancer Discov. 2012;2:401–4. [DOI] [PMC free article] [PubMed] [Google Scholar]
- 47.Consortium TAPG. AACR Project GENIE: Powering Precision Medicine through an International Consortium. Cancer Discov. 2017;7:818–31. [DOI] [PMC free article] [PubMed] [Google Scholar]
- 48.O’Dell MR, Huang JL, Whitney-Miller CL, Deshpande V, Rothberg P, Grose V, et al. KrasG12D and p53 Mutation Cause Primary Intrahepatic Cholangiocarcinoma. Cancer Res. 2012;72:1557–67. [DOI] [PMC free article] [PubMed] [Google Scholar]
- 49.Fan B, Abou-Alfa GK, Zhu AX, Pandya SS, Jia H, Yin F, et al. Pharmacokinetics/pharmacodynamics (PK/PD) of ivosidenib in patients with mutant IDH1 advanced cholangiocarcinoma from the phase III ClarIDHy study. J Clin Oncol. 2020;38:539–539. [Google Scholar]
- 50.Anderson KG, Stromnes IM, Greenberg PD. Obstacles Posed by the Tumor Microenvironment to T cell Activity: A Case for Synergistic Therapies. Cancer Cell. 2017;31:311–25. [DOI] [PMC free article] [PubMed] [Google Scholar]
- 51.Hu J, Zhao Q, Kong L-Y, Wang J, Yan J, Xia X, et al. Regulation of tumor immune suppression and cancer cell survival by CXCL1/2 elevation in glioblastoma multiforme. Sci Adv. 2021;7:eabc2511. [DOI] [PMC free article] [PubMed] [Google Scholar]
- 52.Li J, Byrne KT, Yan F, Yamazoe T, Chen Z, Baslan T, et al. Tumor Cell-Intrinsic Factors Underlie Heterogeneity of Immune Cell Infiltration and Response to Immunotherapy. Immunity. 2018;49:178–193.e7. [DOI] [PMC free article] [PubMed] [Google Scholar]
- 53.Parker BS, Rautela J, Hertzog PJ. Antitumour actions of interferons: implications for cancer therapy. Nat Rev Cancer. 2016;16:131–44. [DOI] [PubMed] [Google Scholar]
- 54.Dutta R, Zhang TY, Köhnke T, Thomas D, Linde M, Gars E, et al. Enasidenib drives human erythroid differentiation independently of isocitrate dehydrogenase 2. J Clin Invest. 2020;130:1843–9. [DOI] [PMC free article] [PubMed] [Google Scholar]
- 55.Richardson LG, Choi BD, Curry WT. (R)-2-hydroxyglutarate drives immune quiescence in the tumor microenvironment of IDH-mutant gliomas. Transl Cancer Res. 2019;8:S167–70. [DOI] [PMC free article] [PubMed] [Google Scholar]
- 56.Zhang L, Romero P. Metabolic Control of CD8+ T Cell Fate Decisions and Antitumor Immunity. Trends Mol Med. 2018;24:30–48. [DOI] [PubMed] [Google Scholar]
- 57.Miller BC, Sen DR, Abosy RA, Bi K, Virkud YV, LaFleur MW, et al. Subsets of exhausted CD8+ T cells differentially mediate tumor control and respond to checkpoint blockade. Nat Immunol. 2019;20:326–36. [DOI] [PMC free article] [PubMed] [Google Scholar]
- 58.Sade-Feldman M, Yizhak K, Bjorgaard SL, Ray JP, de Boer CG, Jenkins RW, et al. Defining T Cell States Associated with Response to Checkpoint Immunotherapy in Melanoma. Cell. 2018;175:998–1013.e20. [DOI] [PMC free article] [PubMed] [Google Scholar]
- 59.Siddiqui I, Schaeuble K, Chennupati V, Marraco SAF, Calderon-Copete S, Ferreira DP, et al. Intratumoral Tcf1+PD-1+CD8+ T Cells with Stem-like Properties Promote Tumor Control in Response to Vaccination and Checkpoint Blockade Immunotherapy. Immunity. 2019;50:195–211.e10. [DOI] [PubMed] [Google Scholar]
- 60.Fujimoto A, Furuta M, Totoki Y, Tsunoda T, Kato M, Shiraishi Y, et al. Whole-genome mutational landscape and characterization of noncoding and structural mutations in liver cancer. Nat Genet. 2016;48:500–9. [DOI] [PubMed] [Google Scholar]
- 61.Losman J-A, Koivunen P, Kaelin WG. 2-Oxoglutarate-dependent dioxygenases in cancer. Nat Rev Cancer. 2020;20:710–26. [DOI] [PubMed] [Google Scholar]
- 62.Xu Y, Lv L, Liu Y, Smith MD, Li W-C, Tan X, et al. Tumor suppressor TET2 promotes cancer immunity and immunotherapy efficacy. J Clin Invest. 2019;129:4316–31. [DOI] [PMC free article] [PubMed] [Google Scholar]
- 63.Dubrot J, Lane-Reticker SK, Kessler EA, Ayer A, Mishra G, Wolfe CH, et al. In vivo screens using a selective CRISPR antigen removal lentiviral vector system reveal immune dependencies in renal cell carcinoma. Immunity. 2021; 54(3):571–585.e6. [DOI] [PubMed] [Google Scholar]
- 64.Garcia-Diaz A, Shin DS, Moreno BH, Saco J, Escuin-Ordinas H, Rodriguez GA, et al. Interferon Receptor Signaling Pathways Regulating PD-L1 and PD-L2 Expression. Cell Reports. 2017;19:1189–201. [DOI] [PMC free article] [PubMed] [Google Scholar]
- 65.Togashi Y, Shitara K, Nishikawa H. Regulatory T cells in cancer immunosuppression — implications for anticancer therapy. Nat Rev Clin Oncol. 2019;16:356–71. [DOI] [PubMed] [Google Scholar]
- 66.Weinberg SE, Singer BD, Steinert EM, Martinez CA, Mehta MM, Martínez-Reyes I, et al. Mitochondrial complex III is essential for suppressive function of regulatory T cells. Nature. 2019;565:495–9. [DOI] [PMC free article] [PubMed] [Google Scholar]
- 67.Simpson TR, Li F, Montalvo-Ortiz W, Sepulveda MA, Bergerhoff K, Arce F, et al. Fc-dependent depletion of tumor-infiltrating regulatory T cells co-defines the efficacy of anti–CTLA-4 therapy against melanoma. J Exp Med. 2013;210:1695–710. [DOI] [PMC free article] [PubMed] [Google Scholar]
- 68.Foskolou IP, Barbieri L, Vernet A, Bargiela D, Cunha PP, Velica P, et al. The S enantiomer of 2-hydroxyglutarate increases central memory CD8 populations and improves CAR-T therapy outcome. Blood Adv. 2020;4:4483–93. [DOI] [PMC free article] [PubMed] [Google Scholar]
- 69.Tyrakis PA, Palazon A, Macias D, Lee KianL, Phan AnthonyT, Veliça P, et al. S-2-hydroxyglutarate regulates CD8+ T-lymphocyte fate. Nature. 2016;540:236–41. [DOI] [PMC free article] [PubMed] [Google Scholar]
- 70.Li J, Byrne KT, Yan F, Yamazoe T, Chen Z, Baslan T, et al. Tumor Cell-Intrinsic Factors Underlie Heterogeneity of Immune Cell Infiltration and Response to Immunotherapy. Immunity. 2018;49:178–193.e7. [DOI] [PMC free article] [PubMed] [Google Scholar]
- 71.Kamada T, Togashi Y, Tay C, Ha D, Sasaki A, Nakamura Y, et al. PD-1+ regulatory T cells amplified by PD-1 blockade promote hyperprogression of cancer. Proc National Acad Sci. 2019;116:201822001. [DOI] [PMC free article] [PubMed] [Google Scholar]
- 72.Rowshanravan B, Halliday N, Sansom DM. CTLA-4: a moving target in immunotherapy. Blood. 2018;131:58–67. [DOI] [PMC free article] [PubMed] [Google Scholar]
- 73.Aguado-Fraile E, Tassinari A, Ishii Y, Sigel C, Lowery MA, Goyal L, et al. Molecular and morphological changes induced by ivosidenib correlate with efficacy in mutant-IDH1 cholangiocarcinoma. Future Oncol. 2021;17(16):2057–2074. [DOI] [PubMed] [Google Scholar]
- 74.Lampl S, Janas MK, Donakonda S, Brugger M, Lohr K, Schneider A, et al. Reduced mitochondrial resilience enables non-canonical induction of apoptosis after TNF receptor signaling in virus-infected hepatocytes. J Hepatol. 2020;73:1347–59. [DOI] [PubMed] [Google Scholar]
- 75.Namineni S, O’Connor T, Faure-Dupuy S, Johansen P, Riedl T, Liu K, et al. A dual role for hepatocyte-intrinsic canonical NF-κB signaling in virus control. J Hepatol. 2020;72:960–75. [DOI] [PubMed] [Google Scholar]
- 76.Mahadevan NR, Knelson EH, Wolff JO, Vajdi A, Saigi M, Campisi M, et al. Intrinsic immunogenicity of small cell lung carcinoma revealed by its cellular plasticity. Cancer Discov. 2021;11(8):1952–1969. [DOI] [PMC free article] [PubMed] [Google Scholar]
- 77.Fitamant J, Kottakis F, Benhamouche S, Tian HS, Chuvin N, Parachoniak CA, et al. YAP Inhibition Restores Hepatocyte Differentiation in Advanced HCC, Leading to Tumor Regression. Cell Reports. 2015;10:1692–707. [DOI] [PMC free article] [PubMed] [Google Scholar]
- 78.Yang H, Wang H, Jaenisch R. Generating genetically modified mice using CRISPR/Cas-mediated genome engineering. Nat Protoc. 2014;9:1956–68. [DOI] [PubMed] [Google Scholar]
- 79.Aizarani N, Saviano A, Sagar Mailly L, Durand S, Herman JS, et al. A human liver cell atlas reveals heterogeneity and epithelial progenitors. Nature. 2019;572:199–204. [DOI] [PMC free article] [PubMed] [Google Scholar]
- 80.MacParland SA, Liu JC, Ma X-Z, Innes BT, Bartczak AM, Gage BK, et al. Single cell RNA sequencing of human liver reveals distinct intrahepatic macrophage populations. Nat Commun. 2018;9:4383. [DOI] [PMC free article] [PubMed] [Google Scholar]
- 81.Wolf FA, Angerer P, Theis FJ. SCANPY: large-scale single-cell gene expression data analysis. Genome Biol. 2018;19:15. [DOI] [PMC free article] [PubMed] [Google Scholar]
- 82.Korsunsky I, Millard N, Fan J, Slowikowski K, Zhang F, Wei K, et al. Fast, sensitive and accurate integration of single-cell data with Harmony. Nat Methods. 2019;16:1289–96. [DOI] [PMC free article] [PubMed] [Google Scholar]
- 83.Ntranos V, Yi L, Melsted P, Pachter L. A discriminative learning approach to differential expression analysis for single-cell RNA-seq. Nat Methods. 2019;16:163–6. [DOI] [PubMed] [Google Scholar]
- 84.Subramanian A, Tamayo P, Mootha VK, Mukherjee S, Ebert BL, Gillette MA, et al. Gene set enrichment analysis: A knowledge-based approach for interpreting genome-wide expression profiles. P Natl Acad Sci Usa. 2005;102:15545–50. [DOI] [PMC free article] [PubMed] [Google Scholar]
- 85.Mootha VK, Lindgren CM, Eriksson K-F, Subramanian A, Sihag S, Lehar J, et al. PGC-1α-responsive genes involved in oxidative phosphorylation are coordinately downregulated in human diabetes. Nat Genet. 2003;34:267–73. [DOI] [PubMed] [Google Scholar]
- 86.Elia I, Broekaert D, Christen S, Boon R, Radaelli E, Orth MF, et al. Proline metabolism supports metastasis formation and could be inhibited to selectively target metastasizing cancer cells. Nat Commun. 2017;8:15267. [DOI] [PMC free article] [PubMed] [Google Scholar]
- 87.HSIAO L-L, DANGOND F, YOSHIDA T, HONG R, JENSEN RV, MISRA J, et al. A compendium of gene expression in normal human tissues. Physiol Genomics. 2001;7:97–104. [DOI] [PubMed] [Google Scholar]
- 88.Matys V, Kel-Margoulis OV, Fricke E, Liebich I, Land S, Barre-Dirrie A, et al. TRANSFAC® and its module TRANSCompel®: transcriptional gene regulation in eukaryotes. Nucleic Acids Res. 2006;34:D108–10. [DOI] [PMC free article] [PubMed] [Google Scholar]
Associated Data
This section collects any data citations, data availability statements, or supplementary materials included in this article.
Supplementary Materials
Data Availability Statement
Sorted tumor RNA-seq data have been deposited in the ArrayExpress database at EMBL-EBI (www.ebi.ac.uk/arrayexpress) under accession number E-MTAB-11112. 10X single-cell RNA sequencing data that support the findings of this study have been deposited in the GEO database under accession number GSE173612. Nanostring data is in Supplementary table S2.