

Abstract
Introduction
This study established the psychometric properties and preliminary validity of the Stricker Learning Span (SLS), a novel computer adaptive word list memory test designed for remote assessment and optimized for smartphone use.
Methods
Women enrolled in the Mayo Clinic Specialized Center of Research Excellence (SCORE) were recruited via e‐mail or phone to complete two remote cognitive testing sessions. Convergent validity was assessed through correlation with previously administered in‐person neuropsychological tests (n = 96, ages 55–79) and criterion validity through associations with magnetic resonance imaging measures of neurodegeneration sensitive to Alzheimer's disease (n = 47).
Results
SLS performance significantly correlated with the Auditory Verbal Learning Test and measures of neurodegeneration (temporal meta‐regions of interest and entorhinal cortical thickness, adjusting for age and education). Test–retest reliabilities across two sessions were 0.71–0.76 (two‐way mixed intraclass correlation coefficients).
Discussion
The SLS is a valid and reliable self‐administered memory test that shows promise for remote assessment of aging and neurodegenerative disorders.
Keywords: aging, Alzheimer's disease, cortical thickness, entorhinal cortex, hippocampus, learning, Mayo Test Drive, mobile health, reliability, smartphone, Stricker Learning Span, Symbols Test, validity, web
1. INTRODUCTION
Remote cognitive assessment has transitioned from an important research goal 1 to an immediate research and clinical need due to COVID‐19. This need has underscored the lack of well‐validated, reliable, and well‐normed tests available for remote assessment. 2 This gap in reliable remote neuropsychological assessment tools available for research and clinical use is a barrier to assessing cognitive impairment in various research populations and for patients without easy access to medical centers. We have developed a web‐based Mayo Clinic Cognitive Testing Platform through implementation of a new agile‐inspired 3 model of test development, Mayo Test Drive (MTD): Test Development through Rapid Iteration, Validation and Expansion (DRIVE). The MTD platform is optimized for remote, unsupervised self‐administration and smartphone use, although participants can use any device with web access. Remote assessment via smartphone is necessary to reach the most users and eliminate potential health disparities. Rates of smartphone ownership are equal across Blacks, Hispanics, and Whites, and individuals with lower levels of education and income are more likely to be smartphone‐only internet users. 4 , 5 , 6
Identification and monitoring of early cognitive decline due to Alzheimer's disease (AD) is an important priority for the field. To help address the critical need for a sensitive and brief remote memory measure, we developed a computer adaptive word list learning test to detect the early changes in learning in preclinical and prodromal AD, 7 , 8 the Stricker Learning Span (SLS). We transformed the traditional verbal word list memory test paradigm in several ways, resulting in a novel supra‐span learning and memory paradigm that takes full advantage of computer‐based administration. The SLS uses computer adaptive testing principles that alter the difficulty of the test to match participant performance to extend the floor and ceiling. In addition, we included an open‐source measure of processing speed, the Symbols Test. 9 Processing speed measures are routinely incorporated in composite cognitive measures designed to detect early preclinical changes due to their known sensitivity to cognitive aging, AD, and other neurodegenerative disorders. 10
The aims of this study were to (1) demonstrate the feasibility of remote self‐administered cognitive measures (SLS, Symbols Test) completed via our new web‐based MTD platform; (2) determine the psychometric properties of these measures, including test–retest reliability; and (3) establish their preliminary convergent and criterion validity based on associations with traditional in‐person neuropsychological measures and magnetic resonance imaging (MRI) measures sensitive to early neurodegenerative changes in AD.
HIGHLIGHTS
Mayo Test Drive is a new web‐based platform optimized for unsupervised test administration.
Stricker Learning Span (SLS) is a computer adaptive word list memory test for Alzheimer's disease.
The SLS and Symbols Test show adequate psychometric properties and test–retest reliability.
The SLS and Symbols Test show convergent validity through correlations with in‐person tests.
The SLS shows criterion validity through significant associations with entorhinal and temporal lobe cortical thickness.
RESEARCH IN CONTEXT
Systematic Review: Authors reviewed the literature involving digital and remote cognitive assessment including validation and reliability studies. We also incorporated literature investigating cognitive changes in preclinical Alzheimer's disease (AD). While numerous publications have examined tele‐neuropsychology and digital tests, our work is the first to present data on the Stricker Learning Span (SLS) and the Mayo Test Drive platform. We provide additional data for the Symbols Test.
Interpretation: The SLS is a valid and reliable digital memory test that is associated with temporal lobe biomarkers of neurodegeneration in older women without dementia. Mayo Test Drive is a feasible platform for collecting self‐administered remote cognitive testing data via smartphone, tablet, or personal computer.
Future Directions: Future work is needed to examine the diagnostic accuracy of the SLS and Symbols Test in patients diagnosed with mild cognitive impairment and dementia, examine associations with AD positron emission tomography imaging biomarkers, and generate normative data.
2. METHOD
Participants were recruited from the Specialized Center of Research Excellence (SCORE) on Sex Differences study that enrolls women aged 55 years and older who can read and speak English and provide informed consent. SCORE participants undergo in‐person assessments of physical and cognitive function, and a subset participate in neuroimaging studies.
SCORE participants who agreed to be contacted for additional studies were invited to participate in this remote, web‐based substudy. Recruitment procedures involved a combination of e‐mails via REDCap and phone calls. No remuneration was provided. Access to a smartphone, tablet, or personal computer with internet connection was required. A retest e‐mail request was sent 1 week after completion of a first session, with reminder e‐mails or phone calls provided as needed. The study protocol was approved by the Mayo Clinic Institutional Review Board. All participants provided informed consent.
2.1. Stricker Learning Span
Words are visually presented to facilitate reliable self‐administration and ensure consistency across device types. Item memory after each learning trial is tested via four‐choice recognition (see Figure 1). Participants receive a one‐word practice item to ensure comprehension of task instructions. If incorrect across three practice trial attempts, the SLS is discontinued. The first learning trial consists of eight words to remember. Words are presented sequentially for 1 second on, 1 second off. Following a computer adaptive testing approach, the number of words presented on each subsequent learning trial stays the same, increases, or decreases based on percentage of correct responses. 11 This computer adaptive testing method helps to determine the maximum “learning span” over five trials. High performers will be exposed to up to 23 words, whereas low performers will be shown a decreasing number of words across learning trials (floor = 2 items presented).
FIGURE 1.
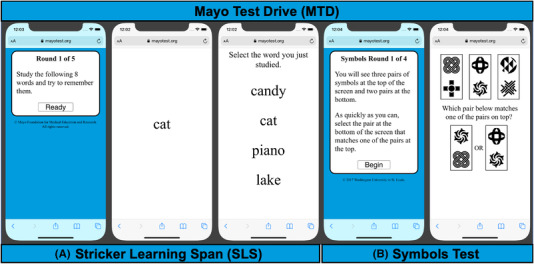
Example Mayo Test Drive screen shots. Note: Mayo Test Drive subtest screen shots are depicted here on a smartphone. A, Stricker Learning Span (SLS) is a computer adaptive word list memory test. Practice item SLS stimuli are displayed. Copyright © 2020 Mayo Foundation for Medical Education and Research. Used with permission from Mayo Foundation for Medical Education and Research, all rights reserved. B, Symbols Test is a processing speed measure. Copyright © 2017 Washington University in St. Louis. Used with permission from J. Hassenstab
The SLS uses an item bank of 92 high‐frequency words extracted from SUBTLEXUS corpus, 12 as common words are easier to recall but harder to recognize. 13 Four‐word item bins were matched based on word characteristics (imageability, length, semantic category, syllables), with a range of difficulty based on imageability ratings. 14 Subsequent word bins have successively declining imageability ratings, increasing the difficulty level to raise the ceiling. We predict this will increase sensitivity to early changes in preclinical AD or other disorders with subtle impact on memory performance. Randomization of words (target vs. foil in each bin) occurs at each testing session to provide endless alternative forms and reduce practice effects. Bin order is randomized for each trial to increase difficulty and reduce recency effects, and the last item presented is never the first tested.
The primary outcome variable is the maximum learning span, defined as the maximum number of words correctly identified on any learning trial (max span, range 0–23). Secondary outcome measures include learning total correct (trials 1–5 correct, range 0–85), delay (range 0–23), and sum of trials (trials 1–5 + delay; range 0–108). Use of a composite score was also explored by creating a z‐score using the mean (standard deviation [SD]) of all session 1 data for max span, 1–5 total and delay, then averaging across these three z‐scores. Not all participants had the opportunity to complete the delay trial because the delay was added mid‐study following our planned iterative approach to test development. We initially hypothesized that the max span would correlate well with traditional measures of delayed memory; however, correlations were lower than expected between max span and Auditory Verbal Learning Test (AVLT) delayed recall in our initial subset of participants (Pearson r = 0.17, n = 23). Thus, we added a delay trial after the Symbols Test on January 17, 2021. The maximum items presented during any learning trial are tested at delay (mean delay = 3.7 minutes).
2.2. Symbols Test
The Symbols Test is an open‐source measure of processing speed with previously demonstrated validity and reliability. 9 This measure was developed by Jason Hassenstab, Ph.D., and is part of the Ambulatory Research and Cognition app (ARC). 15 For each trial, participants identify which of two symbol pairs on the bottom of the screen matches one of three symbol pairs presented at the top of the screen. The original version used in ARC studies includes up to 28 brief 12‐item trials taken over the course of 7 consecutive days. In this shortened version, the primary outcome variable is average correct item response time (correct RT, sec) across four 12‐item trials. Secondary outcome variables were also explored (see Tables for definitions).
2.3. In‐person neuropsychological measures
A neuropsychological test battery was administered by a psychometrist under the supervision of a board‐certified neuropsychologist (JAF). We examined validity of the SLS using AVLT sum of trials 16 as the primary outcome (secondary outcomes included trial 5, trials 1–5, 30‐minute delay, and recognition percent correct), and Symbols Test using processing speed measures including Wechsler Adult Intelligence Scale‐Revised Digit Symbol Coding (Coding) and Trail Making Test (Trails A & B). Raw scores were used for all analyses.
2.4. Magnetic resonance imaging measures
Brain MRI was conducted on 3T scanners (Prisma, Siemens) with a 3D magnetization prepared rapid acquisition gradient‐echo (MPRAGE) sequence. These were tissue‐class segmented using Unified Segmentation 17 in SPM12 with population‐optimized priors and settings from the Mayo Clinic Adult Lifespan Template (MCALT) (https://www.nitrc.org/projects/mcalt/). These segmentations were used to sum the total intracranial volume (ICV) and estimate cortical thickness using Advanced Normalizaion Tools (ANTs) diffeomorphic registration‐based cortical thickness (DiReCT). 18 , 19 ANTs’ symmetric normalization was used to warp the MCALT_ADIR122 atlas for computing regional measurements. 20 We derived entorhinal cortical thickness and a temporal meta‐region of interest (ROI; previously referred to as an AD‐signature composite ROI). The temporal meta‐ROI is composed of the voxel‐number weighted average cortical thickness of six temporal lobe ROIs (entorhinal cortex, fusiform, parahippocampal, mid‐temporal, inferior temporal, angular gyrus). 19 This temporal meta‐ROI was previously derived using Youden's index criteria to separate cognitively unimpaired from clinically diagnosed and autopsy‐confirmed AD patients and tested for diagnostic reliability and accuracy; it is sensitive to but not specific for AD. 19 Hippocampal volume (HV) was adjusted for ICV by calculating the residual from a linear regression of hippocampal volume (y) versus ICV (x) based on a sex‐specific formula (for women: HV adjusted for IVC = observed HV − (7.88 + 0.00476 × [observed ICV – 1500]). This is similar to the approach previously reported by Jack et al. 21 but using SPM12, a different group of cognitively unimpaired participants ages 30 to 49 (N = 156) and regression models were fit separately within men (n = 90) and women (n = 66).
2.5. Statistical methods
We report Pearson bivariate correlation coefficients to assess convergent validity with in‐person neuropsychological measures. Test–retest reliability is determined by computing single‐rating, absolute‐agreement, two‐way mixed intraclass correlations (ICCs) with 95% confidence intervals (CIs) around the ICCs. 22 ICCs are interpreted using recommended ranges. 23 Randomized alternate forms are used for both tests, thus reliability coefficients also represent alternate form reliability. Practice effects were calculated by determining the paired difference of Session 1 and Session 2; Cohen's d effect sizes were calculated using pooled SDs, and significance was determined based on whether the 95% CI contained 0.
Participants completing all elements of the SLS (including delay) who also had MRI data available were included in criterion validity analyses with continuous MRI variables. We report Pearson partial correlation coefficients controlling for age and education to explore associations between neuropsychological and MRI measures. Alpha level was set to 0.05 for this pilot study. 24
3. RESULTS
3.1. Participant characteristics
We included all participants who initiated a MTD session from study initiation on December 9, 2020 through July 27, 2021. Of 258 women invited to participate in this all‐remote study, 99 enrolled by our data analysis cut‐off (recruitment is ongoing). Sample characteristics of enrolled and identifiable participants completing at least one complete MTD session (n = 96) are reported in Table 1. Modified Mini‐Mental State Examination (3MS) scores were all above recommended cut‐offs for dementia (>78). 25 Mean performance on traditional in‐person neuropsychological measures were within the average range based on normative scores (Table S1 in supporting information). 26 , 27
TABLE 1.
Participant characteristics for session 1 (n = 96)
| Mean (SD) | Median | Range | |
|---|---|---|---|
| Age at in‐person visit, years | 66.0 (5.4) | 65.0 | 55–79 |
| Age at remote MTD session 1, years | 66.5 (5.4) | 65.8 | 55–79 |
| Education, years | 14.9 (2.2) | 14.0 | 12–19 |
| 3MS, raw | 96.2 (3.8) | 98.0 | 83–100 |
| Months since in‐person testing for MTD | 10.1 (6.8) | 7.9 | 0.5–23.8 |
| Race (% White) | 92.7% a | – | – |
| Ethnicity (% Non‐Hispanic) | 90.6% b | – | – |
Abbreviations: 3MS, Modified Mini‐Mental State Examination; MTD, Mayo Test Drive; SD, standard deviation.
n = 89 White, n = 1 African American, n = 2 Asian, n = 4 unknown.
n = 87 Non‐Hispanic, n = 2 choose not to disclose, n = 7 unknown.
3.2. Feasibility of remote measures
3.2.1. User/session factors
Participants completed MTD across a variety of device types including smartphones (50%), tablets (3%), and computers (47%); see Table S2 in supporting information. A minority endorsed the presence of noise during testing (4%) or interference during a subtest (4%–12%). Many participants (51%) provided comments at the end of the session.
3.2.2. Acceptability/completion rates
Ninety‐eight percent of participants completed a test session upon initiating the first session (Table S2). No one called the study coordinator to request assistance. Technological problems reported by participants who replied to study e‐mails were focused on difficulties with some e‐mails coming through without any text in the body of the email, related to issues with REDCap.
3.2.3. Efficiency
Median time to complete the first test session was 15.1 minutes (Table S2; subtest completion times are also provided).
3.3. Psychometric properties
3.3.1. Reliability
Test–retest reliability across two sessions for SLS learning variables were good (at or above 0.75 ICC; see Table 2); delay was slightly lower (0.71, adequate). All test–retest reliability coefficients for Symbols Test were good and all exceeded 0.83 ICC, with subtly higher reliability noted when using average seconds for the best two out of four trials (0.86 ICC). Median days between the two sessions was 13.0 (mean 18.6, range 7–85).
TABLE 2.
Test–retest reliability coefficients and magnitude of practice effects: Pearson's rho and intraclass correlation coefficient (ICC 3,2), n = 89 unless otherwise noted
| r a | ICC | ICC 95% CI | Session 1 mean (SD) | Session 2 mean (SD) | Practice effect Cohen's d | |
|---|---|---|---|---|---|---|
| Stricker learning span | ||||||
| SLS Max Span | 0.61 | 0.76 | (0.63 0.84) | 17.9 (3.4) | 18.0 (3.2) | 0.03 (−0.15, 0.22) |
| SLS 1‐5 Total b | 0.62 | 0.76 | (0.64, 0.84) | 64.6 (11.8) | 65.7 (11.6) | 0.09 (−0.09, 0.27) |
| SLS Delay c | 0.57 | 0.71 | (0.54, 0.82) | 16.6 (4.1) | 15.8 (3.9) | −0.20 (−0.44, 0.03) |
| SLS Sum of Trials d | 0.61 | 0.74 | (0.58, 0.84) | 82.5 (15.9) | 81.4 (15.6) | −0.07 (−0.30, 0.15) |
| SLS Composite e | 0.61 | 0.74 | (0.58, 0.84) | 0.10 (0.98) | 0.02 (0.96) | −0.08 (−0.30, 0.14) |
| Symbols Test | ||||||
| SYM Correct RT f | 0.72 | 0.83 | (0.75, 0.89) | 3.15 (0.78) | 2.88 (0.73) | −0.36 (−0.52, −0.20) |
| SYM Best 2 Average g | 0.76 | 0.86 | (0.79, 0.91) | 36.2 (7.9) | 34.4 (7.8) | −0.22 (−0.37, −0.07) |
| SYM Middle 2 Average h | 0.73 | 0.84 | (0.76, 0.89) | 39.4 (8.8) | 37.2 (8.8) | −0.25 (−0.40, −0.09) |
| SYM All 4 Average i | 0.72 | 0.83 | (0.75, 0.89) | 40.9 (9.3) | 37.6 (8.7) | −0.37 (−0.54, −0.21) |
| SYM All 4 Total Seconds j | 0.72 | 0.84 | (0.75, 0.89) | 163.8 (37.4) | 150.3 (34.8) | −0.37 (−0.54, −0.21) |
Abbreviations: CI, confidence interval; SD, standard deviation; SLS, Stricker Learning Span; SLS Max Span, maximum number of words recognized across any learning trial; SLS 1–5 Total, sum of words correctly recognized across trials 1–5; SLS Sum of Trials, SLS 1–5 total + delay; SLS Composite, mean z‐score (SLS max span, SLS 1–5 total, SLS delay); SYM, Symbols Test; SYM Correct RT, average response time per item (correct trials only) across all four trials; SYM Best 2 Avg, seconds to complete a trial averaged across the two trials with the fastest completion times; SYM Middle 2 Avg, seconds to complete a trial averaged across two trials, excluding highest and lowest performances; SYM All 4 Avg, seconds to complete a trial averaged across all four trials.
Randomized alternate forms are used for both tests thus reliability coefficients also represent alternate form reliability.
All correlation coefficients were significant (P < 0.001).
n = 88.
n = 61 due to addition of delay after start of study.
1–5 total + delay, n = 61.
Mean z‐score (max span, 1–5 total, delay), n = 61.
Average response time per item (correct trials only) across all four trials, seconds.
Seconds to complete a trial averaged across the two trials with the fastest completion times.
Seconds to complete a trial averaged across two trials, excluding highest and lowest performances.
Seconds to complete a trial averaged across all four trials.
Seconds to complete all four trials (summative).
3.3.2. Practice effects
No SLS measures showed significant practice effect (CI included 0; see Table 2). SLS delay showed evidence for a small but non‐significant decrease in performance at session 2 (d = –0.20). All Symbols Test variables showed a small practice effect, with significantly faster performance at session 2.
3.3.3. Distributional properties
Distributional properties of SLS variables were similar to in‐person administered AVLT recall measures (Table S1). No participant showed a floor effect on the SLS. Ceiling effects for the SLS (4% max span, 3% delay) were infrequent and similar to AVLT recall (7% Trial 5, 2% delay). Use of four‐choice recognition provided better distributional properties relative to the prominent ceiling effect observed for AVLT recognition (23% AVLT recognition percent correct; 39% hits). Distributional properties of Symbols Test time‐based variables were similar to Trails A and were less skewed than Trails B raw scores but less normally distributed than Coding.
3.4. Validity
3.4.1. Associations with demographic variables
Age correlations with SLS (–0.05 to –0.24) were larger in magnitude than age correlations with AVLT (0.00 to –0.12; Table S3 in supporting information). Education correlations with SLS (0.04–0.13) were similar to AVLT education correlations (0.01–0.16). Age correlations with Symbols (0.34–0.36) were similar to age correlations with Coding (–0.34). Education correlations with Symbols (–0.03 to –0.07) were smaller in magnitude than Coding (0.15).
3.4.2. Associations with in‐person neuropsychological tests
SLS showed significant correlations with AVLT variables (Table 3); correlations with AVLT Trial 5 recall and AVLT Recognition PC were highest (0.42–0.51). SLS and AVLT delay (0.36) and sum of trials (0.33) showed moderate relationships. SLS also showed significant correlations with Coding (0.24–0.29) and Trails B (–0.22 to –0.26), but not Trails A; AVLT showed the same pattern of associations with these measures (Table 3 and Tables S4 and S5 in supporting information). Symbols showed significant correlations with Coding (–0.48 to –0.49), Trails A (0.40–0.43), and Trails B (0.42–0.44).
TABLE 3.
Pearson correlation coefficients between session 1 Mayo Test Drive measures and in‐person neuropsychological tests (n = 96 unless otherwise noted)
| SLS Max Span | SLS 1‐5 Total | SLS Delay a | SLS Sum of Trials a | SLS c | SYM correct RT | SYM Best 2 Avg | SYM Middle 2 Avg | SYM All 4 Avg b | |
|---|---|---|---|---|---|---|---|---|---|
| AVLT Trial 5 | 0.45*** | 0.44*** | 0.42*** | 0.42*** | 0.42*** | −0.15 | −0.10 | −0.17 | −0.16 |
| AVLT 1–5 Total | 0.30** | 0.33*** | 0.29* | 0.31* | 0.30* | −0.17 | −0.12 | −0.18 | −0.19 |
| AVLT Delay | 0.26* | 0.27** | 0.36** | 0.30* | 0.30** | −0.09 | −0.07 | −0.08 | −0.10 |
| AVLT Sum of Trials | 0.32** | 0.35*** | 0.35** | 0.33** | 0.33** | −0.17 | −0.13 | −0.17 | −0.18 |
| AVLT Recogn PC | 0.43*** | 0.48*** | 0.51*** | 0.49*** | 0.49*** | −0.07 | −0.05 | −0.08 | −0.09 |
| Trails A | −0.07 | −0.08 | −0.11 | −0.07 | −0.08 | 0.40*** | 0.43*** | 0.44*** | 0.40*** |
| Trails B | −0.22* | −0.24* | −0.26* | −0.22 | −0.22 | 0.44*** | 0.42*** | 0.43*** | 0.44*** |
| Digit symbol coding | 0.24* | 0.29** | 0.27* | 0.25* | 0.25* | −0.49*** | −0.48*** | −0.50*** | −0.49*** |
Abbreviations: AVLT, Auditory Verbal Learning Test; AVLT Sum of Trials, AVLT 1–5 total + Trial 6 + 30‐min delay; AVLT Recogn PC, Recognition Percent Correct = {[recognition hits+(15 – recognition false positive errors)]/30} × 100; SLS, Stricker Learning Span; SLS Max Span, maximum number of words recognized across any learning trial; SLS 1–5 Total, sum of words correctly recognized across trials 1–5; SLS Sum of Trials, SLS 1–5 total + delay; SLS Composite, mean z‐score (SLS max span, SLS 1–5 total, SLS delay); SYM, Symbols Test; SYM Correct RT, average response time per item (correct trials only) across all four trials; SYM Best 2 Avg, seconds to complete a trial averaged across the two trials with the fastest completion times; SYM Middle 2 Avg, seconds to complete a trial averaged across two trials, excluding highest and lowest performances; SYM All 4 avg, seconds to complete a trial averaged across all four trials.
n = 68 due to addition of delay after start of study.
Correlations for Symbols all four total seconds are identical to those of Symbols all 4 sec, average.
P < 0.05.
P < 0.01.
P < 0.001.
3.4.3. Association with MRI measures
Most SLS variables showed significant correlations with temporal meta‐ROI and entorhinal cortex thickness (0.29–0.34; Table 4); the correlation for SLS delay was not significant (0.22–0.25). SLS correlations with hippocampal volume also did not reach significance (0.14–0.22). No AVLT variables showed significant correlations with MRI measures (0.03–0.26). Symbols, Trails A, and Trails B did not show significant correlations with these MRI measures (–0.17 to 0.12).
TABLE 4.
Partial correlation coefficients, adjusted for age and education (n = 47)
| Temporal meta‐ROI cortical thickness | Entorhinal cortex thickness | Hippocampal volume, ICV adj. | |
|---|---|---|---|
| Mayo Test Drive (remote) | |||
| SLS Max Span | 0.30 * | 0.33 * | 0.22 |
| SLS 1–5 Total | 0.34 * | 0.30 * | 0.14 |
| SLS Delay | 0.22 | 0.25 | 0.15 |
| SLS Sum of Trials | 0.32 * | 0.29 | 0.14 |
| SLS Composite | 0.31 * | 0.30 * | 0.16 |
| SYM Correct RT | 0.02 | −0.11 | −0.10 |
| SYM Best 2 Average | 0.01 | −0.16 | −0.11 |
| SYM Middle 2 Average | 0.02 | −0.13 | −0.11 |
| SYM All 4 Avg a | 0.01 | −0.12 | −0.07 |
| In‐person measures | |||
| AVLT 1–5 Total | 0.03 | 0.17 | 0.03 |
| AVLT Trial 5 | −0.17 | 0.05 | −0.04 |
| AVLT Delay | −0.02 | 0.26 | −0.06 |
| AVLT Sum of Trials | 0.01 | 0.21 | 0.01 |
| AVLT Recogn % Correct | 0.14 | 0.24 | 0.03 |
| Digit Symbol Coding | −0.16 | 0.10 | −0.11 |
| Trails A | 0.04 | −0.14 | 0.12 |
| Trails B | −0.07 | −0.17 | 0.01 |
Note: AVLT, Auditory Verbal Learning Test; AVLT Sum of Trials, AVLT 1‐5 total + Trial 6 + 30‐min delay; AVLT Recogn PC, Recognition Percent Correct = {[recognition hits+(15 – recognition false positive errors)]/30} × 100; ICV, intercranial volume; ROI, region of interest; SLS, Stricker Learning Span; SLS Max Span, maximum number of words recognized across any learning trial; SLS 1–5 Total, sum of words correctly recognized across trials 1–5; SLS Sum of Trials, SLS 1–5 total + delay; SLS Composite, mean z‐score (SLS max span, SLS 1‐5 total, SLS delay); SYM, Symbols Test; SYM Correct RT, average response time per item (correct trials only) across all four trials; SYM Best 2 Avg, seconds to complete a trial averaged across the two trials with the fastest completion times; SYM Middle 2 Avg, seconds to complete a trial averaged across 2 trials, excluding highest and lowest performances; SYM All 4 avg, seconds to complete a trial averaged across all four trials.
Correlations for Symbols all four total seconds are identical to those of Symbols all 4 sec, average.
P < 0.05.
4. DISCUSSION
This study examines feasibility, psychometric properties, and convergent validity of web‐based, self‐administered neuropsychological tests using the MTD platform. In addition, we examine criterion validity through associations with biomarkers of neurodegeneration sensitive to AD.
Consistent with our flexible platform, participants used a variety of devices to complete the tests in approximately 15 minutes. Although we specifically encouraged use of smartphones, only half of participants chose to use a smartphone; 47% used personal computers and 3% tablets. Once a session was initiated, most participants (98%) completed the full first session, suggesting acceptability of the platform and subtests. We predict that participants’ technological literacy with their own specific and preferred devices will translate to high feasibility in other populations as well. The self‐administered web‐based design relying on visual presentation of stimuli eliminates other potential confounds that may occur when list‐learning tests are administered orally via telephone, videoconferencing, or automated recordings, such as misinterpretation of words spoken due to hearing problems or suboptimal audio quality. 28 , 29 Though infrequent, we were able to capture reports of environmental interference and participant comments that may impact interpretation of session results. We have previously observed lower performance on other self‐administered cognitive measures at home versus in clinic. 30 Madero et al. 31 similarly reported the presence of distraction in a minority of remote cognitive assessment sessions (7%), which had a negative impact on performance. Future work will examine whether participant self‐report of interference can help reduce variability introduced by testing in an unsupervised environment.
Overall, the psychometric properties of the SLS and Symbols Test are comparable to neuropsychological tests administered in person. For example, they exhibit test–retest reliability over two time points comparable to traditional paper‐and‐pencil measures; 32 person‐administered and self‐administered supervised computerized tests; 33 , 34 , 35 , 36 as well as other novel self‐administered, unsupervised memory test paradigms. 37 No practice effects were observed on the SLS, consistent with prior work showing that use of alternate forms reduces the magnitude of practice effects. 38 With larger samples, we expect a small practice effect over time may be observed, as we have reported small practice effects on other measures that use randomized alternate forms. 30 Interestingly, we saw an unexpected decline in performance on SLS delay at session 2 that was non‐significant and small in magnitude (Cohen's d = 0.20). We use the same word bins to generate the randomized alternate form for each session, thus for each word bin the same four choices are displayed at test; only the target word to be remembered is randomized. It is possible that proactive interference from session 1 target words could have impacted performance at session 2. 39 Longer durations between sessions may potentially reduce this interference. All Symbols Test variables showed a small practice effect, with faster performance at session 2. Using the best two trials of four decreased the magnitude of this practice effect and increased reliability slightly. Future work with larger samples will help determine the potential influence of external factors on reliability including device (e.g., type, consistent vs. different device) 40 and reported interruptions to guide robust data analysis, normative data development, and clinical interpretation. Finally, distributional properties of MTD subtests were similar to in‐person–administered measures of similar constructs.
The SLS is a novel test designed to be sensitive to changes in memory encoding by expanding upon existing list‐learning paradigms. Typical recognition formats (yes/no response to test items and distractor items) are less sensitive to mild cognitive impairment (MCI) and AD dementia than spontaneous verbal free recall. 41 In contrast, when a more challenging 4‐choice recognition format is used, recognition paradigms can show sensitivity to AD dementia that is comparable to free recall. 42 The current study suggests that our computer adaptive and 4‐choice recognition approach is simulating recall as designed, demonstrated by significant correlations between AVLT and SLS variables, and illustrated by example learning curves for high and low performers (Figure 2). We predict the SLS will have a lower floor than recall‐based memory measures in individuals with cognitive impairment. The Symbols Test also showed significant correlations with person‐administered measures of processing speed.
FIGURE 2.
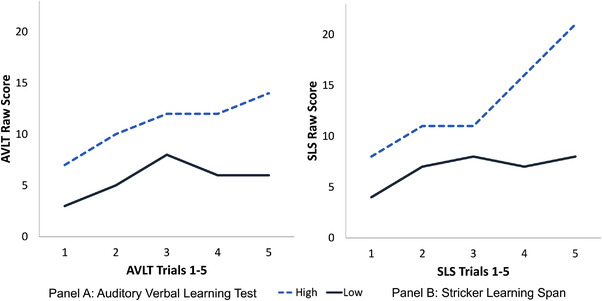
Example learning slopes for the Auditory Verbal Learning Test (AVLT) and the Stricker Learning Span (SLS). Note: Data from two participants were selected to display example high and low performers on the SLS. The high performer (blue dashed line) showed high average learning performance on the AVLT (AVLT trials 1–5 total = 55, normative score of 57 T). The low performer (black solid line) showed mildly to moderately impaired learning performance on the AVLT (AVLT 1–5 total = 28, normative score of 28 T). These same two individuals showed a similar pattern of performance across SLS learning trials (panel B). The high performer (blue dashed line) showed a strongly positive learning slope over the 5 learning trials (SLS 1–5 total = 67), and a max span of 21. The greater slope increase seen on trials 3–5 on the SLS relative to the AVLT may indicate that our adaptive testing format is successfully raising the ceiling for this high performer. The low performer (black solid line) showed a comparatively flat learning slope (SLS 1–5 total = 34), and a max span of 8
Structural neuroimaging markers of neurodegeneration, including temporal meta‐ROI and entorhinal cortical thickness, were significantly associated with SLS performances, providing preliminary support for SLS criterion validity. Word list recall was associated with an alternative “AD‐signature” cortical thickness ROI in a group of adults without significant psychiatric or neurological history (age range 21–78), 43 thus the lack of association between AVLT and cortical thickness measures was somewhat unexpected. In addition, neither the SLS nor AVLT showed significant associations with hippocampal volume. While measures of hippocampal volume are often associated with memory performance, these findings are frequently reported in samples of participants with MCI 8 , 44 or AD dementia, 45 and often are not significant in participants with normal cognition. 46 In addition, Wolk and Dickerson 45 showed that while the hippocampus correlated with AVLT delayed recall in a mild AD sample, perirhinal/entorhinal cortex thickness correlated more strongly with recognition discrimination than did the hippocampus. Similarly, Yonelinas et al. 47 reported that age‐related decreases in hippocampal volume are associated with decreases in recall, whereas entorhinal volume reductions are associated with decreased recognition. These prior findings help explain why the SLS, with its recognition‐based testing format, is showing significant associations with entorhinal cortical thickness, but not hippocampal volume. Future work is needed to see what regions within the temporal meta‐ROI may be driving associations, and voxel‐wise analyses would be a helpful complement to the current ROI‐focused approach.
There are limitations to acknowledge. First, our sample is all female and representative of the local demographics. Initial data collection in the Mayo Clinic Study of Aging is underway and will provide the broader and larger sample needed for further examination of psychometric properties, validation, and normative data development, though additional work will be needed to validate the SLS in ethnoracial and culturally diverse samples. Use of word frequency to guide word selection will help facilitate future translation of the SLS to other languages. MTD was completed, on average, 10 to 11 months after in‐person testing and imaging; this time interval could decrease the effects observed if intervening factors influenced performance. We applied a simple cut‐off based on the 3MS to determine absence of dementia in this sample. Further, measures of neurodegeneration are not specific to AD. To establish construct validity of MTD measures, future studies are needed to examine associations with amyloid and tau biomarkers, explain the theory underlying test development (in preparation), examine diagnostic accuracy in well‐characterized clinical groups, and to apply factor analytic methods to better establish convergent and divergent validity in a larger sample. 48
There is increasing interest in developing digital tools to detect and track preclinical and prodromal stages of AD. 15 MTD helps address several emerging needs for digital tools, including a multi‐device web‐based platform that can increase representativeness of samples through ease of access, inclusion of methods to capture the presence of test interference in an unsupervised environment, and use of computer adaptive and multi‐trial test design to help counteract the expected increased variability in performance with unsupervised and/or remote assessment methods.
Our results support the feasibility of MTD and strong psychometrics properties of the SLS and Symbols Test in a sample of female older adults. In addition, the SLS is correlated with biomarkers of neurodegeneration sensitive to AD. MTD shows potential as an equitable platform for self‐administered cognitive measures to increase access for research and clinical use.
CONFLICTS OF INTEREST
NHS, KK, and MMMi serve as consultants to Biogen, and MMMi serves as a consultant to the Brain Protection Company, outside the scope of this work. KK receives research support from Avid and Eli Lilly, outside the scope of this work. CRJ serves on an independent data monitoring board for Roche, has served as a speaker for Eisai, and consulted for Biogen, but he receives no personal compensation from any commercial entity. CRJ receives research support from NIH, the GHR Foundation, and the Alexander Family Alzheimer's Disease Research Professorship of the Mayo Clinic. JH is a paid consultant for Lundbeck, Biogen, Roche, and Takeda, outside the scope of this work. A Mayo Clinic invention disclosure has been submitted for the Stricker Learning Span and the Mayo Test Drive platform (NHS, JLS). AJK, JRG, JAF, JH, CGS, NT, HJW, CRJ, KK, and MMM have no disclosures related to the content of this submission.
Supporting information
Supporting Information
ACKNOWLEDGMENTS
The authors wish to thank the participants and staff at the Specialized Center of Research Excellence (SCORE) on Sex Differences study. Research reported in this publication was supported by the National Institute on Aging of the National Institutes of Health under Award Numbers R21AG073967, U54 AG44170, R01AG057840 and the Rochester Epidemiology Project (R01 AG034676). The content is solely the responsibility of the authors and does not necessarily represent the official views of the National Institutes of Health. This work was also supported by the Kevin Merszei Career Development Award in Neurodegenerative Diseases Research IHO Janet Vittone, MD.
Stricker NH, Stricker JL, Karstens AJ, et al. A novel computer adaptive word list memory test optimized for remote assessment: Psychometric properties and associations with neurodegenerative biomarkers in older women without dementia. Alzheimer's Dement. 2022;14:e12299. 10.1002/dad2.12299
REFERENCES
- 1. Sabbagh M, Boada M, Borson P, et al. Early detection of mild cognitive impairment MCI in an at home setting. J Prev Alzheimers Dis. 2020;7(3):171‐178. [DOI] [PubMed] [Google Scholar]
- 2. Marra DE, Hamlet KM, Bauer RM, Bowers D. Validity of teleneuropsychology for older adults in response to COVID‐19: a systematic and critical review. Clin Neuropsychol. 2020;34(7‐8):1411‐1452. [DOI] [PMC free article] [PubMed] [Google Scholar]
- 3. Humble J, Kim, G. , Gorsgren, N . Accelerate: Building and Scaling High Performing Technology Organizations. IT Revolution Press; 2018. [Google Scholar]
- 4. Pew Research Center . Mobile Technology and Home Broadband. Pew Research Center; 2019. https://www.pewresearch.org/internet/2019/06/13/mobile‐technology‐and‐home‐broadband‐2019/. Accessed October 5, 2020. [Google Scholar]
- 5. Lourenco SF, Tasimi A. No participant left behind: conducting science during COVID‐19. Trends Cogn Sci. 2020;24(8):583‐584. [DOI] [PMC free article] [PubMed] [Google Scholar]
- 6. Pew Research Center . Mobile Fact Sheet. Pew Research Center; 2019; https://www.pewresearch.org/internet/fact‐sheet/mobile/. Accessed October 5, 2020. [Google Scholar]
- 7. Lim YY, Baker JE, Bruns L, et al. Association of deficits in short‐term learning and Aβ and hippoampal volume in cognitively normal adults. Neurology. 2020;95(18):e2577‐e2585. [DOI] [PubMed] [Google Scholar]
- 8. Chang YL, Bondi MW, Fennema‐Notestine C, et al. Brain substrates of learning and retention in mild cognitive impairment diagnosis and progression to Alzheimer's disease. Neuropsychologia. 2010;48(5):1237‐1247. [DOI] [PMC free article] [PubMed] [Google Scholar]
- 9. Sliwinski MJ, Mogle JA, Hyun J, Munoz E, Smyth JM, Lipton RB. Reliability and validity of ambulatory cognitive assessments. Assessment. 2016;25(1):14‐30. [DOI] [PMC free article] [PubMed] [Google Scholar]
- 10. Weintraub S, Carrillo MC, Farias ST, et al. Measuring cognition and function in the preclinical stage of Alzheimer's disease. Alzheimers Dement (N Y). 2018;4:64‐75. [DOI] [PMC free article] [PubMed] [Google Scholar]
- 11. Gonthier C, Aubry A, Bourdin B. Measuring working memory capacity in children using adaptive tasks: example validation of an adaptive complex span. Behav Res Methods. 2018;50(3):910‐921. [DOI] [PubMed] [Google Scholar]
- 12. Brysbaert M, New B. Moving beyond Kucera and Francis: a critical evaluation of current word frequency norms and the introduction of a new and improved word frequency measure for American English. Behav Res Methods. 2009;41(4):977‐990. [DOI] [PubMed] [Google Scholar]
- 13. Lohnas LJ, Kahana MJ. Parametric effects of word frequency in memory for mixed frequency lists. J Exp Psychol Learn Mem Cogn. 2013;39(6):1943‐1946. [DOI] [PMC free article] [PubMed] [Google Scholar]
- 14. Clark JM, Paivio A. Extensions of the Paivio, Yuille, and Madigan (1968) norms. Behav Res Methods Instrum Comput. 2004;36(3):371‐383. [DOI] [PubMed] [Google Scholar]
- 15. Ohman F, Hassenstab J, Berron D, Scholl M, Papp KV. Current advances in digital cognitive assessment for preclinical Alzheimer's disease. Alzheimers Dement (Amst). 2021;13(1):e12217. [DOI] [PMC free article] [PubMed] [Google Scholar]
- 16. Jack CR, Jr. , Wiste HJ, Weigand SD, et al. Age, sex, and APOE epsilon4 effects on memory, brain structure, and beta‐amyloid across the adult life span. JAMA Neurol. 2015;72(5):511‐519. [DOI] [PMC free article] [PubMed] [Google Scholar]
- 17. Ashburner J, Friston KJ. Unified segmentation. Neuroimage. 2005;26(3):839‐851. [DOI] [PubMed] [Google Scholar]
- 18. Das SR, Avants BB, Grossman M, Gee JC. Registration based cortical thickness measurement. Neuroimage. 2009;45(3):867‐879. [DOI] [PMC free article] [PubMed] [Google Scholar]
- 19. Schwarz CG, Gunter JL, Wiste HJ, et al. A large‐scale comparison of cortical thickness and volume methods for measuring Alzheimer's disease severity. NeuroImage Clin. 2016;11:802‐812. [DOI] [PMC free article] [PubMed] [Google Scholar]
- 20. Avants BB, Tustison NJ, Song G, Cook PA, Klein A, Gee JC. A reproducible evaluation of ANTs similarity metric performance in brain image registration. Neuroimage. 2011;54(3):2033‐2044. [DOI] [PMC free article] [PubMed] [Google Scholar]
- 21. Jack CR, Jr. , Wiste HJ, Weigand SD, et al. Different definitions of neurodegeneration produce similar amyloid/neurodegeneration biomarker group findings. Brain. 2015;138(Pt 12):3747‐3759. [DOI] [PMC free article] [PubMed] [Google Scholar]
- 22. Shrout PE, Fleiss JL. Intraclass correlations: uses in assessing rater reliability. Psychol Bull. 1979;86(2):420‐428. [DOI] [PubMed] [Google Scholar]
- 23. Koo TK, Li MY. A guideline of selecting and reporting intraclass correlation coefficients for reliability research. J Chiropr Med. 2016;15(2):155‐163. [DOI] [PMC free article] [PubMed] [Google Scholar]
- 24. Lee EC, Whitehead AL, Jacques RM, Julious SA. The statistical interpretation of pilot trials: should significance thresholds be reconsidered? BMC Med Res Methodol. 2014;14:41. [DOI] [PMC free article] [PubMed] [Google Scholar]
- 25. McDowell I, Kristjansson B, Hill GB, Hebert R. Community screening for dementia: the Mini Mental State Exam (MMSE) and Modified Mini‐Mental State Exam (3MS) compared. J Clin Epidemiol. 1997;50(4):377‐383. [DOI] [PubMed] [Google Scholar]
- 26. Stricker NH, Christianson TJ, Lundt ES, et al. Mayo normative studies: regression‐based normative data for the auditory verbal learning test for ages 30‐91 years and the importance of adjusting for sex. J Int Neuropsychol Soc. 2020;27(3):211‐226. [DOI] [PMC free article] [PubMed] [Google Scholar]
- 27. Ivnik RJ, Malec JF, Smith GE, Tangalos E, Petersen RC. Neuropsychological tests' norms above age 55: COWAT, BNT, MAE token, WRAT‐R reading, AMNART, stroop, TMT, and JLO. Clin Neuropsychol. 1996;10(3):262‐278. [Google Scholar]
- 28. Wong CG, Rapport LJ, Billings BA, Ramachandran V, Stach BA. Hearing loss and verbal memory assessment among older adults. Neuropsychology. 2019;33(1):47‐59. [DOI] [PubMed] [Google Scholar]
- 29. Goodwin MV, Hogervorst E, Maidment DW. The impact of presentation modality on cognitive test performance for adults with hearing loss. Alzheimers Dement. 2021;17(Suppl 12):e058571. [DOI] [PubMed] [Google Scholar]
- 30. Stricker NH, Lundt ES, Alden EC, et al. Longitudinal comparison of in clinic and at home administration of the Cogstate brief battery and demonstrated practice effects in the mayo clinic study of aging. J Prev Alzheimer's Dis. 2020;7(1):21‐28. [DOI] [PMC free article] [PubMed] [Google Scholar]
- 31. Madero EN, Anderson J, Bott NT, et al. Environmental distractions during unsupervised remote digital cognitive assessment. J Prev Alzheimer's Dis. 2021:1‐4. [DOI] [PMC free article] [PubMed] [Google Scholar]
- 32. Calamia M, Markon K, Tranel D. The robust reliability of neuropsychological measures: meta‐analyses of test‐retest correlations. Clin Neuropsychol. 2013;27(7):1077‐1105. [DOI] [PubMed] [Google Scholar]
- 33. Tierney MC, Lermer MA. Computerized cognitive assessment in primary care to identify patients with suspected cognitive impairment. J Alzheimers Dis. 2010;20(3):823‐832. [DOI] [PubMed] [Google Scholar]
- 34. Dikmen SS, Bauer PJ, Weintraub S, et al. Measuring episodic memory across the lifespan: NIH Toolbox Picture Sequence Memory Test. J Int Neuropsychol Soc. 2014;20(6):611‐619. [DOI] [PMC free article] [PubMed] [Google Scholar]
- 35. Gualtieri CT, Johnson LG. Reliability and validity of a computerized neurocognitive test battery, CNS vital signs. Arch Clin Neuropsychol. 2006;21(7):623‐643. [DOI] [PubMed] [Google Scholar]
- 36. Thompson TA, Wilson PH, Snyder PJ, et al. Sensitivity and test‐retest reliability of the international shopping list test in assessing verbal learning and memory in mild Alzheimer's disease. Arch Clin Neuropsychol. 2011;26(5):412‐424. [DOI] [PubMed] [Google Scholar]
- 37. Mackin RS, Rhodes E, Insel PS, et al. Reliability and validity of a home‐based self‐administered computerized test of learning and memory using speech recognition. Neuropsychol Dev Cogn B Aging Neuropsychol Cogn. 2021:1‐15. [DOI] [PMC free article] [PubMed] [Google Scholar]
- 38. Calamia M, Markon K, Tranel D. Scoring higher the second time around: meta‐analysis of practice effects in neuropsychological assessment. Clin Neuropsychol. 2012;26:543‐570. [DOI] [PubMed] [Google Scholar]
- 39. Wixted JT. The psychology and neuroscience of forgetting. Annu Rev Psychol. 2004;55:235‐269. [DOI] [PubMed] [Google Scholar]
- 40. Stricker NH, Lundt ES, Edwards KK, et al. Comparison of PC and iPad administrations of the Cogstate Brief Battery in the Mayo Clinic Study of Aging: assessing cross‐modality equivalence of computerized neuropsychological tests. Clin Neuropsychol. 2019;33(6):1102‐1126. [DOI] [PMC free article] [PubMed] [Google Scholar]
- 41. Weissberger GH, Strong JV, Stefanidis KB, Summers MJ, Bondi MW, Stricker NH. Diagnostic accuracy of memory measures in Alzheimer's dementia and mild cognitive impairment: a systematic review and meta‐analysis. Neuropsychol Rev. 2017;27(4):354‐388. [DOI] [PMC free article] [PubMed] [Google Scholar]
- 42. Lowndes G, Savage G. Early detection of memory impairment in Alzheimer's disease: a neurocognitive perspective on assessment. Neuropsychol Rev. 2007;17(3):193‐202. [DOI] [PubMed] [Google Scholar]
- 43. Busovaca E, Zimmerman ME, Meier IB, et al. Is the Alzheimer's disease cortical thickness signature a biological marker for memory? Brain Imaging Behav. 2016;10(2):517‐523. [DOI] [PMC free article] [PubMed] [Google Scholar]
- 44. Putcha D, Brickhouse M, Wolk DA, Dickerson BC. Alzheimer's Disease Neuroimaging I . Fractionating the Rey auditory verbal learning test: distinct roles of large‐scale cortical networks in prodromal Alzheimer's disease. Neuropsychologia. 2019;129:83‐92. [DOI] [PMC free article] [PubMed] [Google Scholar]
- 45. Wolk DA, Dickerson BC. Alzheimer's Disease Neuroimaging I . Fractionating verbal episodic memory in Alzheimer's disease. Neuroimage. 2011;54(2):1530‐1539. [DOI] [PMC free article] [PubMed] [Google Scholar]
- 46. Gifford KA, Phillips JS, Samuels LR, et al. Associations between verbal learning slope and neuroimaging markers across the cognitive aging spectrum. J Int Neuropsychol Soc. 2015;21(6):455‐467. [DOI] [PMC free article] [PubMed] [Google Scholar]
- 47. Yonelinas AP, Widaman K, Mungas D, Reed B, Weiner MW, Chui HC. Memory in the aging brain: doubly dissociating the contribution of the hippocampus and entorhinal cortex. Hippocampus. 2007;17(11):1134‐1140. [DOI] [PMC free article] [PubMed] [Google Scholar]
- 48. Strauss ME, Smith GT. Construct validity: advances in theory and methodology. Annu Rev Clin Psychol. 2009;5:1‐25. [DOI] [PMC free article] [PubMed] [Google Scholar]
Associated Data
This section collects any data citations, data availability statements, or supplementary materials included in this article.
Supplementary Materials
Supporting Information