Abstract
Objectives
To assess the feasibility of a CNN-based liver registration algorithm to generate difference maps for visual display of spatiotemporal changes in liver PDFF, without needing manual annotations.
Methods
This retrospective exploratory study included 25 patients with suspected or confirmed NAFLD, who underwent PDFF-MRI at two time points at our institution. PDFF difference maps were generated by applying a CNN-based liver registration algorithm, then subtracting follow-up from baseline PDFF maps. The difference maps were post-processed by smoothing (5 cm2 round kernel) and applying a categorical color scale. Two fellowship-trained abdominal radiologists and one radiology resident independently reviewed difference maps to visually determine segmental PDFF change. Their visual assessment was compared with manual ROI-based measurements of each Couinaud segment and whole liver PDFF using intraclass correlation (ICC) and Bland-Altman analysis. Inter-reader agreement for visual assessment was calculated (ICC).
Results
The mean patient age was 49 years (12 males). Baseline and follow-up PDFF ranged from 2.0 to 35.3% and 3.5 to 32.0%, respectively. PDFF changes ranged from - 20.4 to 14.1%. ICCs against the manual reference exceeded 0.95 for each reader, except for segment 2 (2 readers ICC = 0.86—0.91) and segment 4a (reader 3 ICC = 0.94). Bland-Altman limits of agreement were within 5% across all three readers. Inter-reader agreement for visually assessed PDFF change (whole liver and segmental) was excellent (ICCs > 0.96), except for segment 2 (ICC = 0.93).
Conclusions
Visual assessment of liver segmental PDFF changes using a CNN-generated difference map strongly agreed with manual estimates performed by an expert reader and yielded high inter-reader agreement.
Keywords: Liver, Magnetic resonance imaging, Neural networks, computer, Image interpretation, computer-assisted
Introduction
Quantitative MRI allows for the extraction of quantifiable features to assess disease severity and degree of change [1]. In nonalcoholic fatty liver disease (NAFLD), a spectrum of fat-associated liver pathology, fat accumulation is the triggering and offending mechanism, so many therapies are now targeted at reducing liver fat. Hence, the longitudinal evaluation of liver fat fraction for assessing disease progression or freatment response is of clinical and research interest [2–4]. Chemical shift—encoded MRI proton density fat fraction (MRI-PDFF) is an accurate and reproducible biomarker commonly used to assess changes in liver steatosis during treatment and clinical trials [3, 5].
In NAFLD, the magnitude and rate of PDFF reduction after treatment interventions are nonuniform [6], and therefore, studies suggest that regions of interest (ROIs) should be drawn in each Couinaud segment to accurately capture the disease severity and change [7]. Drawing ROIS in all liver segments is neither feasible nor efficient in busy clinical practice. In one study, Campos et al showed that the ROI time per exam varied from 53 to 150 s depending on the number of ROIs, size, and location [8]. Considering these results, it could require up to 5 min of manual work per patient, if drawing multiple ROIS is needed on both baseline and follow-up studies. Furthermore, the interpretation and computation of manual measurements often require specialized readers and may be prone to inter-reader variability or errors if performed by less experienced readers.
Convolutional neural network (CNN)-based registration algorithms allow an automated approach to assess change between examination time points [9]. This study aims to show the feasibility of CNN-based liver registration algorithm-generated difference maps for visual display of spatiotemporal changes in liver disease, using PDFF as a case example. These automated maps allow a more practical approach than manual annotations in clinical practice, potentially improving workflow.
Materials and methods
Design and population
This HIPAA-compliant retrospective exploratory study was approved by the institutional review board with a waived requirement for written informed consent. For this exploratory study, a convenience sample of 25 patients with at least two longitudinal liver PDFF-MRI examinations at least 3 months apart and who were undergoing weight loss interventions (weight loss surgery and/or very-low-calorie ketogenic diet [VLCKD]) at our institution were selected. Inclusion criteria were age ≥ 18 years, suspected or confirmed NAFLD based on clinical findings (e.g., obesity), abnormal laboratory tests and/or other imaging studies, and no contraindications for MRI. No exclusion criteria were applied.
MRI
Patients were imaged at 3.0 T with an 8-element torso phased-array coil (GE Signa, EXCITE HDxt, GE Healthcare). A multi-echo 2D spoiled gradient-recalled echo (SGRE) sequence was performed during a single breath-hold and PDFF parametric maps (PDFF images) generated using magnitude-based confounder corrected chemical shift- encoded data. Imaging parameters are described in Supplementary Materials Table A. 1.
CNN-based image registration and image series
Follow-up PDFF images were affine-registered to baseline PDFF images using a CNN-based liver registration algorithm. The registration algorithm combines a liver segmentation CNN and an affine transformation network. In brief, images to be registered are initially sent to an independently developed two-dimensional CNN with U-Net model architecture to segment the liver, producing a set of 2D binary liver masks. 2D liver masks are then concatenated to form a 3D liver mask. Subsequently, 3D liver masks are used as input to a 3D affine transformation network to focus registration on the liver. The affine transformation network is a neural network with a single 12-neuron dense layer representing 3D affine transformation parameters for translation, rotation, scaling, and shearing. The high accuracy of this liver-focused registration method has been described recently and ensures accurate colocalization of liver anatomy between baseline and follow up images [9]. Registered follow-up PDFF images were stored as DICOM files, resulting in three DICOM series: baseline PDFF images, unregistered follow-up PDFF images, and CNN-registered follow-up PDFF images.
Difference maps
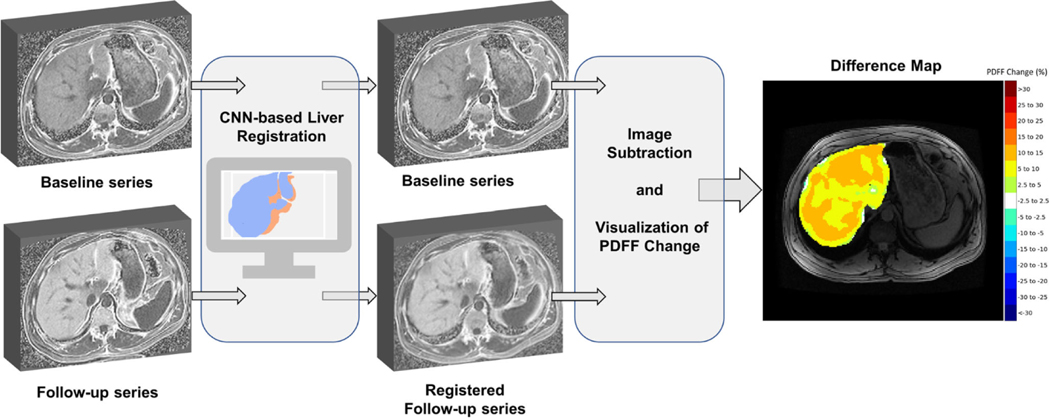
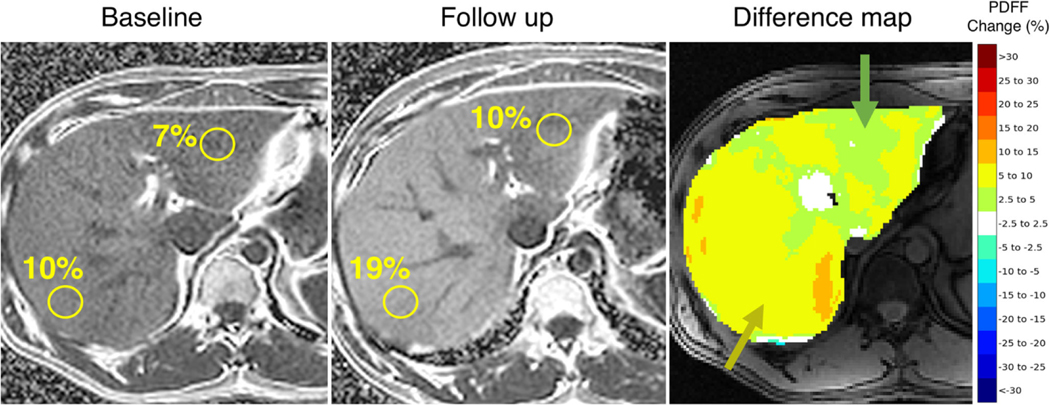
Following image registration, registered follow-up PDFF images were subtracted from baseline PDFF images to create difference maps displaying spatiotemporal PDFF changes, as shown in Fig. 1. The resulting difference map was then convolved with a 5.0 cm area round kernel to smooth the image, in reference to the round ROIs used in manual measurements. Smoothing was applied to the difference maps to ensure a fair comparison between manually and visually assessed estimates for PDFF change. PDFF change within the smoothed difference map was then categorized into the following groups: - 30 to - 5% in increments of 5%, - 2.5 to 2.5%, 5 to 30% in increments of 5%, as illustrated in Fig. 2. The categorical difference map was then visualized using the “jet” color spectrum to facilitate the visual assessment of absolute change in PDFF by readers. PDFF changes between - 2.5 and 2.5% were set to white to convey little or no PDFF change. Difference map categories were chosen to establish a balance between granularity of clinically significant PDFF changes and simplicity of visual assessment.
Fig. 1.
Development of difference color maps for longitudinal visualization and assessment of PDFF change. Follow-up PDFF maps are registered to baseline PDFF maps using a CNN-based liver registration algorithm. Registered follow-up PDFF maps are then subtracted from baseline PDFF maps, smoothed using a 5 cm2 round kernel, and colorcoded using a categorical color scale to create PDFF difference maps
Fig. 2.
The same patient baseline and follow-up PDFF maps with manually drawn ROIS and corresponding difference map for visual assessment of longitudinal PDFF change. According to manual ROIs, the patient exhibits a 3% increase and 9% increase in segments Ill and VIl, respectively. These heterogeneous increases are visually captured by the proposed difference map with the predominant alterations in green (2.5 – 5%) and yellow (5 – 10%), respectively
Image analysis
ROI-based measurements as a reference standard
All PDFF images were reviewed by a fellowship-trained abdominal radiologist (S.I.) with 8 years’ experience in liver imaging. For each patient, using a commercially available DICOM viewer software (OsiriX®), unregistered follow-up series were first manually aligned to their corresponding baseline series according to image similarity and table position, as performed in clinical practice. 5.0 cm2 area round ROIS were then manually drawn in each of the nine liver Couinaud segments on the baseline PDFF images and in a similar position on manually aligned follow-up PDFF images. ROI size and shape were determined so that ROIS could be placed in each liver segment while avoiding edges of the liver, segmental boundaries, vessels, or imaging artifacts. The 9-ROI approach was chosen to capture segmental PDFF variations in cases of nonuniform spatial distribution of liver fat.
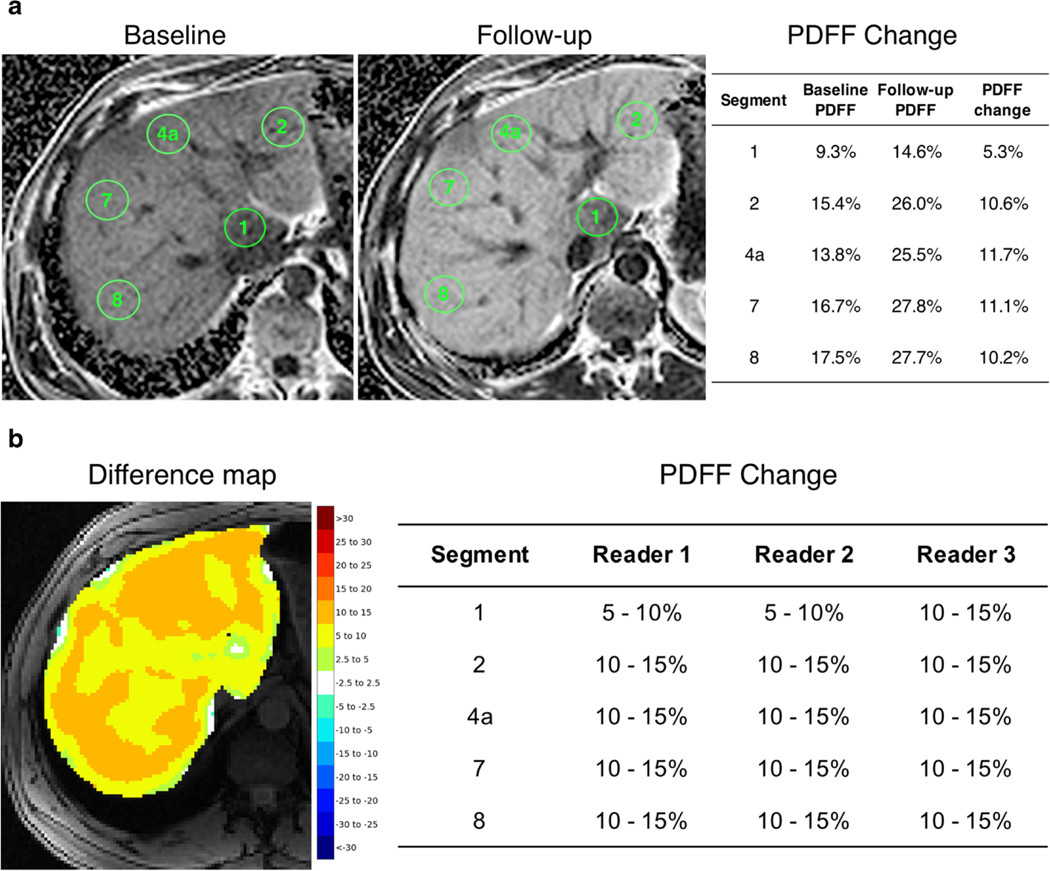
The mean PDFF values in each of the nine ROIS were used for analysis. Whole liver PDFF was calculated by averaging the mean values of all nine ROIs. PDFF changes were computed by subtracting follow-up segmental and whole liver mean PDFF estimates from their corresponding baseline PDFF estimates. Manual ROI measurements using the unregistered series reflect common clinical practice and were used as a reference standard to validate visually assessed PDFF changes. Example manual ROI annotations and computed PDFF changes are shown in Fig. 3.
Fig. 3.
Example ROI annotations on baseline and follow-up PDFF maps to manually estimate longitudinal PDFF change compared to readers visual assessment (a, b). 5 cm round ROIS were manually drawn in each of the 9 liver Couinaud segments across baseline and follow-up PDFF maps. Longitudinal PDFF changes were computed by subtracting followup segmental mean PDFF estimates from their corresponding baseline PDFF estimates (a). Readers’ visual assessment of segmental PDFF changes using the difference map (b)
Visual assessment of PDFF change
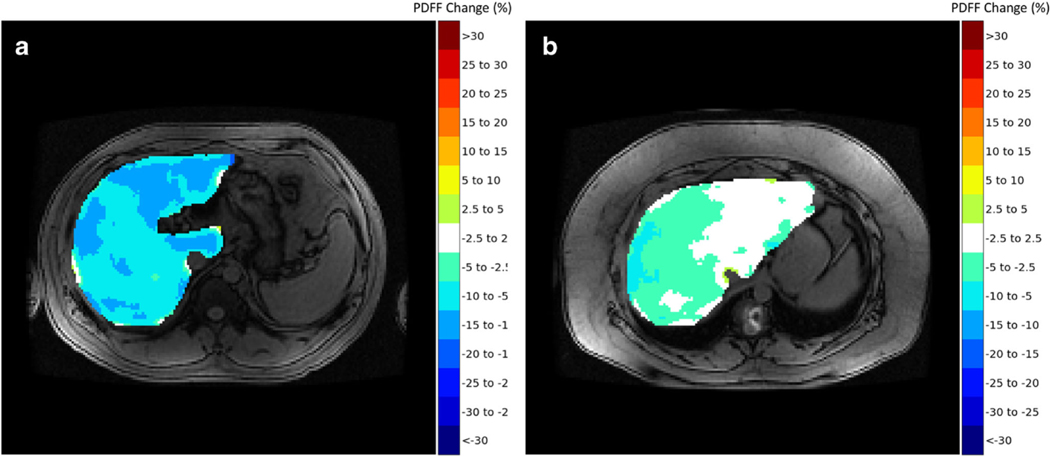
Two fellowship-trained abdominal radiologists (M.H.L., S.J.K.) each with 10 years’ experience in liver imaging and 3rd year radiology resident (S.F.D.), all blinded to patient information and the original PDFF maps, independently reviewed the difference color maps to visually determine longitudinal changes in PDFF across each of the nine liver segments. Maps were reviewed on an offline workstation using a software application for medical image navigation (ITK-SNAP [10]) without access to any other image. Written instructions were provided to readers before beginning the reading session for visual assessment of PDFF change. Instructions included information on how to open each case on the software application and details regarding the reads. For the latter, readers were allowed to scroll images up and down as well as zoom in and out, if necessary, similar to how they would perform a clinical read. They were asked to estimate the percent change in PDFF per liver segment following the color scheme and the corresponding color bar on the right of the image, recording the change per liver segment in an offline spreadsheet. If liver segments were heterogenous in color in the difference maps, readers were instructed to record what they viewed as the predominant PDFF change following the categorical color scheme. They were also instructed to ignore information in the outer contours of the liver as these are prone to cancellation artifacts inherent to chemical shift imaging and to consider standard liver segmental anatomy as anatomical structures were roughly displayed on the maps due to smoothing. Changes in each of the nine liver segments for each patient were recorded by each reader in accordance with PDFF changes represented by the categorical color scale. Whole liver PDFF changes were computed by averaging segmental PDFF changes. Example difference color maps used for visual assessment are shown in Fig. 4.
Fig. 4.
Proposed difference maps summarizing PDFF reductions between baseline and follow-up for two patients. a Patient 1 exhibits heterogeneous improvement in liver PDFF with slightly higher decrease in fat fraction in segments I, Ill, and IVb. b Patient 2 exhibits mild reduction in PDFF in segments VII and VIII, and no change in segments I, Ill, and most of segment Iva
Validation of CNN-based liver registration
The CNN-based liver registration algorithm used in this study has been shown to provide accurate results [9]. However, to ensure quantitative accuracy of PDFF difference maps and to further identify sources of potential disagreement amongst reader-based visual assessments, we further validated the CNN-based liver registrations in an auxiliary study. Manually drawn ROIS on the baseline PDFF images from the initial reading session were propagated onto the corresponding registered follow-up PDFF images without adjustment. Whole liver and segmental longitudinal PDFF changes were then computed by subtracting CNN-registered follow-up mean PDFF estimates from baseline mean PDFF estimates. ROI-based measurements using CNN-registered follow-up images were then used to validate the accuracy of the CNNPDFF Change (%) based liver registration algorithm against the reference standard, which uses manual alignment.
Statistical analysis
Statistical analyses were performed by a biostatistician (KAH) using the R-v3.4.0 software. Cohort demographics and PDFF at baseline and follow-up were summarized descriptively and compared using paired t tests. Reader-based visual categorizations were converted to a continuous scale using the midpoint of each respective color-coded category for analysis (i.e., 5–10% converted to 7.5%). Agreement between manually and visually assessed segmental and whole liver PDFF changes was evaluated using intraclass correlation (ICC) and Bland-Altman analysis. Inter-reader agreement was assessed using ICC and interpreted as follows: poor (< 0.5), moderate (0.50–0.75), good (0.75–0.090), and excellent (> 0.90) [11]. Agreement between PDFF changes computed using manually registered or CNN-registered follow-up images was also assessed using ICC and Bland-Altman analysis. Confidence intervals were calculated using bootstrapping.
Results
Study cohort
The mean age was 48.7 (SD ± 10.8) years and 12 patients were male. The mean interval between baseline and follow-up MRI-PDFF exams was 254.3 days (range: 97–511 days). Table 1 shows the means and ranges of whole liver and segmental PDFF at baseline, follow-up, and their corresponding PDFF difference. Baseline and follow-up PDFF ranged from 2.0 to 35.3% and 3.5 to 32.0%, respectively. For baseline and follow-up, segment 2 mean PDFF was significantly lower than mean PDFF for segments 3 to 8 (p values < 0.02); segment 8 mean PDFF was significantly greater than mean PDFF for segments 1 to 3 and 6 (p values < 0.05). Follow-up PDFF differences from baseline ranged from - 20.4 to 14.1%. Visually assessed PDFF changes ranged from - 27.5 to 12.5%, - 17.5 to 12.5%, and - 27.5 to 12.5% for readers 1, 2, and 3, respectively.
Table 1.
Mean ± SD and ranges of whole liver and segmental PDFF for baseline, follow-up, and PDFF change using manual ROIS
| Segment | Baseline PDFF | Follow-up PDFF | PDFF Change | ||||||
|---|---|---|---|---|---|---|---|---|---|
|
|
|
|
|||||||
| Mean ± SD | Min | Max | Mean ± SD | Min | Max | Mean ± SD | Min | Max | |
| Whole | 17.09 ± 7.20 | 4.68 | 33.11 | 17.38 ±6.33 | 6.63 | 30.32 | 0.29 ± 6.97 | − 18.13 | 12.02 |
| I | 15.69 ± 7.55 | 3.60 | 33.60 | 16.13 ± 6.07 | 5.20 | 30.70 | 0.44 ± 6.95 | − 18.20 | 13.40 |
| II | 15.46 ± 7.27 | 2.00 | 33.00 | 15.74 ± 5.86 | 3.50 | 29.30 | 0.28 ± 6.48 | − 17.30 | 10.80 |
| III | 17.18 ± 7.62 | 3.40 | 33.70 | 17.34 ± 6.95 | 4.90 | 31.00 | 0.15 ± 6.97 | − 18.50 | 10.30 |
| IVa | 17.48 ± 7.33 | 4.80 | 34.20 | 17.69 ± 6.43 | 7.20 | 32.00 | 0.21 ± 6.80 | − 18.70 | 12.30 |
| IVb | 17.60 ± 7.50 | 4.30 | 33.20 | 17.74 ± 7.21 | 6.20 | 30.50 | 0.15 ± 7.67 | − 18.80 | 14.10 |
| V | 17.49 ± 7.19 | 4.70 | 32.30 | 17.72 ± 6.93 | 6.80 | 30.60 | 0.23 ± 7.15 | − 18.20 | 12.70 |
| VI | 16.94 ± 7.12 | 5.70 | 32.50 | 17.64 ± 6.59 | 7.60 | 29.30 | 0.71 ± 7.11 | − 15.00 | 12.90 |
| VII | 17.87 ± 7.39 | 6.70 | 35.10 | 18.24 ± 6.32 | 8.10 | 28.70 | 0.37 ± 7.10 | − 18.10 | 11.40 |
| VIII | 18.14 ± 7.89 | 5.10 | 35.30 | 18.21 ± 6.67 | 7.50 | 31.70 | 0.07 ± 7.48 | − 20.40 | 13.00 |
Manual reference vs visually assessed PDFF change
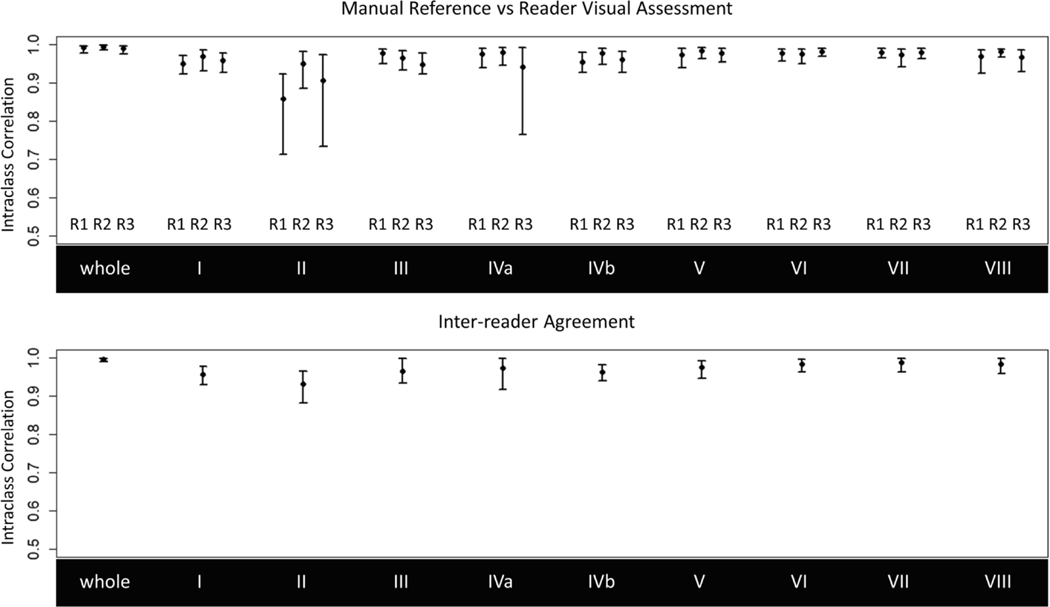
ICCs between manually and visually assessed segmental and whole liver PDFF changes for each reader are shown in Table 2 and Fig. 5. Visually assessed PDFF changes achieved a strong agreement with manual ROIS (ICCs > 0.95), except for visual estimates by readers 1 and 3 for segment 2 (ICCs = 0.86 and 0.91) and reader 3 for segment 4a (ICC = 0.94). Wider confidence intervals for segment 2 and segment 4a were observed due to outlier observations. Bland-Altman plots are shown in Fig. 6. There was no significant bias between manual and visual PDFF change assessment (p values >0.39) and limits of agreement were within 5% across all three readers.
Table 2.
Intraclass correlations between (1) manually and visually assessed whole liver and segmental PDFF changes and (2) readers for inter-reader agreement. Visually assessed PDFF changes achieved strong agreement with the manual reference (ICCs > 0.95) and inter-reader agreement was also strong (ICCs > 0.96) with exception of segment 2 (ICC = 0.93)
| Segment | Manual reference vs reader visual | Inter-reader visual | ||
|---|---|---|---|---|
|
|
||||
| Reader 1 | Reader 2 | Reader 3 | ||
| Whole | 0.99 (0.98, 1.00) | 0.99 (0.99, 1.00) | 0.99 (0.97, 1.00) | 0.99 (0.99, 1.00) |
| I | 0.95 (0.92, 0 97) | 0.97 (0.93, 0.98) | 0.96 (0.93, 0.98) | 0.96 (0.93, 0.98) |
| II | 0.86 (0.71, 0.92) | 0.95 (0.88, 0.98) | 0.91 (0.73, 0.97) | 0.93 (0.88, 0.97) |
| III | 0.98 (0.95, 0.99) | 0.96 (0.93, 0.98) | 0.95 (0.92, 0.98) | 0.96 (0.93, 1.00) |
| IVa | 0.98 (0.94, 0.99) | 0.98 (0.95, 0.99) | 0.94 (0.76, 0.99) | 0.97 (0.92, 1.00) |
| IVb | 0.95 (0.93, 0.98) | 0.98 (0.95, 0.99) | 0.96 (0.93, 0.98) | 0.96 (0.94, 0.98) |
| V | 0.97 (0.94, 0.99) | 0.98 (0.96, 0.99) | 0.98 (0.95, 0.99) | 0.97 (0.94, 0.99) |
| VI | 0.98 (0.96, 0.99) | 0.98 (0.95, 0.99) | 0.98 (0.97, 0.99) | 0.98 (0.96, 1.00) |
| VII | 0.98 (0.96, 0.99) | 0.97 (0.94, 0.99) | 0.98 (0.96, 0.99) | 0.99 (0.96, 1.00) |
| VIII | 0.97 (0.92, 0.98) | 0.98 (0.97, 0.99) | 0.97 (0.93, 0.98) | 0.98 (0.96, 1.00) |
Fig. 5.
Agreement between manually and visually assessed whole liver and segmental longitudinal PDFF changes by reader (top) and interreader agreement for visual assessment (bottom). Note the lower bound of the y-axes starts at 0.5 for visualization. Visually assessed PDFF changes achieved sfrong agreement with the manual reference (ICCs > 0.95) and inter-reader agreement was also strong (ICCs > 0.96) with exception of segment 2 (ICC = 0.93). Wide confidence intervals in segments 2 and 4a are attributed to outlier observations by their respective readers
Fig. 6.
Bland-Alman plots comparing manually and visually assessed longitudinal PDFF changes across readers. Biases were not significantly different from zero and limits of agreement were within 5% across all readers
Inter-reader agreement
Inter-reader ICCs for visually assessed PDFF changes are shown in Table 2 and Fig. 5. We observed excellent inter-reader agreement for segmental and whole liver PDFF change (ICCs > 0.96), although slightly lower for segment 2 (ICC = 0.93).
Manual reference vs CNN-registered PDFF change
ICCs comparing manually assessed PDFF changes computed using manually registered or CNN-registered follow-up images are shown in Supplementary Materials Figure A. 1 and Table A.2. Manual estimates using CNN-registered follow-up images achieved near-perfect agreement with the manual reference (ICCs > 0.99), suggesting accurate registration of the liver. The Bland-Altman analysis shows no significant bias (p value = 0.85) and limits of agreement were less than 1.5% (Supplementary Materials Figure A.2).
Discussion
In this study, we explored the feasibility of using a CNN-based registration algorithm to generate difference maps to display and allow visual assessment of spatiotemporal changes in liver PDFF, without needing manual annotations. Agreement between visually assessed PDFF changes and manual ROI analysis as well as inter-reader agreement for visually assessed segmental PDFF changes were calculated. We found strong agreement between visual and manual ROI-based PDFF change estimates, showing that a hands-free visual assessment of longitudinal changes in PDFF is feasible. Additionally, inter-reader agreement for visually assessed segmental PDFF changes was excellent among 3 independent readers, including a novice radiologist. CNN-based difference maps can potentially offer a practical alternative to laborious manually drawn ROIS for radiological quantitative assessment in longitudinal studies.
Visually assessed PDFF change based on color-coded maps showed high agreement across all readers, including a non-expert radiologist. A lower agreement between manually and visually assessed PDFF changes was observed in segment 2, in addition to slightly lower inter-reader agreement for visually assessed PDFF changes. Hooker et al investigated inter-reader agreement of longitudinal manual ROI-based segmental PDFF. With excellent agreement (ICC = 0.997) across 27 ROIS (i.e., whole liver) for PDFF changes, they also found lower agreement in segment 2 [5]. While we did not investigate factors affecting agreement, segment 2 smaller craniocaudal size and contact with the heart related motion may challenge ROI placement and introduce measurement variability. However, the inter-reader agreement for visual assessment in this segment was higher than prior reports using ROI-based methods [5]. We believe that this improvement is due to the use of organ-focused image registration which allows for accurate colocalization of liver anatomy across longitudinal studies [9].
As liver biopsy carries risks and may not reflect the true burden of disease due to sampling limitations, non-invasive imaging biomarkers are preferred [3, 4]. Bonekamp et al have investigated the spatial variability of liver PDFF using 27 individual segmental ROIS [7]. They found variable PDFF across segments, with consistently lower PDFF values in segment 2, and segment 8 showing the highest average PDFF. In our study, segment 2 had lower mean PDFF values at baseline and follow-up, with segments 7 and 8 exhibiting the highest fat fraction. Longitudinally, Dehkordy et al described different rates of steatosis regression across liver segments using segmental ROIS in patients undergoing weight loss surgery [6]. We found similar variability in change across segments, with segment 2 showing smaller variability in PDFF change than segment 8. Despite the excellent results at a segmental level, questions may rise about the frequency in which radiologists draw ROIS in each liver segment to assess changes in clinical practice. The proposed method can be also used to practically assess whole liver PDFF changes, as evidenced by the almost perfect agreement between manually and visually assessed whole liver PDFF changes. With excellent inter-reader agreement for the assessment of these variabilities in PDFF, difference maps are accurate and robust in depicting the spatial heterogeneity of changes of disease. The authors believe that this visual approach could also be used to facilitate the communication of results to non-radiologists in the multidisciplinary setting, as well as to display longitudinal changes to patients during their treatment. As a future direction of our work, we are interested in assessing the outcomes associated with the latter, potentially increasing patient adherence to freatment through a better understanding of treatment results.
Our study has limitations. As an exploratory study, our study has a small convenience cohort that did not include all ranges of PDFF values and a potential for selection bias that cannot be ignored. Categorization and color-coding of difference maps were empirically chosen with the objective of balancing granularity of PDFF changes and simplicity of visual assessment. Increasing the number of PDFF categories would improve precision of PDFF changes but would make visual distinction between similar color tones challenging. As changes in PDFF of ~ 2% likely represent true biological differences [12, 13], our 5% increments may have overlooked some of these changes, although the clinical relevance of such small PDFF changes is yet to be determined. Also, the lack of clear anatomical boundaries of liver segments in the color maps may have affected inter-reader agreement. Although other images could have been provided to readers to determine the boundaries of liver segments, morphological images were not provided to minimize potential bias due to signal intensity changes related to fat. Finally, we did not time readers when visually estimating PDFF changes, hindering the possibility of a head-to-head comparison with the manual analysis for time efficiency. Future studies should be performed to refine the visualization of difference maps and to evaluate the proposed difference maps for time efficiency.
In conclusion, visual assessment of liver segmental PDFF changes using a CNN-generated difference map strongly agreed with manual estimates performed by an expert reader and yielded high inter-reader agreement, potentially offering an efficient alternative to manual annotation for longitudinal follow-up. As future directions of our work, difference maps could be used to visually assess other quantitative imaging biomarkers, such as R2*, stiffness, or cT 1 and may be used to facilitate communication of results to referrers and their patients.
Supplementary Material
Key Points.
Visual assessment of longitudinal changes in quantitative liver MRI can be performed using a CNN-generated difference map and yields strong agreement with manual estimates performed by expert readers.
Acknowledgments
Funding The authors state that this work has not received any funding.
Abbreviations
- CNN
Convolutional neural networks
- ICC
Intraclass correlation
- MRI
Magnetic resonance imagmg
- PDFF
Proton density fat fraction
- ROI
Region of Interest
Footnotes
Compliance with ethical standards
Guarantor All authors take public responsibility for the content of this work. The data is also available by request to Dr Kyle A Hasenstab, PhD, the scientific guarantor of this publication.
Conflict of interest All authors or institutions involved in this work have no conflicts of interest or industry support to disclose with regard to the current manuscript. This includes financial or personal relationships that inappropriately influence his or her actions within 3 years of the work beginning submitted.
Statistics and biometry One of the authors (KH) has significant statistical expertise.
Informed consent Written informed consent was waived by the Institutional Review Board.
Ethical approval Institutional Review Board approval was obtained.
Methodology
• Retrospective, cross-sectional observational study performed at one institution
Supplementary Information The online version contains supplementary material available at https://doi.org/10.1007/s00330-020-07649-0.
References
- 1.Sullivan DC, Obuchowski NA, Kessler LG et al. (2015) Metrology standards for quantitative imaging biomarkers. Radiology. 277(3): 813–825. 10.1148/radiol.2015142202 [DOI] [PMC free article] [PubMed] [Google Scholar]
- 2.Reig M, Gambato M, Man NK et al. (2019) Should patients with NAFLD/NASH be surveyed for HCC? Transplantation. 103(1): 39–44. 10.1097/TP.0000000000002361 [DOI] [PubMed] [Google Scholar]
- 3.Middleton MS, Heba ER, Hooker CA et al. (2017) Agreement between magnetic resonance imaging proton density fat fraction measurements and pathologist-assigned steatosis grades of liver biopsies from adults with nonalcoholic steatohepatitis. Gastroenterology. 153(3):753–761. 10.1053/j.gastro.2017.06.005 [DOI] [PMC free article] [PubMed] [Google Scholar]
- 4.Adams LA, Sanderson S, Lindor KD, Angulo P (2005) The histological course of nonalcoholic fatty liver disease: a longitudinal study of 103 patients with sequential liver biopsies. J Hepatol 42(1): 132–138. 10.1016/j.jhep.2004.09.012 [DOI] [PubMed] [Google Scholar]
- 5.Hooker JC, Hamilton G, Park CC et al. (2019) Inter-reader agreement ofmagnetic resonance imaging proton density fat fraction and its longitudinal change in a clinical trial of adults with nonalcoholic steatohepatitis. Abdom Radiol (NY) 44(2):482–492. 10.1007/s00261-018-1745-3 [DOI] [PMC free article] [PubMed] [Google Scholar]
- 6.Dehkordy SF, Fowler KJ, Mamidipalli A et al. (2019) Hepatic steatosis and reduction in steatosis following bariatric weight loss surgery differs between segments and lobes. Eur Radiol 29(5): 2474–2480 [DOI] [PMC free article] [PubMed] [Google Scholar]
- 7.Bonekamp S, Tang A, Mashhood A et al. (2014) Spatial disfribution ofMRI-determined hepatic proton density fat fraction in adults with nonalcoholic fatty liver disease. J Magn Reson Imaging 39(6): 1525–1532. 10.100/00330-018-5894-0 [DOI] [PMC free article] [PubMed] [Google Scholar]
- 8.Campo CA, Hernando D, Schubert T, Bookwalter CA, Pay AJ, Reeder SB (2017) Standardized approach for ROI-based measurements ofproton density fat fraction and R2* in the liver. AJR Am J Roentgenol. 10.2214/AJR.17.17812 [DOI] [PMC free article] [PubMed] [Google Scholar]
- 9.Hasenstab KA, Cunha GM, Higaki A et al. (2019) Fully automated convolutional neural network-based affine algorithm improves liver regisfration and lesion co-localization on hepatobiliary phase Tlweighted MR images. Eur Radiol Exp 3(1):43. 10.1186/641747-019-0120-7 [DOI] [PMC free article] [PubMed] [Google Scholar]
- 10.Yushkevich PA, Piven J, Hazlett HC et al. (2006) User-guided 3D active contour segmentation of anatomical sfructures: significantly improved efficiency and reliability. Neuroimage. 31 1116–1128. 10.1016/j.neuroimage.2006.01.015 [DOI] [PubMed] [Google Scholar]
- 11.Koo TK, Li MY (2016) A guideline of selecting and reporting intraclass correlation coefficients for reliability research. J Chiropr Med 15(2):155–163. 10.1016/j.jcm.2016.02.012 [DOI] [PMC free article] [PubMed] [Google Scholar]
- 12.Serai SD, Dillman JR, Trout AT (2017) Proton density fat fraction measurements at 1.5-and 3-T hepatic MR imaging: same-day agreement among readers and across two imager manufacturers. Radiology. 284(1):244–254. 10.1148/radiol.2017161786 [DOI] [PubMed] [Google Scholar]
- 13.Yokoo T, Serai SD, Pirasteh A et al. (2018) Linearity, bias, and precision of hepatic proton density fat fraction measurements by using MR imaging: a meta-analysis. Radiology. 286(2):486–498. 10.1148/radiol.2017170550 [DOI] [PMC free article] [PubMed] [Google Scholar]
Associated Data
This section collects any data citations, data availability statements, or supplementary materials included in this article.


