

Abstract
Purpose
Detector arrays and profile‐scans have widely replaced film‐measurements for quality assurance (QA) on linear accelerators. Film is still used for relative output factor (ROF) measurements, positioning, and dose‐profile verification for annual Leksell Gamma Knife (LGK) QA. This study shows that small‐field active detector measurements can be performed in the easily accessed clinical mode and that they are an effective replacement to time‐consuming and exacting film measurements.
Methods
Beam profiles and positioning scans for 4‐mm, 8‐mm, and 16‐mm‐collimated fields were collected along the x‐, y‐, and z‐axes. The Exradin W2‐scintillator and the PTW microdiamond‐detector were placed in custom inserts centered in the Elekta solid‐water phantom for these scans. GafChromic EBT3‐film was irradiated with single uniformly collimated exposures as the clinical‐standard reference, using the same solid‐water phantom for profile tests and the Elekta film holder for radiation focal point (RFP)/patient‐positioning system (PPS) coincidence. All experimental data were compared to the tissue‐maximum‐ratio‐based (TMR10) dose calculation.
Results
The detector‐measured beam profiles and film‐based profiles showed excellent agreement with TMR10‐predicted full‐width, half‐maximum (FWHM) values. Absolute differences between the measured FWHM and FWHM from the treatment‐planning system were on average 0.13 mm, 0.08 mm, and 0.04 mm for film, microdiamond, and scintillator, respectively. The coincidence between the RFP and the PPS was measured to be ≤0.5 mm with microdiamond, ≤0.41 mm with the W2‐1 × 1 scintillator, and ≤0.22 mm using the film‐technique.
Conclusions
Small‐volume field detectors, used in conjunction with a clinically available phantom, an electrometer with data‐logging, and treatment plans created in clinical mode offer an efficient and viable alternative for film‐based profile tests. Position verification can be accurately performed when CBCT‐imaging is available to correct for residual detector‐position uncertainty. Scans are easily set up within the treatment‐planning‐system and, when coupled with an automated analysis, can provide accurate measurements within minutes.
Keywords: beam profile, gamma knife, microdiamond, scintillator, small field dosimetry
1. INTRODUCTION
The Leksell Gamma Knife (LGK) is a stereotactic radiosurgery tool specialized for treatment of intracranial disease. The Icon, employed in this study, is one of three LGK models in active use. 1 All use approximately 200 cobalt radiation sources focused at a stationary point in space that is referred to as the radiation focal point (RFP). For the Perfection and Icon, the 192 cobalt sources are arranged into eight independently selectable sectors with 24 sources per sector. Each sector can be moved to align the sources with 4‐mm, 8‐mm, 16‐mm diameter collimation channels, or into a fully blocked position.
A separate fixed coordinate system is determined for the patient, and treatment is localized to the disease site through alignment of these two coordinate systems. For the Perfection and Icon, the patients head is secured to the patient‐positioning system (PPS) (i.e., robotic couch) using a docking station and either (1) a rigid frame attached to the skull or (2) a thermoplastic mask with cone‐beam computed‐tomography (CBCT) registration. The main difference between the Icon and Perfexion is the on board imaging (CBCT) available with the Icon. The CBCT capability allows the stereotactic space to be defined relative to skull‐based anatomy and provides an alternative to the use of the stereotactic frame. The PPS‐center for the Perfection/Icon, defined with coordinates (100 mm, 100 mm, 100 mm), is the stereotactic unit center point and must be coincident with the RFP.
The verification of this alignment is an essential piece of the routine QA for these units, ensuring that the desired submillimeter radiological accuracy, <0.5 mm, can be achieved. 2 The RFP/PPS coincidence and CBCT spatial integrity on the Icon can be checked daily with vendor supplied software and tool, the “QA tool plus.”
In addition to spatial positioning, beam model verification checks are also essential. All Perfexion and the Icon units use identical, predefined beam model parameters in their treatment planning systems (TPSs) determined from Monte Carlo simulation. Beam profiles, sector uniformity and relative output factor (ROF) measurements are required to confirm the accuracy of the TPS model during commissioning, after a source exchange or major repair, and then annually. We do not specifically address sector uniformity in this paper.
QA is commonly performed with a diode detector for daily checks and an ionization chamber, phantom, and radiochromic film for more rigorous and precise annual and commissioning tests. Because of the prices and difficulty of using small field detectors, film was recommended as the detector of choice for profile measurements by the American Association of Physicists in Medicine (AAPM) task group (TG) 42 published in 1995.2 The more recently published report of AAPM TG1781 explicitly recommends the use of radiochromic film, citing its high spatial resolution, increased sensitivity, and wide availability, for (1) the testing of PPS positioning accuracy, (2) PPS‐center/RFP coincidence, and (3) for dose profile measurement.
Film dosimetry, however, remains a time‐consuming, multi‐step, and exacting procedure that generally requires manual image processing as part of the data analysis. To raise awareness of the correct application and limitation of radiographic film in clinical dosimetry, the AAPM TG235 recently published an update of their previous recommendations (TG55) for film dosimetry, 3 , 4 and TG178 includes an appendix detailing practical suggestions for performing film‐based QA for LGK. At the same time, the awareness and guidance surrounding the use of small field detectors has increased substantially, with many facilities now including small‐field detectors as standard components in their equipment inventory. 5 , 6
Several groups have explored alternatives to film dosimetry, specifically for LGK QA. Bank used the 2‐mm‐wide PinPoint micro‐ion chamber from Physikalisch‐Technische Werkstätten GmbH (PTW) in the 16‐cm‐spherical acrylonitrile butadiene styrene (ABS) plastic‐phantom to manually scan the beam profile of an earlier Model B Gamma Knife with all four collimator settings (4, 8, 14, and 18 mm). 7 The 0.5‐mm‐stepsize scans showed good agreement with V‐film measurements in the peak and full‐width half‐maximum (FWHM) range but a 1%–2% difference in the dose tails. Without automation, however, the manual detector movement could not compete with the single‐shot 2D‐dose maps of film measurements.
ROF‐measurements require only a fixed detector in the isocenter and were the first of the annual film measurements to be widely compared with measurements of other types of detectors, including silicon diodes, diamond detector, TLD cubes, alanine pellets, a pinpoint air ionization chamber, and a liquid ionization chamber. 8 , 9 , 10 With respect to active detector use, TRS483 dose formalism requires correction factors that convert absorbed dose to water for the machine‐specific reference field to the absorbed dose to water for the clinical field. For water‐equivalent detectors, the reading will be directly proportional to the absorbed dose to water and the field output correction factor is 1. 11 , 12
While radiochromic GafChromic EBT3 film is probably still the most widely employed technique for ROF measurements on the LGK Perfexion, 13 our department has been using the PTW‐60019 synthetic single‐crystal microdiamond detector for the past 3 years and found it to be comparable in accuracy and beneficial both in its ability to provide real‐time measurement and the simplicity associated with a direct read‐out.
Mancosu et al. utilized the PTW‐60019 for ROF measurements. 14 Additionally, with this detector mounted in the Elekta ABS plastic phantom, they were able to use the PPS to scan and collect beam profile data in the x‐, y‐ and z‐directions for the 4‐mm collimator and reported FWHM differences from TPS calculated values of less than 0.2 and 0.3 mm for parallel and transversal acquisitions, respectively. 14 These scans, however, were measured in service mode—not accessible in the LGK Icon to general users and requiring support from a service engineer. This drawback is also noted in the material section of a very recent publication by Maraghechi et al. where all required measurements for the annual LGK QA (i.e., dose rate, ROF beam profiles, sector uniformity, and RFP/PPC coincidence) were performed with both, GafChromic EBT3 film and a microdiamond detector, to assess the feasibility of a filmless annual QA. 15
The purpose of this study is to compare two kinds of point detectors for filmless QA of beam profiles and RFP/PPS coincidence and demonstrate a fast, scanning procedure that can be easily set up in the standard Gamma Plan treatment planning environment or in Physics Mode (available with Leksell Gamma Plan software version 11.1.3).
2. MATERIALS AND METHODS
Measurements were performed using a LGK Icon, Leksell Gamma Plan (software version 11.1.1, and 11.1.3) with the TMR10 beam model. The LGK Dosimetry Phantom constructed of therapy grade Solid Water (SW) with custom inserts was used for phantom‐based active detector measurements as well as for film‐based profile measurements (Figure 1). Also shown in Figure 1 is the film tool used for film‐based checks of RFP/PPS coincidence and PPS positioning.
FIGURE 1.

The Elekta solid water phantom with a range of custom inserts for different detectors, solid water (SW) phantom mounted on the patient‐positioning system (PPS) (robotic couch) open to show film positioning in the two orthogonal axes (xy and xz). The film holder mounted on the PPS with film compartment (mounted in the central position and oriented along the YZ plane) and with our 3D‐printed adapter holding the microdiamond detector for in‐air PPS positioning testing (mounted in the central location)
All QA tests were performed using GafChromic EBT3 film and two different point detectors: the PTW microdiamond detector (Model No. 60019, Physikalisch‐Technische Werkstätten GmbH, Freiburg, Germany) and the 1 × 1 mm SI W2 plastic scintillator detector (Model Exradin W2‐1 × 1, Standard Imaging Inc., Middleton, WI, USA).
The W2 scintillator has the same scintillation fiber as the W1, with the benefit of water‐equivalent material. The W2 also has a dedicated optical detection and signal processing unit (Model MAX SD, Standard Imaging Inc., Middleton, WI, USA) that allows for continuous profile scans. 16 , 17
2.1. Beam profile tests (FWHM and penumbra)
2.1.1. Plan creation
Profile scans, active detectors
Nine plans were manually generated in the Leksell Gamma Plan TPS, TMR‐10. The x‐ y‐, and z‐directional scans were created separately, one each, for a uniform shot using each one of the three fixed collimations sizes (4 mm, 8 mm, and 16 mm). The scanning shot locations were varied along one axis, keeping the remaining two parameters set at 100. The range of movement was chosen to cover the full penumbra for measurements in x, y, and z. We used positional ranges on either side of the RFP/PPS (100 mm, 100 mm, and 100 mm) of ±6 mm, ±9 mm, and ±18 mm for the 4‐mm, 8‐mm, and 16‐mm collimators, respectively. Up to 69 measurement positions were distributed in these ranges with step sizes between 0.1 mm in the expected penumbra region up to 1 mm in the low dose tail. The maximum number of measurements points was along the z‐direction to facilitate accurate capture of the steeper penumbra and asymmetry. The “beam‐on time” for each position was kept constant and set to times as low as the minimum time allowed in the software, 0.1 min; the dose rate at the time of the measurement was 2.691 Gy/min.
Static exposures, film
Three plans were created with a single‐uniform shot delivered at PPS center (100,100,100), one for each collimation (4 mm, 8 mm, and 16 mm). The time was set to deliver 4 Gy at the 100% isodose line (IDL).
The additional four plans were created to establish a calibration curve. Each of these used a single 16‐mm shot located at (100,100,100), with prescription doses of 8 Gy, 3.2 Gy, 2 Gy, and 0.8 Gy at the 100% IDL.
2.1.2. Profile measurements and analysis
2.1.2.1. Active detectors
The detectors were inserted into the SW phantom, with customized and precision‐drilled adaptors. Images of the point detectors positioned centrally inside the SW phantom from a computed‐tomography (CT) scanner (Siemens SOMATOM Definition AS20, 0.6 mm slices) and the GK‐Icon CBCT (Icon, 6.3 mGy) are shown in Figure 2. The detector was oriented parallel to and along the Leksell z coordinate axis.
FIGURE 2.

From top to bottom: The Exradin W2‐1 × 1 scintillator and PTW microdiamond (60019) inside the solid water phantom. The first four columns are CT reconstructions (Siemens Somaton Definition AS20); from left to right: a coronal image of the entire phantom and detector, axial, longitudinal, and sagittal reconstructions. The fifth column is the CBCT reconstruction from the Gamma Knife Icon (6.3 mGy mode). The insets on the right enlarge the CBCT image at the tip of the microdiamond in the solid water phantom (A) and in air (B)
The phantom was next mounted on the PPS using the Leksell Coordinate Frame G adapter. The plans were delivered in clinical mode at the treatment console. The microdiamond detector was directly connected to a PC Electrometer (Sun Nuclear Corporation, Melbourne, FL, USA) for data collection. When using the W2 scintillator, the optical signal is preprocessed in the Max SD optical detection unit using a Cherenkov light ratio of blue and green scintillation measured on a Varian Truebeam linear accelerator. 16 The analog output was then connected to the PC electrometer. Both the integrated charge and the current were logged in 0.5 s time steps and saved as a comma‐separated‐value file. The beam is blocked every time the target position is changed, causing the current to simultaneously drop to zero, and this current drop was used to separate individual shots for evaluation.
The sequence of scan positions is internally predetermined in Gamma Plan (11.1.1). For the x‐ and y‐directions, the couch started the scan at an offset, moved to one extreme, then to the other extreme, and finally returned to the center; for the z‐direction, the treatment couch continuously moved in one direction.
Each plan was exported in PDF format, and data were postprocessed to sequence the x‐ and y‐positions. An in‐house MATLAB (The MathWorks Inc., Natick, MA, USA) program was written to match each measurement to the target position defined in Gamma Plan.
The data were stepwise linearly interpolated at the two closest scanning positions to 80%, 50%, and 20% of the maximum. The FWHM was calculated as the difference between the positions for the 50% point in the rising and falling edge of the profile; the penumbra was calculated as the difference between the 80% and 20% positions.
2.1.2.2. Film
EBT3 film was placed in the SW phantom in the X‐Z and Y‐Z planes and irradiated with 4‐mm, 8‐mm, and 16‐mm shots, for a total of six films. Note that the half‐maximum of the recorded transmittance does not equal the half‐maximum of the dose due to the nonlinear dose response of film. Calibration films were irradiated at doses of 0.8 Gy, 2 Gy, 3.2 Gy, 4 Gy, and 8 Gy. The film was analyzed following recommendations of the AAPM TGs 55, 235, and 178. 3 , 4 Fingerprints, mechanical stress, and exposures to daylight were avoided. The film was scanned at 400 dpi (0.064 mm per pixel) and 48‐bit depth (16‐bit from each color channel of the scanned image) with color correction turned off and saved in the lossless Tag Image File Format. The image was then analyzed in ImageJ, consistent with the methodology described in Appendix B of TG‐178.1
2.2. RFP/PPS coincidence check
2.2.1. Active detector
RFP/PPS offsets were calculated from the beam profile scans described above for 4‐mm, 8‐mm, and 16‐mm collimated shots. The coordinate of the RFP was defined as the midpoint between the half‐maximum of the rising and of the falling edge in the respective dose profiles. The PPS center for the scintillator and microdiamond was corrected for detector positioning errors based on CBCT imaging, as suggested by a recent publication. 18
2.2.2. Film
The RFP position was performed with using the vendor‐supplied film holder, with the film compartment mounted in the central position and a pinprick indicating PPS center. The film holder was attached to the PPS using the patient frame G adapter. Six films were irradiated for this test. Three films were irradiated in the X‐Z plane (4‐mm, 8‐mm, and 16‐mm collimated shots, 4 Gy prescribed to the 100% IDL), the film compartment was rotated 90 degrees, and the additional three films were irradiated in the Y‐Z plane (4‐mm, 8‐mm, and 16‐mm collimated shots, 4 Gy prescribed to the 100% IDL).
2.3. PPS positioning check
Two profile scans, in the x‐direction only, were performed for proof of concept, using the microdiamond detector without any build‐up material mounted in a 3D printed adapter attached to the film holder tool. The film compartment was removed, and the detector/adapter inserted (Figure 1). The first scan was performed with the detector in the central position and the second with the detector at the inferior left corner (160 mm, 40 mm, 100 mm). Plans were generated in the physics mode, with a uniform collimation of 4 mm, and a uniform step size increment in the x coordinate of 0.5 mm.
Two films were irradiated in the film holder (4‐mm collimation, 4 Gy), with film compartment attached in the offset position corresponding to coordinates (160 mm, 40 mm, 100 mm) (Figure 1).
3. RESULTS
Figure 3 shows the beam profiles in x‐, y‐ and z‐direction for irradiation with all eight sectors using the 4‐mm, 8‐mm, and 16‐mm collimations. The beam profile of the calculated dose distribution from Gamma Plan is shown as a black line. The film measurement is shown as a red line, and the measurements from the W2 scintillator and microdiamond are shown as green triangles and red circles, respectively. Error bars based on the standard deviation of the mean for three consecutive scans were smaller than the symbols (mean standard deviation = 0.07% [0.01%, 1.15%] for doses >20% of the maximum) and are omitted for readability.
FIGURE 3.
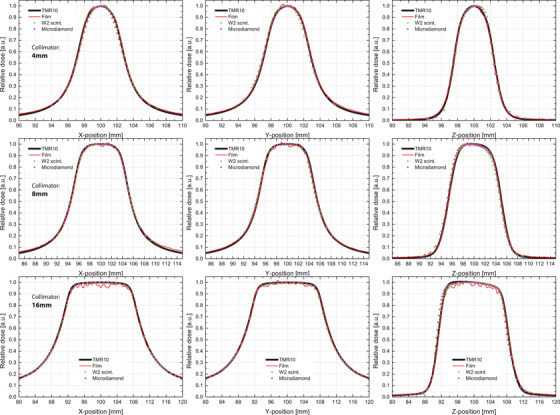
The normalized beam profiles results for a uniform shot with 4 mm‐, 8 mm‐, and 16 mm‐collimation using GafChromic EBT3 film, a PTW microdiamond (60019) detector, an Exradin W2‐1 × 1 scintillator detector, and treatment planning system reference TMR10 profiles
The data were normalized to the maximum and corrected for detector position based on the prescan CBCT evaluation; the effective point of measurement for the scintillator and microdiamond detectors were (100.67, 99.64, 99.9) and (99.8, 99.7, 100.3), respectively.
CBCT coincidence with the PPS is tested daily with the CBCT Precision Test, confirming submillimeter agreement well below the recommended tolerance of 0.4 mm. The mean discrepancy between the CBCT and PPS coordinate system centers for the most recent 2‐month period is 0.08 mm (median = 0.07 mm, SD = 0.03 mm, min = 0.03 mm, max = 0.16 mm).
Tables 1, 2, and 3 summarize the measured FWHM and size of penumbra, for the 4‐mm, 8‐mm, and 16‐mm collimated irradiations. Active detector scan results and film results are presented alongside the expected TMR10 model values that serve as the benchmark for our TPS. The recently published results from the Maraghechi et al. are included in parentheses for comparison.
TABLE 1.
The full‐width half‐maximum (mm) and penumbra for 4‐mm scans shown in Figure 3; the delta column shows the difference between TMR TPS values and the measured values (Msmt). Tolerance from TG‐178 is ±1 mm of TPS values; action level is ±1.2 mm of TPS values 1
| TMR 10 TPS values | Film | Microdiamond | W2 scintillator | |||||
|---|---|---|---|---|---|---|---|---|
| Collimation: 4 mm | Msmt (mm) | (mm) | Msmt (mm) | (mm) | Msmt (mm) | (mm) | ||
| FWHM | x profile | 6.16 | 6.18 (6.0) a | 0.06 | 5.97 (6.2) a | −0.19 | 6.11 | −0.05 |
| y profile | 6.16 | 6.22 (5.5) a | 0.06 | 6.30 (6.2) a | 0.14 | 6.17 | −0.10 | |
| z profile | 5.04 | 5.02 (4.9) a | −0.02 | 4.96 (5.0) a | −0.08 | 5.07 | −0.03 | |
| Penumbra | x profile | 2.82 | 2.87 (2.7) a | 0.05 | 3.04 (2.9) a | 0.22 | 2.97 | 0.15 |
| y profile | 2.82 | 3.10 (2.9) a | 0.28 | 3.02 (2.9) a | 0.20 | 2.99 | 0.17 | |
| z profile | 1.52 | 1.49 (1.5) a | −0.03 | 1.58 (1.6) a | 0.06 | 1.83 | 0.31 | |
Abbreviations: FWHM, full‐width, half‐maximum; TPS, treatment planning systems; Msmt, measured values (Msmt).
Data shown in parentheses are from Maraghechi et al.15, included for comparison.
TABLE 2.
The full‐width half‐maximum (mm) and penumbra for 8‐mm scans shown in Figure 3; the delta column shows the difference between TMR TPS values and the measured values. Tolerance from TG‐178 is ±1 mm of TPS values; action level is ±1.2 mm of TPS values 1
| Film | Microdiamond | W2 scintillator | ||||||
|---|---|---|---|---|---|---|---|---|
| Collimation: 8 mm | TMR 10 TPS values | Msmt (mm) | Δ (mm) | Msmt (mm) | Δ (mm) | Msmt (mm) | Δ (mm) | |
| FWHM | x profile | 11.06 | 10.87 (10.8) a | −0.19 | 11.18 (11.1) a | 0.12 | 11.05 | −0.01 |
| y profile | 11.06 | 10.86 (10.5) a | −0.20 | 11.17 (11.1) a | 0.11 | 11.00 | −0.06 | |
| z profile | 9.8 | 9.84 (9.7) a | 0.04 | 9.79 (9.7) a | −0.01 | 9.78 | −0.02 | |
| Penumbra | x profile | 3.95 | 4.04 (3.9) a | 0.09 | 4.08 (4.1) a | 0.13 | 3.96 | 0.01 |
| y profile | 3.95 | 4.11 (4.2) a | 0.16 | 4.12 (4.2) a | 0.17 | 4.12 | 0.17 | |
| z profile | 2.29 | 2.46 (2.4) a | 0.17 | 2.25 (2.4) a | −0.05 | 2.50 | 0.21 | |
Abbreviations: FWHM, full‐width, half‐maximum; TPS, treatment planning systems; Msmt, measured values (Msmt).
Data shown in parentheses are from Maraghechi et al.15, included for comparison.
TABLE 3.
The full‐width half‐maximum (mm) and penumbra for 16‐mm scans shown in Figure 3; the delta column shows the difference between TMR TPS values and the measured values. Tolerance from TG‐178 is ±1 mm of TPS values; Action level is ±1.2 mm of TPS values 1
| Film | Microdiamond | W2 scintillator | ||||||
|---|---|---|---|---|---|---|---|---|
| Collimation: 16 mm | TMR 10 TPS values | Msmt (mm) | (mm) | Msmt (mm) | (mm) | Msmt (mm) | (mm) | |
| FWHM | x profile | 21.75 | 21.4 (21.6) a | −0.35 | 21.73 (11.1) a | −0.02 | 21.71 | −0.01 |
| y profile | 21.75 | 21.46 (21.5) a | −0.29 | 21.77 (11.1) a | 0.02 | 21.58 | −0.06 | |
| z profile | 17.44 | 17.43 (17.3) a | −0.01 | 17.44 (9.7) a | 0.00 | 17.46 | −0.02 | |
| Penumbra | x profile | 9.03 | 8.96 (9) a | −0.07 | 9.00 (4.1) a | −0.03 | 8.91 | −0.12 |
| y profile | 9.03 | 9.21 (8.6) a | 0.18 | 9.09 (4.2) a | 0.06 | 9.07 | 0.04 | |
| z profile | 2.55 | 2.62 (2.6) a | 0.07 | 2.52 (2.4) a | −0.03 | 2.76 | 0.21 | |
Abbreviations: FWHM, full‐width, half‐maximum; TPS, treatment planning systems; Msmt, measured values (Msmt).
Data shown in parentheses are from Maraghechi et al.15, included for comparison.
The average differences from the TMR10‐FWHM in (Δx, Δy, Δz) for the 4‐mm, 8‐mm and 16‐mm focal sizes are (0.04 mm, 0.14 mm, 0.22 mm) for film; (0.05 mm, 0.08 mm, 0.01 mm) for the microdiamond; and (0.05 mm, 0.03 mm, 0.03 mm) for the W2. Differences in the penumbra are of similar magnitude. The microdiamond scans agree well with the previously published data.
The RFP and PPS coincidences are shown in Table 4. The radial offsets from the PPS at (100, 100, 100) position measured by film, microdiamond, and scintillator techniques respectively are 0.2 mm, 0.5 mm, and 0.41 mm with 4 mm collimation; 0.22 mm, 0.1 mm, and 0.22 mm with 8‐mm collimation; and 0.21 mm, 0.08 mm, and 0.36 mm with 16 mm collimation. Offsets larger than 0.2 mm are only found in z‐direction which is the direction of detector alignment. No correction for the asymmetry in the z‐profile, found mainly in the low dose tail toward the opening of the Gamma Knife, was applied.
TABLE 4.
Differences between the radiation focal point (RFP) and the patient‐positioning system (PPS) center; RFP defined as the midpoint of the full‐width, half‐maximum (FWHM) for the beam profiles and PPS center defined by either the pinprick location or the PPS shot coordinates in the static‐film and moving active detector scans, respectively
| Collimator and axis | Film | Microdiamond | W2 scintillator | |
|---|---|---|---|---|
| 4 mm | x coord | −0.10 (0.07) a | 0.01 (0.18) a | −0.05 |
| y coord | 0.08 (0.03) a | 0.0 (0.16) a | 0.19 | |
| z coord | 0.16 (0.28) a | −0.5 (0.21) a | −0.36 | |
| Δr (mm) | 0.20 (0.29) a | 0.50 (0.29) a | 0.41 | |
| 8 mm | x coord | −0.13 (0.1) a | 0.01 (0.16) a | −0.06 |
| y coord | 0.03 (0.2) a | 0.09 (0.13) a | 0.18 | |
| z coord | 0.17 (0.21) a | 0.03 (0.23) a | 0.12 | |
| Δr (mm) | 0.22 (0.3) a | 0.10 (0.3) a | 0.22 | |
| 16 mm | x coord | −0.11 (0.09) a | 0.03 (0.21) a | −0.07 |
| y coord | 0.17 (0.18) a | 0.10 (0.06) a | 0.19 | |
| z coord | 0.05 (0.2) a | −0.07 (0.15) a | 0.30 | |
| Δr (mm) | 0.21 (0.28) a | 0.12 (0.26) a | 0.36 | |
Data shown in parentheses are from Maraghechi et al.15, included for comparison.
While our study was not initially designed to test the accurate movement of the PPS with active detectors, we performed a proof‐of‐concept set of paired in‐air scans, with the diamond detector mounted on the film holder tool (100, 100, 100) and (160, 40, 100) and assessed the x‐offset for a single 4‐mm shot to be within 0.25 mm of each another. Corresponding film quantification of PPS positioning offset error between these two locations was 0.1 mm.
4. DISCUSSIONS
4.1. Beam profiles
The W2 scintillator and PTW microdiamond are both dedicated small field detectors with the capacity to scan steep gradients. The W2‐1 × 1 scintillator has a volume of 0.0008 cm3 (1.0 mm diameter x 1.0 mm long), and the microdiamond detector has a small active volume of only 0.000004 cm3 (2.2 mm diameter, 1 μm thickness). The scintillator is made of water‐equivalent material as verified by the low contrast to the solid water phantom in Figure 2. The sensitive volume of the microdiamond is nearly water equivalent, but electrodes attached to the diamond appear with high contrast near the active volume.
The profile measurements with the small field detectors in the solid water phantom closely follow the TMR10 calculation, and the FWHM is well within the TG178‐specified annual QA tolerance of 1 mm.1 In fact, the shape of the beam profile is smoother and closer to the Gamma Plan prediction than the film measurement that displays some ripple (noise) at the peak dose, as well as in the penumbra and low dose tails. As discussed for profile measurements on linacs, 17 broadening of the beam profile due to the lateral response function of the microdiamond (1.6 mm) and scintillator (0.5 mm) 19 was observed to have minimal impact (see Figure 3), even for the smallest shot size (4‐mm collimation).
The reordering of exposure positions within the Gamma Plan software (version 11.1.1) added additional complexity to our data‐processing. This reordering also occurs in the more recent version (11.1.3); however the user can specify the sequence by generating a test profile plan directly in the physics mode module, and this can be saved for future scanning and may be a simpler solution.
An additional aspect that must be considered when contrasting film measurements with active‐detector scanning is the effect of positioning errors on the measurement data. The film is exposed in a static, fixed position, while the active‐detector scans involve movement of the PPS. Any errors or nonlinearity in PPS movement thus has the potential to introduce scaling or profile shape distortion into the measurements. A scenario might be imagined where cross‐checking between film and active‐detector scan results is both prudent and necessary.
4.2. PPS placement accuracy
Accuracy of PPS placement of a treatment site at RFP was assessed in our proof‐of‐concept in‐air scans with the microdiamond. Our in‐air 3D printed plastic detector holder was noted to have residual movement, even when fully attached to the film holder tool. This may explain the larger delta measured relative to film for the offset treatment position. Precision manufacturing of detector‐specific attachments for the film holder tool could help to further reduce setup uncertainty.
4.3. RFP‐PPS offset
The RFP/PPS coincidence was within the action levels defined by Elekta and TG 178 (Δr ≤ 0.5 mm and Δx, Δy, Δz, ≤ 0.3 mm), 1 with the exception of the z‐directional checks on the 4‐mm collimation for both the detectors (Δz = 0.5 mm and Δz = 0.36 mm). The pinpoint test with film showed a smaller offset (max Δx, Δy, Δz = 0.17 mm). Increased resolution of the film and asymmetry of the radiation profile along this axis might account for the slightly lower performance of the active detectors. Further discretization and increase in scan points along might improve results further.
4.4. CBCT imaging
The custom‐drilled inserts allowed us to reproducibly position our detectors near the center of the solid water phantom. We corrected for the residual offset of the detector active volume from phantom center with a premeasurement CBCT (6.3 mGy). The need for this correction introduces an additional complication for GK users with models that do not have onboard imaging. However, if the user can demonstrate that this offset is known and reproducible, the offset can be quantified with CT imaging of the phantom, holder, and detector assembly.
4.5. Comparison with existing studies performed in GK service mode
Our results, performed in clinical and physics mode, confirm and are supported other publications, which used active detectors as replacements for film‐based measurements for routine QA tasks on the GK unit. Our RFP/PPS results were slightly poorer than the Maraghechi publication in the z‐direction and may indicate a need for increased attention and resolution along this axis. An additional CBCT after the z‐scan could confirm the detector staying fixed throughout the scan.
4.6. Required step‐size and time
The beam profiles were scanned with a minimum of 60 points and adjusted step sizes. With exposure time set to the system minimum of 0.1 min, this corresponds to a beam‐on time of 6 min per profile. The smallest step size was 0.1 mm around ±0.5 mm of the anticipated half‐maximum. It is possible that the number of measurement points can be significantly reduced when the data are interpolated or fitted; however care must be taken that the distribution and shape of the profile is not altered. For example, linear interpolation overestimates the size of the penumbra if the sampling step‐size is too large in the convex part of the profile. Theoretically, there may be some instances when accurate curve fitting can allow us to reduce beam‐on time even further, making point‐detector scans a cheap and competitive alterative to recently developed 2D‐detector arrays. 20
5. CONCLUSION
The quality assurance tests at the Gamma Knife can be streamlined by replacing film‐based QA with detector measurements. The microdiamond has already replaced film for relative‐output‐factor measurements in our clinical routine, and here, we demonstrate that both in‐phantom measurements with the microdiamond and W2 scintillator are viable replacements for the film‐based profile test. RFP/PPC coincidence tests and PPS positioning tests are also feasible.
The GK Icon CBCT imaging was incorporated as a technique to correct for systematic errors stemming from detector positioning. CBCT reduces the uncertainty to acceptable levels and provides the submillimeter precision required for assessment of the RFP and PPS coincidence.
Profile scans can be easily set up in the clinical mode of Gamma Plan that is available to all users. Postprocessing can be easily automated, and results can be made digitally available within minutes.
CONFLICT OF INTEREST
The authors declare that there is no conflict of interest that could be perceived as prejudicing the impartiality of the research reported.
ACKNOWLEDGMENT
The authors would like to thank the Gamma Knife team under leadership of Douglas Kondziolka for their support.
Rudek B, Bernstein K, Osterman S, Qu T. Replacing gamma knife beam‐profiles on film with point‐detector scans. J Appl Clin Med Phys. 2022;23:e13522. 10.1002/acm2.13522
REFERENCES
- 1. Petti PL, Rivard MJ, Alvarez PE, et al. Recommendations on the practice of calibration, dosimetry, and quality assurance for gamma stereotactic radiosurgery: report of AAPM task group 178. Med Phys. 2021;48:e733–e770. [DOI] [PubMed] [Google Scholar]
- 2. Schell MC, Bova FJ, Larson DA, Leavitt DD, Lutz WR, Podgorsak EB, Wu A. Stereotactic Radiosurgery, Report of Task Group 42, Radiation Therapy Committee, American Institue of Physics Inc., Woodbury, NY. https://www.aapm.org/pubs/reports/detail.asp?docid=53, June 1995. 10.37206/53 [DOI]
- 3. Niroomand‐Rad A, Chiu‐Tsao S‐T, Grams MP, et al. Report of AAPM task group 235 radiochromic film dosimetry: an update to TG‐55. Med Phys. 2020;47:5986–6025. [DOI] [PubMed] [Google Scholar]
- 4. Niroomand‐Rad A, Blackwell CR, Coursey BM, et al. Radiochromic film dosimetry: recommendations of AAPM radiation therapy committee task group 55. Med Phys. 1998;25:2093–2115. [DOI] [PubMed] [Google Scholar]
- 5. Gul A, Fukuda S, Mizuno H, Taku N, Kakakhel MB, Mirza SM. Feasibility study of using stereotactic field diode for field output factors measurement and evaluating three new detectors for small field relative dosimetry of 6 and 10 MV photon beams. J Appl Clin Med Phys. 2020;21:23–36. [DOI] [PMC free article] [PubMed] [Google Scholar]
- 6. Das IJ, Francescon P, Moran JM, et al. Report of AAPM task group 155: megavoltage photon beam dosimetry in small fields and non‐equilibrium conditions. Med Phys. 2021;48:e886–e921. [DOI] [PubMed] [Google Scholar]
- 7. Bank MI. Ion chamber measurements of transverse gamma knife beam profiles. J Appl Clin Med Phys. 2002;3:12–18. [DOI] [PMC free article] [PubMed] [Google Scholar]
- 8. Tsai J‐S, Rivard MJ, Engler MJ, Mignano JE, Wazer DE, Shucart WA. Determination of the 4 mm Gamma Knife helmet relative output factor using a variety of detectors. Med Phys. 2003;30:986–992. [DOI] [PubMed] [Google Scholar]
- 9. Mack A, Scheib SG, Major J, et al. Precision dosimetry for narrow photon beams used in radiosurgery ‐ determination of Gamma Knife® output factors. Med Phys. 2002;29:2080–2089. [DOI] [PubMed] [Google Scholar]
- 10. Benmakhlouf H, Johansson J, Paddick I, Andreo P. Monte Carlo calculated and experimentally determined output correction factors for small field detectors in Leksell Gamma Knife Perfexion beams. Phys Med Biol. 2015;60:3959–3973. [DOI] [PubMed] [Google Scholar]
- 11. Carrasco P, Jornet N, Jordi O, et al. Characterization of the Exradin W1 scintillator for use in radiotherapy. Med Phys. 2015;42:297–304. [DOI] [PubMed] [Google Scholar]
- 12. Weintroub S. International Atomic Energy Agency. Nature 207, 1138 (1965). 10.1038/2071138a0 [DOI]
- 13. Novotny J, Bhatnagar JP, Quader MA, Bednarz G, Lunsford LD, Huq MS. Measurement of relative output factors for the 8 and 4 mm collimators of Leksell Gamma Knife Perfexion by film dosimetry. Med Phys. 2009;36:1768–1774. [DOI] [PubMed] [Google Scholar]
- 14. Mancosu P, Reggiori G, Stravato A, et al. Evaluation of a synthetic single‐crystal diamond detector for relative dosimetry on the Leksell Gamma Knife Perfexion radiosurgery system. Med Phys. 2015;42:5035–5041. [DOI] [PubMed] [Google Scholar]
- 15. Maraghechi B, Kim T, Mitchell TJ, et al. Filmless quality assurance of a Leksell Gamma Knife® Icon™. J Appl Clin Med Phys. 2021;22:59–67. [DOI] [PMC free article] [PubMed] [Google Scholar]
- 16. Galavis PE, Hu L, Holmes S, Das IJ. Characterization of the plastic scintillation detector Exradin W2 for small field dosimetry. Medical Physics. 2019;46:2468–2476. [DOI] [PubMed] [Google Scholar]
- 17. Burke E, Poppinga D, Schönfeld AA, Harder D, Poppe B, Looe HK. The practical application of scintillation dosimetry in small‐field photon‐beam radiotherapy. Z Med Phys. 2017;27:324–333. [DOI] [PubMed] [Google Scholar]
- 18. Cyriac SL, Liu J, Calugaru E, Chang J. A novel and effective method for validation and measurement of output factors for Leksell Gamma Knife® Icon™ using TRS 483 protocol. J Appl Clin Med Phys. 2020;21:80–88. [DOI] [PMC free article] [PubMed] [Google Scholar]
- 19. Poppinga D, Meyners J, Delfs B, et al. Experimental determination of the lateral dose response functions of detectors to be applied in the measurement of narrow photon‐beam dose profiles. Phys Med Biol. 2015;60:9421–9436. [DOI] [PubMed] [Google Scholar]
- 20. Shukaili KAl, Corde S, Petasecca M, et al. Characterization of ELEKTA SRS cone collimator using high spatial resolution monolithic silicon detector array. J Appl Clin Med Phys. 2018;19:114–124. [DOI] [PMC free article] [PubMed] [Google Scholar]