

Abstract
Inflammation early in life can prime the local immune milieu of peripheral tissues, which can cause lasting changes in immunological tone that confer disease protection or susceptibility1. The cellular and molecular mechanisms that prompt changes in immune tone in many nonlymphoid tissues remain largely unknown. Here we find that time-limited neonatal inflammation induced by a transient reduction in neonatal regulatory T cells causes a dysregulation of subcutaneous tissue in mouse skin. This is accompanied by the selective accumulation of type 2 helper T (TH2) cells within a distinct microanatomical niche. TH2 cells are maintained into adulthood through interactions with a fibroblast population in skin fascia that we refer to as TH2-interacting fascial fibroblasts (TIFFs), which expand in response to TH2 cytokines to form subcutaneous fibrous bands. Activation of the TH2–TIFF niche due to neonatal inflammation primes the skin for altered reparative responses to wounding. Furthermore, we identify fibroblasts in healthy human skin that express the TIFF transcriptional signature and detect these cells at high levels in eosinophilic fasciitis, an orphan disease characterized by inflammation and fibrosis of the skin fascia. Taken together, these data define a previously unidentified TH2 cell niche in skin and functionally characterize a disease-associated fibroblast population. The results also suggest a mechanism of immunological priming whereby inflammation early in life creates networks between adaptive immune cells and stromal cells to establish an immunological set-point in tissues that is maintained throughout life.
A wave of neonatal regulatory T (neoTreg) cells seeds murine skin between postnatal days 6 and 13 (P6–P13)2,3. We hypothesized that attenuating this influx of Treg cells could influence postnatal development of the immune compartment of skin. We tested this by administering two injections of low-dose diphtheria toxin (DT) to Foxp3DTR mice4 at P8 and P15. Unlike continuous dosing, which causes uncontrolled autoimmunity4, two-shot dosing caused transient T-cell-mediated inflammation with minimal weight loss, no overt clinical symptoms of autoimmunity and full restoration of the cutaneous and lymphoid Treg cell compartments (Extended Data Fig. 1a–f).
NeoTreg cell reduction alters the skin subcutis
The epidermis and dermis of skin sit atop layers of adipocytes and stroma called the subcutis or hypodermis (Fig. 1a). During the inflammatory phase after reduction of neoTreg cells, we observed an architectural derangement of the subcutis in Foxp3DTR mice that was characterized by the loss of adipocytes and the formation of hyperplastic fibrous bands (Fig. 1b, c). Qualitative stromal expansion was also present in gonadal adipose tissue but not in ear skin, the lungs or the colon. By contrast, fibrous bands were not present in DT-injected wild-type mice (Extended Data Fig. 1g, h, Supplementary Fig. 1a). Adult mice depleted of Treg cells (ΔadTreg mice) exhibited a comparable loss of Treg cells and immune infiltration; however, adipocytes were intact and fibrous bands were not observed (Fig. 1d, Extended Data Fig. 1c–f). Thus, a transient reduction in Treg cells causes age-specific subcutaneous dysfunction and expansion of an unknown stromal cell type.
Fig. 1 |. Transient neoTreg cell reduction causes temporary derangement of stromal architecture and lasting TH2 cell accumulation in the skin subcutis.

a, Schematic of the anatomical layers of murine skin. dWAT, dermal white adipose tissue; PC, panniculus carnosus. b, Schematic of the experiment. FoxP3DTR mice were treated with either PBS (Ctrl) or DT at indicated postnatal days. c–e, Representative skin histology images of mice euthanized at 10 days (c, d) or 35 days (e), with fibrous bands outlined. Scale bars, 100 μm. f, g, Flow cytometry analysis (f) and quantification (g) of TH2 cells in skin from adult (P50) Il5Red5/+;FoxP3DTR mice following neoTreg cell reduction. n = 3–7 animals per data point (47 total), one experiment per time point. h, Quantification of skin T helper subsets by intracellular cytokine staining at P50. n = 17 animals. i, Lymphocyte integrin expression in ΔneoTreg mice at P50. j, k, Representative images (j) and quantification (k) of TH2 and ILC2 cell localization in skin of ΔneoTreg Il5Red5/+; Rosa26tdTomato/+;FoxP3DTR mice. Cells were segmented by tdTomato and CD3 expression. Dotted lines denote the boundary between the dermis and subcutis. Scale bar, 100 μm. n = 3 animals. Data are displayed as the mean ± s.d. from one independent experiment, representative of two to three repeats (b–j). NS, not significant. *P < 0.05, ***P < 0.001 (all two-sided); two-way analysis of variance (ANOVA) with Šidák’s multiple comparisons test (g, h) or Student’s t-test (k).
We next investigated whether ΔneoTreg mice had lasting alterations in skin. Skin architecture normalized over time, and the immune composition of ΔneoTreg skin resembled skin of control mice by adulthood. However, there was one exception: an increase in TH2 cells in the skin (Fig. 1e–h, Extended Data Fig 2a–f). Using an Il5Red5 reporter mouse line to more accurately identify TH2 cells5, we determined that TH2 cells were absent in the skin of adult control mice but constituted approximately 8–12% of CD4+ T effector (Teff) cells in the skin of adult ΔneoTreg mice and persisted for at least 90 days after DT injection (Fig. 1f, g). TH2 cells were selectively increased in skin, with no corresponding increases in other major cutaneous lymphocyte subsets (Fig. 1h, Extended Data Fig. 2d–f).
Lymphocytes in naive mouse skin reside primarily in the epidermis and dermis and express the integrin CD103 (refs.6–8). By contrast, skin TH2 cells in ΔneoTreg mice were CD103− and expressed CD49d (also known as integrin α4; Fig. 1i, Extended Data Fig. 3a–c). Confocal microscopy and flow cytometry analyses of separated skin layers showed that integrin expression in lymphocytes correlated with their microanatomical localization. CD49d+ TH2 cells were located preferentially in the subcutis, whereas other skin lymphocytes were found in the dermis and epidermis (Fig. 1j, k, Extended Data Fig. 3d, e). Small populations of non-TH2 lymphocytes found in the subcutis were also predominantly CD49d+ (Extended Data Fig. 3f). The CD49d+CD103− phenotype may therefore be a shared feature of lymphocytes in this region of skin.
As both CD49d+ TH2 cells and fibrous bands appeared in the subcutis, we investigated whether differential TH2 cell responses in neonates and adults correlated with the age-specific formation of fibrous bands. More CD49d+ TH2 cells and eosinophils accumulated in ΔneoTreg mice than ΔadTreg mice at the time of fibrous band formation (Extended Data Fig. 3g–i). Treatment of ΔneoTreg mice with FTY720 (which inhibits the lymph-node egress of lymphocytes) attenuated the accumulation of TH2 cells in skin and the formation of fibrous bands (Extended Data Fig. 3j–l). However, by 35 days after DT injection, CD49d+ TH2 cells were present at similar frequencies in both ΔneoTreg mice and ΔadTreg mice (Extended Data Fig. 3m, n), which suggests that the lower number of TH2 cells that seed the adult subcutis during inflammation persist in this region of skin after inflammation resolves. Therefore, although the greater magnitude of type 2 inflammation in ΔneoTreg mice correlates with fibrous band formation, the subcutis can support the presence of TH2 cells in the absence of fibrous band formation.
Identification of TIFFs in subcutaneous fibrous bands
The co-occurrence of TH2 cell accumulation and fibrous band formation in ΔneoTreg mice prompted us to seek a stromal population (or populations) present in the fibrous bands that might interact with type 2 immune cells. Single-cell RNA sequencing (scRNA-seq) of stromal cells (CD45−EpCAM−CD31−) sorted from skin of control mice and ΔneoTreg mice revealed two clusters that were highly increased in ΔneoTreg skin and preferentially expressed the TH2 cytokine receptor genes Il4ra and Il13ra1 (Fig. 2a–c, Supplementary Tables 1 and 2). These two clusters were probably the same cell type, with the smaller cluster undergoing proliferation (Extended Data Fig. 4a). Il13ra1+ stromal cells expressed canonical fibroblast markers, extracellular matrix (ECM) components and numerous immune-related genes. NeoTreg reduction led to these cells to upregulate ECM components such as Fn1 and Postn and the eosinophil chemoattractant Ccl11 (Extended Data Fig. 4b–e). A comparison with a recent cross-tissue meta-analysis of murine fibroblasts demonstrated that Il13ra1+ fibroblasts bear a strong transcriptional similarity to a subset of Pi16+Anxa3+ fibroblasts present in many organs9 (Extended Data Fig. 5). Although these cells have been annotated in recent single-cell atlases10,11, a unified understanding of their phenotypical, anatomical and functional characteristics remains to be elucidated.
Fig. 2 |. neoTreg cell reduction causes outgrowth of an Il13ra1+ fibroblast population in skin fascia.
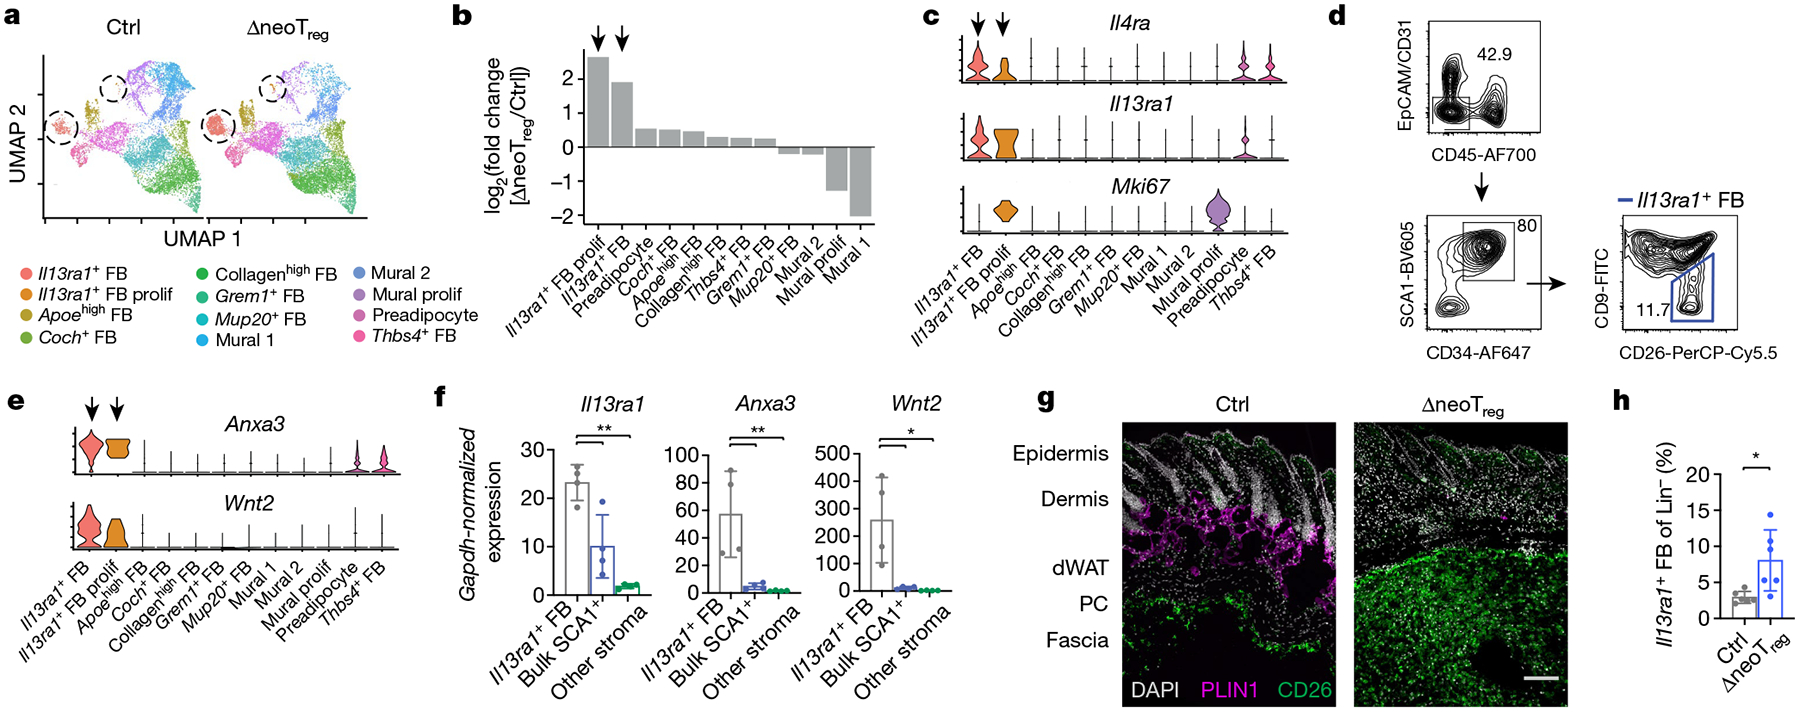
a–d, scRNA-seq of Lin− stromal cells (EpCAM−CD31−CD45−) sorted from skin of control and ΔneoTreg mice at P22. Il13ra1+ fibroblast (FB) clusters are circled. n = 2 animals pooled per group. prolif, proliferative. a, Unsupervised clustering. b, Relative cluster abundance in ΔneoTreg skin. Arrows indicate Il13ra1+ FB clusters. c, Gene expression by cluster in control sample. d, Gating strategy for Il13ra1+ fibroblasts in P25 control skin. The top plot shows total live cells. e, f, Expression of selected Il13ra1+ FB markers identified by scRNA-seq (e) was measured by quantitative PCR of sorted cells (f) to validate the gating strategy in d (bulk SCA1+: CD34+ SCA1+CD26+/−CD9+; other stroma: CD34−SCA1−; f). n = 4 animals. g, Localization of Il13ra1+ fibroblasts stained for CD26 in back skin of P25 mice. Scale bar, 50 μm. h, Flow cytometry quantification of Il13ra1+ fibroblasts at P22. n = 12 animals. Data are displayed as the mean ± s.d. from one independent experiment, representative of one (a–c, e) or two-to-three repeats (d, f–h). *P < 0.05, **P < 0.01 (all two-sided); repeated measures ANOVA with Geisser–Greenhouse correction and Dunnett’s multiple comparisons test (f) or Student’s t-test (h).
Guided by transcriptional data, we validated a flow cytometry gating strategy for skin Il13ra1+ fibroblasts as Lin−CD34+PDPN+SCA1+CD26+CD9− (Fig. 2d–f, Extended Data Fig. 4f, g, Supplementary Fig. 1b). Immunofluorescence microscopy revealed high-intensity CD26 staining in the fascia, which is the lower-most layer of the subcutis in mice (Figs. 1a and 2g). CD26high fascia was present in skin from the back, but not skin from the ear or tail (Extended Data Fig. 6a). CD26high fascia was generally located beneath the panniculus carnosus (PC) skeletal muscle layer but could also be found adjacent to adipocytes in regions lacking the PC (Extended Data Fig. 6a, b). Although papillary dermal fibroblasts also express CD26 at low levels12 (Fig. 2g), Il13ra1+ fibroblasts were only found in the subcutis after flow cytometry of separated skin layers, a result consistent with fascial localization (Extended Data Fig. 6c). We also used scRNA-seq to identify Fgf18 as a marker of Il13ra1+ fibroblasts and verified their localization in Fgf18CreERT2;Rosa26tdTomato mice. Stellate CD26+FGF18+ cells were primarily located in the fascia, with sparse amounts of FGF18+ cells higher in the subcutis (Extended Data Fig. 6d, e). As expected, FGF18+ hair follicle keratinocytes13 not captured in our scRNA-seq dataset were also observed in the skin of these mice (Extended Data Fig. 6e). Given the marked expansion of CD26high fascia (as measured by immunofluorescence) and increased Il13ra1+ fibroblasts (as measured by flow cytometry) after the depletion of neoTreg cells, we conclude that fibrous bands in ΔneoTreg mice are derived from the expansion of fascial Il13ra1+ fibroblasts (Fig. 2g, h). We provisionally refer to these cells as TH2-interacting fascial fibroblasts (TIFFs).
TH2–TIFF interactions in the subcutaneous niche
The expression of Il13ra1 by TIFFs suggested that these cells may respond to TH2 cytokines. Subcutaneous injection of the TH2 effector cytokines IL-4 and IL-13 or the TH2-inducing alarmin IL-33 induced TIFF proliferation and fascial expansion in young wild-type mice, which histologically resembled the fibrous bands seen after neoTreg cell reduction (Fig. 3a, b, Extended Data Fig. 7a). Conversely, TIFF expansion was attenuated in ΔneoTreg mice crossed to strains deficient in either Il33 or Il4 and Il13 (Fig. 3c, d, Extended Data Fig. 7b). Of note, TIFFs expressed lower levels of IL-4RA in adult mice than in young mice (Extended Data Fig. 7c). In contrast to adTreg cell reduction, exogenous cytokine delivery drove fascial expansion in adult mice, which was accompanied by increases in type 2 innate lymphoid cells (ILC2) and eosinophils in skin. This result suggests that supraphysiological type 2 immune stimuli can expand TIFFs regardless of age (Extended Data Fig. 7d–f). To test whether TIFFs enhance skin TH2 cell survival and/or activation, we next isolated skin IL-5Red5+ TH2 cells from ΔneoTreg mice and co-cultured them with primary TIFFs or dermal fibroblasts. Co-culture with TIFFs induced higher TH2 cell numbers, proliferation and IL-5 production than dermal fibroblasts (Fig. 3e, f, Extended Data Fig. 7g, h). These data suggest that TH2 cells preferentially maintained within the subcutis after neonatal inflammation may receive support from TIFFs that promotes their survival, proliferation and/or activation.
Fig. 3 |. Reciprocal interactions between skin TH2 cells and Il13ra1+ fibroblasts (TIFFs) drive fascial expansion and TH2 cell maintenance.

a, b, Representative images (a) and quantification (b) of control mice treated with subcutaneous IL-33 or a complex of IL-4–anti-IL-4 antibody (IL-4c) with IL-13 from P15 to P21. Dotted lines denote fascial expansion. n = 16 animals. Scale bar, 100 μm. c, d, TIFF quantification by flow cytometry after neoTreg depletion in Il4/Il13−/−;FoxP3DTR mice (c) and Il33−/−;FoxP3DTR mice (d). n = 9 (c) or 8 (d). e, f, TIFFs and dermal fibroblasts were sorted from P21 mouse skin and co-cultured with sorted IL-5Red5+ skin TH2 cells from P28 ΔneoTreg mice for 4 days. n = 12 (e) or 18 (f) samples. g, Expression of ST2 in skin lymphocytes from ΔneoTreg mice aged to P50. h, Expression of IL33 in skin stromal populations from Il33mch/+; FoxP3DTR mice aged to P50. n = 4 animals. i, Control Il33mch/+ skin at P50. Inset boxes, magnified views of epidermis/dermis (1) and fascia (2). Scale bar, 100μm. j, Skin TH2 cell frequency in ΔneoTreg mice crossed with the IL-33-deficient Il33mch/mch background. n = 8 animals. k, Skin TH2 cell frequency in ΔneoTreg mice that were aged to adulthood and treated with subcutaneous PBS or IL-33. n = 8 animals. Data are displayed as mean ± s.d. from one independent experiment, representative of two to three repeats (a–k). *P < 0.05, **P < 0.01, ***P < 0.001 (all two-sided); Welch ANOVA with Dunnett’s multiple comparisons test (b, e–h) or Student’s t-test (c, d, j, k).
Activation of type 2 immune responses in skin is initiated in part by the local release of alarmins such as TSLP, IL-18 and IL-33 (refs.14–16). We found that approximately 80% of skin TH2 cells in ΔneoTreg mice expressed the IL-33 receptor ST2, which is in contrast to other skin-resident lymphocyte populations, which were largely ST2−IL-18R1+ (Fig. 3g, Extended Data Fig. 7i, j). Similar to the expression pattern of integrins CD103 and CD49d, lymphocyte IL-18R1 and ST2 corresponded to tissue localization, with ST2 enriched in subdermal lymphocytes and IL-18R1 found in epidermis- and dermis-resident cells (Extended Data Fig. 7k, l). The polarized expression of integrins and alarmin cytokine receptors may therefore reflect a stratification of skin lymphocytes into epithelial-associated and purely stromal cell niches. Using an Il33H2B−mCherry reporter mouse line, we noted higher IL-33 production in TIFFs than in other stromal cell populations (Fig. 3h, i). IL-33-deficient Il33mch/mch;Foxp3DTR mice showed reduced accumulation of skin TH2 cells following neoTreg cell reduction, whereas subcutaneous injection of IL-33 into adult ΔneoTreg mice robustly expanded skin TH2 cells (Fig. 3j, k). Taken together, these data suggest that IL-33 production is one mechanism by which TIFFs support skin TH2 cells within the subdermal niche.
Treg cell depletion induces a pleiotropic systemic immune response that may not reflect physiological inflammation. We therefore tested whether key features of ΔneoTreg mice—a durable accumulation of CD49d+ skin TH2 cells and TIFF expansion—occur in other models of inflammation. Subcutaneous immunization of neonatal wild-type mice with ovalbumin and papain induced TIFF and TH2 cell accumulation after 7 days, with CD49d+ TH2 cells persisting in skin for at least 30 days after the injection (Extended Data Fig. 8a–d). TIFF accumulation was blunted in mice with a fibroblast-specific deletion of Il4ra and immunized with ovalbumin and papain, which mirrored ΔneoTreg mice and demonstrates that cell-intrinsic type 2 cytokine signalling is required for maximal TIFF expansion (Extended Data Fig. 8e, f). We also exposed wild-type mice to the helminth Nippostrongylus brasiliensis, which breaches murine skin to enter circulation as part of its life cycle17. Neonatal N. brasiliensis infection also induced TIFF and skin CD49d+ TH2 cell accumulation (Extended Data Fig. 8g–j). Thus, the TH2–TIFF niche can be primed by a variety of early-life immune stimuli that cause type 2 inflammation in the subcutis.
Early-life inflammation primes adult tissue repair
Priming of the skin TH2–TIFF niche in ΔneoTreg mice suggested that inflammation in early life might alter immune responses in adulthood. Indeed, re-challenge of ΔneoTreg mice (but not controls) with DT during adulthood recapitulated the stromal dysfunction seen after neoTreg cell depletion (Extended Data Fig. 9a, b). We next tested the immune response of ΔneoTreg skin to full-thickness wounding, a process modulated by pro-reparative signals from type 2 immune cells that receives major contributions from subdermal fibroblasts12,18. Recent work has also shown that fascial tissue can migrate into wound beds and recruit resident immune cells19. To test whether any observed differences in wound healing of ΔneoTreg mice are dependent on TH2 cells, we also wounded ΔneoTreg/ΔTH2 littermates (Il5Red−5/+;Rosa26DTA/+;Foxp3DTR), in which skin TH2 cell numbers are reduced by about 85% (Extended Data Fig. 9c). Although both ILC2 and TH2 cells are diminished in ΔneoTreg/ΔTH2 mice, skin ILC2 cells numbers were not increased in ΔneoTreg mice before or after wounding, which makes ILC2-driven differences in wound healing less probable (Extended Data Fig. 9c, d).
Skin TH2 cells in ΔneoTreg mice responded robustly to wounding, quadrupling in numbers in wound beds within 4 days after injury (Extended Data Fig. 9e–g). ΔneoTreg mice experienced faster wound closure (quantified by the rate constant k)20 and greater accumulation of TH2-responsive myeloid populations than control or ΔneoTreg/ΔTH2 mice (Extended Data Fig. 9h–k, Supplementary Fig. 1c). TIFFs were initially reduced after wounding but rebounded to a greater extent in ΔneoTreg skin during the proliferative stage of healing (Extended Data Fig. 9l–n), which suggests that there was enhanced regeneration of the fascia in these mice. These wound-healing parameters were unaffected by treatment with FTY720, which is consistent with the idea that skin-resident TH2 cells drive the repair response rather than lymph-node-primed TH2 cells (Extended Data Fig. 9o–u). Similar effects were observed in wounded mice neonatally immunized with ovalbumin and papain (Extended Data Fig. 9v–ab). Taken together, these data indicate that early-life priming of the TH2–TIFF niche increases reparative responses during adulthood.
TIFF-like fibroblasts exist in humans
Numerous layers of fascia have been identified anatomically in humans, including superficial fascia in the skin subcutis21. To test whether TIFFs exist in humans, stromal cells were isolated from three samples of healthy human skin by fluorescence-activated cell sorting (FACS), and the purified samples were then subjected to scRNA-seq (Fig. 4a, Extended Data Fig. 10a). We annotated two clusters of human stromal cells as potential fascial fibroblasts (fFBs; fFB1 and fFB2) on the basis of their preferential expression of murine TIFF markers, including PI16, SFRP2 and OGN (Fig. 4b, Extended Data Fig. 10b, Supplementary Table 3). These markers were also expressed at lower levels in another population of mouse fibroblasts that we annotated as THBS4+ fibroblasts (Fig. 4b, Extended Data Fig. 4a). TIFF-expressed immunological genes such as IL13RA1, CXCL12 and CXCL14 were enriched in human fFB1 and fFB2 cells, although IL18 and IL33 were not (Extended Data Fig. 10c). As there are no conserved cell-type-defining markers validated for TIFFs, we used multiple bioinformatics approaches to compare the murine TIFF (mTIFF) transcriptome to putative human fFB clusters with greater statistical rigour. Expression of the mTIFF module score was highest in human fFB clusters, and a 144-gene mTIFF signature gene set was also significantly enriched in human fFB1 and fFB2 cells (Fig. 4c, d, Supplementary Table 4). Moreover, human fFB1 and fFB2 cells co-clustered with mouse TIFFs and THBS4+ fibroblasts after cross-species integration of mouse and human datasets22,23 (Extended Data Fig. 10d). On the basis of these analyses, we conclude that human skin contains fibroblasts that share a core transcriptional signature with mTIFFs and THBS4+ fibroblasts, which suggests that human fFB1 and fFB2 cells types might exhibit similar biological behaviours to TIFFs during human cutaneous inflammation.
Fig. 4 |. TIFF-like cells are present in healthy human skin and in a fibroinflammatory disease of the fascia.
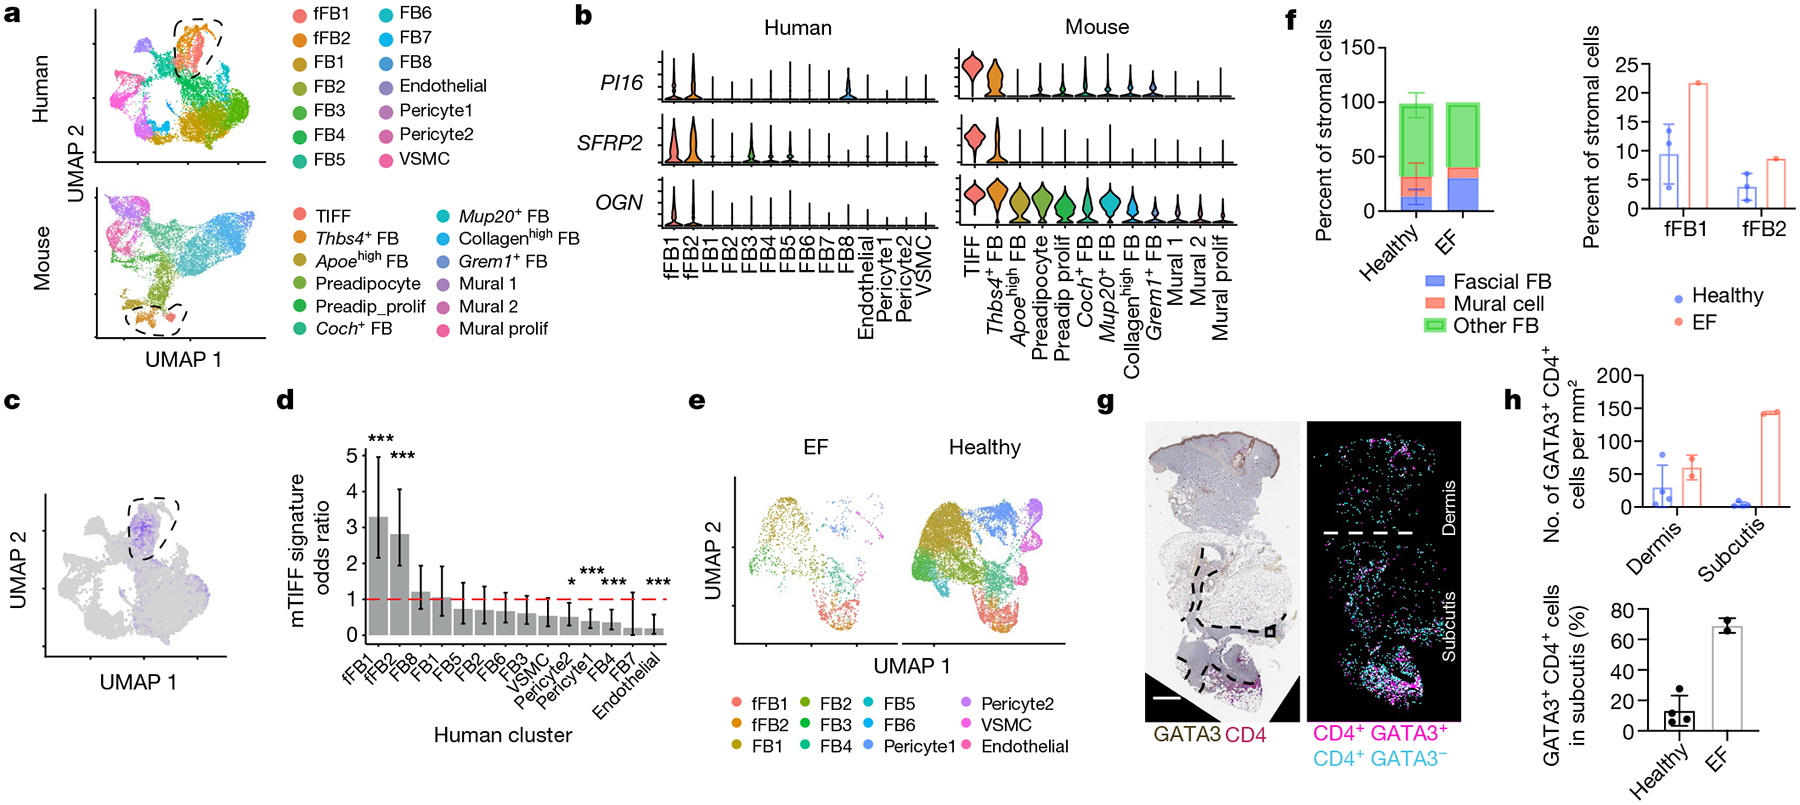
a, Unsupervised clustering of scRNA-seq from FACS-purified stromal cells in healthy human skin (n = 3 donors) and in back skin of control mice (genes converted to human orthologues). VSMC, vascular smooth muscle cell. b, Expression of mTIFF markers in human skin stroma. c, Module score for the mTIFF signature in human stromal cells. d, Enrichment of the mTIFF signature in each human stromal cluster. Dotted line denotes an odds ratio of 1 (the null hypothesis). e, Integration of stromal cells sequenced from EF skin (n = 1 donor) with healthy controls. f, Frequency of major stromal cell types in healthy skin and EF skin. n = 4 donors. g, h, Images (g) and quantification (h) of GATA3+CD4+ T-cell localization in EF skin and controls. Areas of expanded fascia are outlined with dotted lines. Scale bar, 800 μm. n = 6 samples. Data are displayed as mean ± s.d. from one independent experiment (a–h). *P < 0.05, ***P < 0.001 (all two-sided); Fisher’s exact test with Benjamini–Hochberg correction (d).
The skin pathology that we observed in ΔneoTreg mice resembles human eosinophilic fasciitis (EF; also known as Shulman syndrome). EF is an orphan disease with an unknown aetiology that affects connective tissue and causes chronic, painful skin tightening and induration. Similar to ΔneoTreg skin, characteristics of EF include adipocyte loss and thickening of the fascia and interlobular septae of the subcutis (Extended Data Fig. 10e). Intriguingly, proposed causes of EF include TH2-type inflammation and loss of immune tolerance, as several cases of EF have been reported following cancer immunotherapy with checkpoint inhibitors24,25. We hypothesized that fFB1 and/or fFB2 cells might constitute the major cell type (or types) in the fascia of patients with EF. We found that fFBs were present in lesional skin from a donor patient with EF at higher frequencies than any of the previously analysed samples from healthy individuals (Fig. 4e, f). In addition, GATA3+CD4+ T cells were increased in the subcutis of EF skin compared to the dermis and epidermis, with large numbers of these cells located near hyperplastic fascial bands (Fig. 4g, h, Supplementary Table 5). These findings suggest that ΔneoTreg mice may model key features of EF and that TIFF-like human fFBs are candidate drivers of disease pathology.
Discussion
We found that inflammation early in life can cause TH2 cell accumulation in a unique niche of the skin subcutis that is underpinned by a stromal cell type that we refer to as TIFFs. TH2 cytokine exposure drives TIFF expansion to form fibrous bands, whereas priming of the TH2–TIFF niche enhances tissue repair during adulthood. Thus, early-life inflammation alters the immunological tone of skin in a durable manner by populating a latent tissue niche with adaptive immune cells absent in naive tissue.
scRNA-seq of various murine organs has uncovered fibroblast subsets that share notable transcriptional similarities with TIFFs and express varying combinations of markers such as Dpp4, Wnt2, Pi16, Anxa3 and Il13ra1 (refs.26–30). These stromal cells are found in the adventitia surrounding large neurovascular structures, organ capsules and body-cavity linings9,26–28 and appear primed to support type 2 immunity in certain tissues31. Although a variety of nomenclature has been used in different organs (for example, adventitial cells, mesenchymal stromal cells, adipose stem/progenitor cells, among others), ‘boundary fibro-blast’ may be a broadly applicable term for these cells because they are located at internal borders that maintain proper compartmentalization of internal organs and vasculature. These boundaries are disrupted by penetrating injuries and/or helminth infections. Teleologically, boundary fibroblasts would therefore be logical sentinels of inter-organ damage that could trigger type 2 immune responses directed at stromal defence and repair. Our discovery of TIFF-like fFB clusters in human skin suggests that the core biology of these cells is conserved. Further exploration of this unique immune–stromal compartment may therefore yield disease-relevant therapeutic strategies and biological insights into the immunology of connective object was subjected to single nearest neighbor (SNN)-tissues throughout the body.
Methods
Animals
All animals were bred and maintained in a specific-pathogen-free mouse facility in accordance with an animal protocol approved by the Institutional Animal Care and Use Committee of the University of California San Francisco (UCSF). Mice were socially housed under a 12-h day/night cycle at 25 °C and ambient humidity. Littermate controls were used for all experiments, and animals of both sexes were included. Mouse age for each experiment is shown in the figures. Sex, parental cage and weaning cage were randomized among experimental groups. In general, 3–5 mice were used for the first repeat of each experiment or in pilot experiments, and the resulting data were used to estimate the expected variance and effect size for repeat experiments. Using these parameters, power calculations were performed to estimate the appropriate sample size for repeat experiments that would yield 80% power to detect a 30% difference between experimental groups at a 5% significance level. Mouse studies were blinded by assigning a randomized numeric ID for the duration of experiments, which were matched to the experimental group only at the end of data analysis. Strains used in this study include Foxp3DTR (Foxp3tm3(DTR−GFP)Ayr) mice; Il5Red5 (Il5tm1.1(icre)Lky) mice; Il4/13−/− (Il4/Il13tm3Anjm) mice; Il33H2B−mCherry mice32; Tg(Pdgfra-cre)1Clc mice; Il4ratm2Fbb mice; Fgf18CreERT2 mice33; and Rosa26DTA (Gt(ROSA)26Sortm1(DTA)Lky) mice. All mice were backcrossed onto the C57BL/6J background for at least ten generations.
Human studies
Samples from healthy participants were collected from non-affected marginal skin discarded during Mohs surgery. These de-identified surgical discards were classified as Not Human Subjects Research. Two 6-mm full-thickness biopsies of lesional skin (containing subcutaneous fat) were obtained from a patient with EF in accordance with a protocol approved by the Institutional Review Board of UCSF (17–21582) with informed consent to use the samples for research and to publish de-identified sequencing data. For human histopathological data, archived, anonymized, paraffin-embedded blocks of healthy skin from patients with EF were reviewed by a board-certified dermatopathologist (T.H.M.). Specimens from healthy participants containing at least 30% subcutis by area were selected to match the age, sex and body site of samples from patients with EF.
Injection of cytokines and pharmacological agents
neoTreg cell depletion.
Foxp3DTR mice were intraperitoneally injected with two doses of 25 ng g–1 body weight DT (Sigma, D0564) dissolved in PBS at 2.5 ng μl–1 concentration (or PBS alone for controls). Injections were spaced 1 week apart, with the first injection between P8 and P10. adTreg cell depletion followed the same dosing and time course of DT administration, which started during the second telogen (7–8 weeks of age).
Cytokine injection.
Mice were subcutaneously injected each day with the following cytokines dissolved in 100 μl PBS: 500 ng recombinant mouse (rm) IL-33 (BioLegend, 580506) or 500 ng rmIL-13 (BioLegend, 575906) and 500 ng rmIL-4 (BioLegend, 715004) in complex with 2.5 μg anti-mouse IL-4 (Bio X-Cell, 11B11). Whole back skin was collected for all cytokine injections.
FTY720 injection.
FTY720 (Selleck, S5002) was diluted in saline and intraperitoneally injected at a dose of 1 μg g–1 body weight for the duration of the experiment. For controls, 2.5% dimethylsulfoxide was injected.
Additional models of TH2-type inflammation
For ovalbumin and papain immunization, mice were subcutaneously injected with 100 μg ovalbumin (Sigma, A5503) and 50 μg papain (Millipore, 5125) dissolved in 50 μl PBS. Two subcutaneous 25-μl injections were made on the right flank into suprascapular and suprapelvic skin at P8 and P15. Only skin from the injected flank was dissected for analysis. For helminth infection, 100 third-stage N. brasiliensis larvae were suspended in 50 μl PBS and injected at P8. Two subcutaneous 25-μl injections were made into the interscapular and suprapelvic back skin along the midline. TH2 cell responses were boosted at P15 with an injection of Nippo allergen (200 larvae, freeze-thawed three times34). An approximately 1-cm wide strip of midline back skin was dissected for analysis.
Full-thickness wounding
All wounding experiments were conducted during the second telogen (7–10 weeks old). Before wounding, back skin was shaved with clippers. On the day of wounding, mice were anaesthetized with 2.5% isofluorane and subcutaneously injected with 50 μl of 0.25% bupivacaine and 50 μl of 50 μg ml–1 buprenorphine for analgesia. Shaved back skin was then sterilized with a betadine swab, and six full-thickness excisional wounds were generated with a 4-mm biopsy punch. In some experiments, biopsy tissue was processed for flow cytometry to enable paired pre- and post-wounding analyses. At the time of euthanasia, wounds and adjacent tissue were excised with an 8-mm biopsy punch. Wounds were photographed with an in-frame ruler at the indicated time points. Wound diameter was quantified using QuPath v.0.2.3 image analysis software35, and wound data were fitted to a one-phase exponential decay model in Prism 8 for comparison of the rate constant k between groups (GraphPad).
Tissue processing
Mouse tissue.
After euthanasia, back skin was shaved and dissected. Any remaining scapular or inguinal fat was removed, and the remaining tissue was weighed, finely minced with scissors, placed in a 50-ml conical containing 3 ml of digestion medium (2 mg ml–1 collagenase XI, 0.5 mg ml–1 hyaluronidase, 0.1 mg ml–1 DNase in RPMI with 10% calf serum, 1% HEPES buffer, 1% non-essential amino acids, 1% Glutamax and 1% penicillin–streptomycin) and digested in a bacterial shaker for 45 min at 37 °C and 225 r.p.m. Digestion was then quenched with 10 ml cold RPMI and samples were vortexed for 10 s and successively strained through 100-μm and 40-μm strainers. The resulting single-cell suspension was then placed into 96-well plates for staining. In indicated experiments, skin was dissected into an epidermal/dermal fraction and a subdermal fraction by tautly pinning the skin and roughly scraping off the subcutis with forceps until no dermal adipose tissue remained. For lymph node samples, axillary, brachial and inguinal lymph nodes were dissected and mashed through a 100-μm filter with a 5-ml syringe plunger into cold medium.
Human tissue.
Punch biopsies and surgical excisions were finely minced with scissors and incubated in a digestion cocktail containing collagenase IV (0.8 mg ml–1, Worthington, LS004186) and DNAse (20 μg ml–1, MilliporeSigma, DN251G) diluted in RPMI with 10% fetal bovine serum (FBS), 1% HEPES, 1% non-essential amino acids, 1% Glutamax and 1% penicillin–streptomycin. The next morning, digests were briefly shaken and passed through a 100-μm strainer to yield a single-cell suspension. Red blood cells were lysed with BD PharmLyse (BD 555859) for 5 min at room temperature as per the manufacturer’s instructions before proceeding to antibody staining for FACS.
Flow cytometry
Single-cell suspensions were pelleted and resuspended in PBS with 2% FBS containing fluorophore-conjugated antibodies. Cells were initially stained with antibodies targeting cell surface proteins and with Ghost 510 viability dye (Tonbo Biosciences, 13–0870) for 30 min on ice and washed with PBS containing 2% FBS. For biotinylated antibodies, a subsequent 15-min incubation with fluorophore-conjugated streptavidin was used. For intracellular target staining, cells were then fixed and permeabilized using a Cytofix/Cytoperm kit (BD Biosciences, 554714). For experiments involving intracellular cytokine staining, single-cell suspensions were plated at 4 × 10⁶ cells per well in a 96-well round bottom plate, resuspended in 1× cell stimulation cocktail (Tonbo Biosciences, TNB-4975) and incubated at 37 °C for 4 h before antibody staining. Samples were run on a BD Fortessa or sorted on a BD FACS Aria2.
The following antibodies were used for mouse flow cytometry: CD16/32, also known as Fc Block (Bio X Cell BE0307, clone 2.4G2; 1:100); CD26-PerCP-Cy5.5 (eBioscience 45-0261-82, clone H194-112; 1:100); CD9-FITC (eBioscience 11-0091-82, clone KMC8; 1:100); CD9-Alexa 647 (BioLegend 124809, clone MZ3; 1:100); PDPN-PE-Cy7 (eBioscience 25-5381-82, clone 8.1.1; 1:200); EpCAM-APC-eFluor780 (eBioscience 47579182, clone G8.8; 1:200); CD45-Alexa 700 (eBioscience 56045182, clone 30-F11; 1:200); CD34-Alexa 647 (BD 560230, clone RAM34; 1:100); CD140a-BV650 (BD 740531, clone APA5; 1:100); SCA1-BV605 (BioLegend 108133, clone D7; 1:100); CD31-BV421 (BD 563356, clone 390; 1:400); IL-4RA-biotin (BD, 552508; 1;100); CD90.2-PerCP-Cy5.5 (BioLegend 140322, clone 30-H12; 1:500); CD49d-PE-Cy7 (BioLegend 103618, clone R1–2; 1:200); CD3e-APC-eFluor780 (eBioscience 47003182, clone 145–2C11; 1:100); CD3e-BV711 (BD 563123, clone 145–2C11; 1:100); IL-18R1-APC (eBioscience 17-5183-82, clone P3TUNYA; 1:200); CD8a-BV785 (BioLegend 10050, clone 53–6.7; 1:200); CD4-BV650 (BD 563747, clone RM4–5; 1:200); CD69-BV605 (BioLegend 104530, clone H1.2F3; 1:100); Ghost Fixable Vital Dye 510- (Tonbo, 130870); ST2-biotin (MD Bioscience 101001B, clone DJ8); streptavidin-eFluor 450 (eBioscience 48431782); streptavidin-PE (BD, 554061); TCRgd-PerCP-Cy5.5 (BioLegend 118118, clone GL3; 1:200); Ly6G-PE-Cy7 (BioLegend 127618, clone 1A8; 1:200); Siglec F-PE (BD552126, clone E50–2440; 1:200); CD11b-APC-eFluor780 (eBioscience 47011282, clone M1/70; 1:200); CD64-BV785 (BD 741024, clone X54–5/7.1; 1:100); CD11c-BV650 (BioLegend 117339, clone N418; 1;100); Ly6C-BV605 (BD 563011, clone HK1.4; 1:100); MHC-II-eFluor 450 (eBioscience 48532182, clone M5/114.15.2; 1:400); Arg1-APC (eBioscience A1exF5, 17-3697-82; 1:100); CD103-PE-CF594 (BD 565849, clone M290; 1:200); TCRb-PerCP-Cy5.5 (Tonbo 655961-U100, clone H57–597; 1:200); IL-17A-PE-Cy7 (eBioscience 506922, clone eBio17B7; 1:100); IL-13-PE (eBioscience 12-7133-82, clone eBio13A; 1:100); IL-5-APC (BioLegend 504306, clone TRFK5; 1:100); IFN-γ-BV650 (BioLegend 505831, clone XMG1.2; 1:100); FoxP3-eFluor 450 (eBioscience 48577382, clone FJK-16s; 1:100); and Ki67-AF488 (Invitrogen 14-5698-82, clone SolA15; 1:100). For flow cytometry of human samples, the following antibodies were used: CD324-PerCP-Cy5.5 (BD 563573, clone 67A4; 1:100); CD31-APC-eFluor 780 (eBioscience 47-0319-42, clone WM59; 1:100); CD45-BV650 (BioLegend 304044, clone HI30; 1:100); CD235a-Pacific Blue (BioLegend 349108, clone HI264; 1:100); Ghost Fixable Vital Dye 510- (Tonbo, 130870); and CD90-PE (BD 555596, clone 5E10; 1:500).
For all cell types, initial forward scatter versus side-scatter gates were carefully adjusted by backgating on live CD45+ and/or live PDPN+ populations to include all cells and exclude debris. Stringent exclusion of dead cells and doublets was performed before gating for immune cells (CD45+) and/or stromal cells (CD45−CD31−TER119−EpCAM−, collectively Lin−). For the full gating strategy, see Supplementary Fig. 1. T cells were gated as CD45+CD3mid (excluding CD3high dendritic epidermal T cells) and subsetted into CD4 Teff cells (CD4+FOXP3−), Treg cells (CD4+FOXP3+), CD8 T cells (CD8+) and dermal γδ T cells (CD4−CD8−TCRγδ+). The GFP–DTR fusion protein in Foxp3DTR mice was used to report FOXP3 expression. In mice bearing the Il5Red5 allele, TH2 cells were identified as CD4+FOXP3−tdTomato+, and CD4+FOXP3−tdTomato− cells are referred to as bulk Teff cells. ILC2 cells were gated in these mice as CD45+CD3−CD4−CD8−THY1+tdTomato+, as previously described5. Eosinophils were identified as CD45+Ly6G−CD11b+ Siglec F+ and neutrophils were identified as CD45+Ly6G+MHCII−. Macrophages (CD64+CD11b+CD11c−), monocytes (Ly6C+ within the macrophage gate), alternatively activated macrophages (ARG1+ within the macrophage gate) and dendritic cells (CD64−MHCII+CD11c+) were gated after excluding T cells, B cells, eosinophils and neutrophils. Within the bulk fibroblast gate, TIFFs were gated as CD26+CD9low−mid. Cell numbers were calculated using CountBright counting beads (ThermoFisher, C36950) or by quantifying cell numbers on a NucleoCounter (ChemoMetec) before staining. All flow cytometry analyses were performed using FlowJo v.10.7 or FlowJo v.9.9.6 (BD).
Thin-section immunofluorescence microscopy
Shaved back skin was placed fat-side down on a paper towel, cut into 3-mm-wide sagittal strips and fixed in 4% paraformaldehyde on a rocker for either 1 h at room temperature or 4 °C overnight. After three washes in PBS, skin strips were rolled into a spiral with forceps, embedded in optical cutting temperature compound and flash-frozen in absolute ethanol cooled with dry ice. Sections (12 μm) were cut on a cryostat (ThermoFisher Cryostar NX50) on SuperFrost Plus slides and stored at −20 °C until staining. For antibody staining, frozen sections were air-dried for 1 h, washed in PBS, blocked for 30 min in PBS with 10% FBS, 5% donkey serum and 0.3% Triton X-100, then stained with the following antibodies diluted in blocking buffer overnight at 4 °C: dsRed (Takara, rabbit polyclonal 632496; 1:200); perilipin-1 (Cell Signaling, 349108, rabbit clone D1D8; 1:500); CD3e (BioLegend, 100202, rat clone 17A2; 1:100); CD26 (R&D, goat polyclonal, AF954; 1:100); myosin IV-AF488 (Invitrogen, 53650382, mouse clone MF20; 1:100); ER-TR7-AF647 (Santa Cruz, 73355-AF647; 1:200); keratin-14 (BioLegend, 906001, chicken polyclonal; 1:400); GATA3 (Cell Marque, 390M-17, mouse clone L50–823, predilute); and CD4 (Dako, 104R-17, rabbit clone SP35, predilute).
After washing in PBS, sections were stained for 2 h at room temperature in the following secondary antibodies diluted 1:500 in blocking buffer: donkey anti-rabbit Alexa 555 (Invitrogen, A31572); donkey anti-goat Alexa 647 (Invitrogen, A21447); donkey anti-rat Alexa 647 (Jackson ImmunoResearch, 712605153); donkey anti-rabbit Alexa 488 (Invitrogen, A21206); and/or donkey anti-rat Alexa 488 (Invitrogen, A21208). Sections were washed three more times in PBS and mounted in ProLong Gold antifade reagent (ThermoFisher, P10144) and imaged on a Zeiss M2 Imager with an Apotome attachment.
Thick-section confocal microscopy
Back skin was dissected and frozen as described above, and 100–200-μm sections were cut on a cryostat and transferred using forceps into PBS. Sections were then stained in a 48-well plate using the antibodies listed above, but with double the incubation and wash times, and transferred between wells with forceps, taking care not to disrupt the fascia. Sections were mounted on slides in refractive-index-matching solution36 using a dissection microscope to preserve orientation. Imaging was conducted on a Leica SP8 scanning confocal microscope with a white light laser and ×20/0.8NA multi-immersion objective, a Zeiss M2 imager with Apotome attachment and ×20/0.8NA air objective, or a Nikon A1r scanning confocal microscope with 405-nm, 488-nm, 561-nm and 633nm lines and a ×20/1.0NA water objective at approximately 0.4 × 0.4 × 0.8 μm resolution.
Image analysis
For quantification of TH2 and ILC2 cell localization in skin, Imaris 9.3 (BitPlane) was used to analyse confocal imaging data from Il5Red−5/+;Rosa26tdTomato;Foxp3DTR mice, in which the IL-5 reporter signal is boosted by additional Cre-mediated recombination and tdTomato expression from the Rosa26 locus. TH2 and ILC2 cells were identified using the Surface tool in Imaris to segment tdTomato+ cells, and then these two cell types were distinguished by thresholding on CD3 intensity within each cell object. The skin epidermis, dermis, dermal adipose tissue, PC and fascia were then segmented by manually drawing surface contours on each z-plane, and cell localization was determined by creating a distance mask to each layer.
Quantification of GATA3+CD4+ T cells in human immunohistochemistry sections was performed using Qupath (v.0.2.3)35. Small representative regions of interest of haematoxylin, 3,3’-diaminobenzidine (GATA3), alkaline phosphatase (CD4) and background were used to set stain vectors. Cells were detected using the watershed algorithm-based Detect Cells tool, using the optical density sum to segment nuclei with a cytoplasmic expansion of 1.5 μm. Cells were then classified with the Train Object Classifier tool using a neural network trained on 15–30 annotations of each cell class (GATA3+CD4+, GATA3+CD4–, and CD4–) with the following features as input: nuclear GATA3 mean/s.d., nuclear haematoxylin mean/s.d., nuclear CD4 mean/s.d., cytoplasmic GATA3 mean/s.d., and cytoplasmic CD4 maximum. Dermis and subcutis were manually annotated for cell localization, and tissue area was detected with a simple thresholder.
RNA preparation and quantitative PCR
Sorted, pelleted fibroblast populations (104–105 cells) were snap frozen, and RNA extraction was conducted using a PureLink RNA Mini kit (ThermoFisher, 12183020). cDNA synthesis was performed using an iScript Advanced cDNA kit (Bio-Rad, 1725038) and pre-amplification with a SsoAdvanced Preamp kit (Bio-Rad, 1725160). Quantitative PCR was carried out with PrimeTime Gene Expression master mix (IDT, 1055772) on a StepOnePlus real-time PCR system (Applied Biosystems) under fast cycling conditions using the following Taqman primers: Anxa3-FAM (Mm00442685), Il13ra1-FAM (Mm01302068), Wnt2-FAM (Mm00470018) and Gapdh-VIC (Mm03302249).
Fibroblast and TH2 cell co-cultures
For fibroblast isolation, back skin was dissected from mice in the first telogen (P19–P25) and separated into dermal and subdermal fractions as described above. Each fraction was separately sorted on a BD FACS Aria 2, with dermal fibroblasts sorted from the dermal fraction (Lin−CD34+SCA1+CD26+/−CD9+) and TIFFs sorted from the subdermal fraction (Lin−CD34+SCA1+CD26+CD9−). Fibroblasts were plated separately in a 96-well flat-bottom plate (10,000 per well) in DMEM with 10% FBS, 1% Glutamax and 1% penicillin–streptomycin and grown to confluence over 6 days. For TH2 cell purification, neonatal Il5Red5/+;Foxp3DTR mice were depleted of Treg cells as described above and treated with three subcutaneous injections of 500 ng IL-33 at approximately P21–25 to boost TH2 cell numbers. Whole skin was dissected at P27–P28, and CD3+CD4+FOXP3−IL-5tdTomato+ skin TH2 cells were purified by FACS. Sorted TH2 cells were labelled with 2.5 μM CellTrace Violet (ThermoFisher, C34557) as per the manufacturer’s instructions and then cultured with confluent fibroblasts for 4 days before collection. In some conditions, TH2 cells were cultured in medium alone or in medium supplemented with IL-2 (BioLegend, 589104, 200 U ml–1), IL-7 (20 ng ml–1, 577802) and IL-33 (20 ng ml–1, 580502).
Mouse scRNA-seq
Stromal cells (CD45−CD31−TER119−EpCAM−) from digested back skin of control or ΔneoTreg mice at P22 were run on a BD FACSAriaII using a 100-μm nozzle and sorted into RPMI medium supplemented with 10% FBS. Two male mice were pooled per group, and samples were run on separate lanes of a 10X Chromium chip with 3′ v.2 chemistry (10X Genomics) as per the manufacturer’s instructions by the UCSF Institute for Human Genetics Sequencing Core. Libraries were sequenced on an Illumina Novaseq 6000. Fastq files were aligned to the mm10 reference genome, and barcode matrices were generated using Cellranger 2.1.
Downstream data analysis, including clustering, visualizations and exploratory analyses, were performed using Seurat 3.2.0. Cells with <200 features, >25,000 reads or >6% mitochondrial genes were filtered out during preprocessing. The Seurat SCTransform function was applied to each dataset, and the data were integrated using the canonical correlate-analysis-based IntegrateData function with the top 3,000 most variable features selected as SCT integration anchors. Principal component analysis (PCA) and uniform manifold approximation and projection (UMAP) were run on the integrated object, and an initial low-resolution clustering was generated using the first 20 principal components. On the basis of this preliminary clustering, the following populations of contaminating cell types were removed based on the expression of the indicated markers: keratinocytes (Krt5, Krt14 and Cdh1), immune cells (Ptprc), endothelial cells (Pecam1 and Cdh5), melanocytes (Mlana and Tyr), skeletal muscle cells (Acta1 and Des) and red blood cells (Alas2). The subsequent filtered dataset containing fibroblast and mural cell types was split, and the SCTransform-based integration pipeline was re-run with new variable features selected as anchors. The final integrated object was clustered using the first 20 principal components and a resolution of 0.4. Markers for each cluster were identified with the Seurat FindAllMarkers functions using a Wilcoxon rank-sum test and corrected for multiple testing with the Bonferroni method. Markers of TIFFs with an average log2(fold-change) > 0.25 were used to construct the TIFF signature used in the cross-tissue met-analysis described below (n = 313).
For the comparison between TIFFs and stromal cell types in other tissues, cross-tissue steady-state mouse fibroblast atlas data analysed in Buechler et al.9 were downloaded from https://www.fibroXplorer.com as a Seurat object in RDS format (v.0.3.0). The TIFF module score of each cross-tissue fibroblast cluster was calculated using the Seurat AddModuleScore function. Gene set enrichment of the TIFF signature within each fibroblast cluster from Korotkevich et al.37 was calculated using the gene set enrichment analysis algorithm implemented in the fgsea R package with parameters scoreType = “pos”, eps=1e-100, and nproc=1.
Human scRNA-seq
Single-cell suspensions obtained from digests of full-thickness human skin biopsies were run on a BD FACSAriaII using a 100-μm nozzle. Stromal cells (CD45−CD31−E-cadherin−CD235a−) were sorted into RPMI medium supplemented with 10% FBS using THY1 as a positive-control gate to fine-tune the separation of Lin− cells from debris through back-gating. Samples were submitted to the UCSF Institute for Human Genetics Sequencing Core, where they were loaded onto a 10X Chromium chip with 3′ v.3 chemistry (10X Genomics) as per the manufacturer’s instructions and sequenced on an Illumina NovaSeq 6000. Fastq files were aligned to GRCh38 with Cell Ranger v.3.0.2.
Downstream data analysis, including clustering, visualizations and exploratory analyses, were performed using Seurat v3.2.0. Cells with <200 features, >30,000 reads or >6% mitochondrial genes were filtered out during preprocessing. The Seurat SCTransform function was applied to each dataset, and the data were integrated using the canonical correlate-analysis-based IntegrateData function with the top 3,000 most variable features selected as SCT integration anchors. PCA and UMAP were run on the integrated object, and an initial low-resolution cluster was generated using the first 50 principal components. On the basis of this preliminary clustering, the following populations of contaminating cell types were removed based on the expression of the indicated markers: keratinocytes (KRT5, KRT14, DSG1 and DSG3), immune cells (PTPRC) and endothelial cells (PECAM1 and CDH5). One cluster of cells of uncertain identity expressing very low levels of PECAM1 and CDH5 was left in the final analysis shown in Fig. 4 and labelled as ‘endothelial’. The subsequent filtered dataset containing fibroblast and mural cell types was split, and the SCTransform-based integration pipeline was re-run with new variable features selected as anchors. The final integrated object was subjected to single nearest neighbor (SNN)-based clustering using the first 50 principal components and a resolution of 0.5. Markers for each cluster were identified with the Seurat FindAllMarkers function using a Wilcoxon rank-sum test and corrected for multiple testing with the Bonferroni method. Data from the sample from the patient with EF were analysed in a similar fashion through SCTransform-based integration with healthy samples and SNN-based clustering with 15 principal components and a resolution of 0.35. Original cell-type annotations from the healthy-only analysis were retained in metadata and projected onto the UMAP plot of EF-integrated data to ensure that clusters were being annotated in a similar fashion to the healthy-only analysis (similar to the cross-species transcriptomics analysis, see Extended Data Fig. 10d and below).
Cross-species transcriptomics analysis
To directly compare mouse and human scRNA-seq data, the control mouse skin samples was re-clustered and analysed from its counts matrix as described above, and genes within the resulting Seurat object were renamed with their most probable human orthologues. Possible human orthologues for murine genes were retrieved from the Ensembl GRCh38 assembly using the getLDS function (v.2.46) of the BiomaRt package. Additional parameters retrieved for each possible orthologue included the orthology confidence score, the whole genome alignment score, the gene order conservation score and the percentage identity. Orthologues lacking a HGNC symbol were removed from the humanized gene list. For mouse genes with multiple human orthologues, a single orthologue was assigned using the following tiebreaking procedure: confidence = 1, highest whole genome alignment score, highest gene order conservation score, percentage base pair identity. A final list of one-to-one mouse-to-human orthologue pairings was used to rename genes within the mouse Seurat object counts matrix.
An initial list of 313 mTIFF signature genes was generated from the output of the Seurat FindAllMarkers function listed above, thresholded by average log(fold-change) > 0.25 and converted to human orthologues as described above. This TIFF signature was then filtered to remove genes that were not variably expressed in human data, which resulted in a final set of 144 genes. Fisher’s exact test was run on each human stromal cluster using the base R function fisher.test, and P values were adjusted for multiple comparisons using the base R function p.adjust to apply the Benjamini–Hochberg procedure. The mTIFF module score was calculated by running the Seurat AddModuleScore function on the 144-gene mTIFF signature. To generate the cross-species stromal atlas, original cluster identities of mouse and human cells were separately stored in the metadata of each Seurat object. Integrated human data were then split by sample. SCTransform-based mouse and human data were integrated with a newly calculated variable features space. Clustering was performed on the first 50 principal components with a resolution 0.4. Visualization of the original mouse and human cluster identities projected onto the cross-species UMAP was performed using the Seurat DimPlot function with the cells in each single-species cluster designated in the cells.highlight parameter.
Quantification and statistical analyses
Statistical analyses were performed using Prism 8 (GraphPad) unless otherwise specified. Detailed testing methods are included in the figure legends. All statistical hypothesis testing was performed with two-tailed tests, and significance is displayed across figures using the following legend: *P < 0.05, **P < 0.005, ***P < 0.0005. With the exception of scRNA-seq, all experiments were repeated two to three times, and all data points represent individual biological replicates.
Reporting summary
Further information on research design is available in the Nature Research Reporting Summary linked to this paper.
Extended Data
Extended Data Fig. 1 |. Characteristics of cutaneous inflammation induced by neonatal Treg reduction.

(a) Weights of PBS- and DT-treated FoxP3DTR mice from the time of treatment to adulthood. n = 3–7 mice per data point, 51 total. (b) Quantification of Tregs in skin and skin-draining lymph nodes (sdLN) following neoTreg depletion. n = 3–9 animals per data point (60 total), 1 experiment per time point. (c–f) Representative flow cytometry and quantifications of immune cell populations in skin and skin-draining lymph nodes during the inflammatory phase of neonatal Treg depletion at P25 and adult Treg depletion at P67 (both 10 days after DT). Gating: CD8 T cells (CD3+ CD8+); CD4 Teffs (CD3+ CD4+ FoxP3−); Ly6C monocytes (Ly6G− Siglec F− CD64+ CD11c− CD11b+ Ly6C+). n = 18 animals. (g) Representative histology of wildtype neonatal mice treated with PBS or DT and sacrificed 10 days post-injection. (h) Histology of selected organs in ΔneoTreg and control mice at P25. gWAT – perigonadal white adipose tissue. Data are displayed as mean +/− SD from one independent experiment, representative of 2–3 repeats. *p < 0.05, **p < 0.01, ***p < 0.001 (all two-sided); repeated measures two-way ANOVA (a); two-way ANOVA with Šídák multiple comparison test (b-c); one-way ANOVA with Tukey’s multiple comparisons test (c–f).
Extended Data Fig. 2 |. Resolution of inflammation and return to homeostasis following neonatal Treg reduction.

(a) Representative skin histology of control and neonatal Treg-depleted FoxP3DTR mice at P25, P35, and P50 (10, 20, and 35 days post-DT treatment). Fibrous bands are outlined with dotted lines and regenerating adipocytes are marked by arrows. (b) Abundance of selected inflammatory immune cell populations in skin 0–90 days after neoTreg depletion. n = 3–9 animals per data point (60 total), 1 experiment per time point. (c) T helper and CD8+ T cell cytokine production 0–35 days after neoTreg depletion, quantified by intracellular cytokine staining. n = 3–9 animals per data point (51 total), 1 experiment per time point. (d–f) Sample gating and quantification of dermal γδ T cells, ILC2s, and Tc2 cells 0–90 days after neoTreg depletion in Il5Red5/+; FoxP3DTR mice. n = 3–9 animals per data point (51 total, d-e); 3–6 animals per data point, (19 total, f), 1 experiment per time point. Data are displayed as mean +/− SD from one independent experiment, representative of 2–3 repeats. *p < 0.05, **p < 0.01, ***p < 0.001 (all two-sided); Student’s t test at selected time points during adulthood (b-e); two-way ANOVA with Šídák multiple comparison test (f). All results were reproduced over 2–3 independent experiments.
Extended Data Fig. 3 |. CD49d marks subcutis-resident Th2 cells that are associated with subdermal eosinophilia and age-specific fibrous band formation.

(a-c) Expression of CD69, CD103 (αE integrin), and CD49d (α4 integrin) on skin lymphocytes in ΔneoTreg mice aged to adulthood. Bulk Teff defined as IL5Red5− FoxP3− CD4+ T cells. n = 4 animals. (d–f) ΔneoTreg mice were aged to adulthood, subcutis was separated from the dermis/epidermis, and the two skin fractions were analyzed separately by flow cytometry. Th2 localization over time (d), lymphocyte localization at P50 (e), and CD49d expression in dermal vs. subdermal lymphocytes (f) is shown. n = 4–5 animals per data point, 14 total (d); 4 animals (e); 5 animals (f). (g–i) Quantification of CD49d+ Th2 cells (g) and eosinophils (h) in ΔneoTreg and ΔadTreg mice during the inflammatory phase of Treg reduction at 10 days post-DT. Myeloid cell localization in ΔneoTreg mice (i) was quantified by flow cytometry of dissected skin layers. n = 19 animals (g-h); 5 animals (i). (j–l) ΔneoTreg mice were treated every other day with FTY720 or vehicle from P8 to P25. Histology (j), Th2 numbers (k), and eosinophil numbers (l) are shown at P25. n = 7 animals. (m–n) CD49d expression on IL5-Red5+ Th2 cells and frequency of CD49d+ Th2 cells in ΔneoTreg and ΔadTreg mice during (D10 / P25) and after (D35 / P50) inflammation. n = = 23 animals. Data are displayed as mean +/− SD from one independent experiment, representative of 2–3 repeats. *p < 0.05, **p < 0.01, ***p < 0.001 (all two-sided); repeated-measures ANOVA with Dunnett’s multiple comparison test (a-c, e); 2-way repeated-measures ANOVA with Sidak multiple comparison test (f); Welch’s ANOVA with Dunnett’s multiple comparison test (g-h); Student’s t-test (k-n). All results were reproduced over 2–3 independent experiments.
Extended Data Fig. 4 |. Single-cell transcriptomic characterization of skin stroma in control and ΔneoTreg mice.

(a) Expression of marker genes for skin stromal clusters in control mice. (b) Expression of fibroblast markers and ECM genes in control mouse skin stroma. (c) Expression of immune-related genes in mouse skin stroma, split by control (PBS) and ΔneoTreg (DT) sample. (d) Differential gene expression analysis of Il13ra1+ FBs (TIFFs) in ΔneoTreg vs. control mice. (e) Expression of MHC class II-related transcripts in skin stromal clusters (ctrl and ΔneoTreg samples combined). (f) Expression of cell surface markers used to design the Il13ra1+ FB flow cytometry gating strategy in main figure 2d. (g) Representative flow cytometry of fibroblast markers PDPN and PDGFRα within subsets of Lin− skin stromal cells from P25 control mice.
Extended Data Fig. 5 |. Il13ra1+ FBs / TIFFs are transcriptomically similar to Pi16+ fibroblasts found across mouse organs.

Published data were downloaded from a mouse cross-tissue fibroblast atlas, containing twenty-eight 10X scRNAseq datasets across 16 murine tissues that were aligned, filtered, and analyzed with a standardized methodology to minimize batch effects.9. (a) Steady-state atlas of all 16 tissues was re-plotted, demonstrating similar clustering to published meta-analysis. (b) Expression of TIFF markers from control skin in cross-tissue clusters defined by the atlas. (c) Expression of the top 50 TIFF markers (ranked by log-fold change) in cross-tissue atlas clusters. (d) Cross-tissue atlas cluster representation in selected tissues. SAT – subcutaneous adipose tissue; VAT – visceral adipose tissue. (e) Enrichment of all skin TIFF markers with logFC > 0.25 (n = 313) among cross-tissue fibroblast atlas clusters, calculated using the Seurat AddModuleScore function. (f) Geneset enrichment analysis of the skin TIFF gene set among cross-tissue fibroblast atlas clusters.
Extended Data Fig. 6 |. Anatomic characterization of Il13ra1+ fibroblasts (TIFFs).

(a) IF microscopy of mouse back, ear, and tail skin to identify fascia (CD26), adipocytes (PLIN1), and skeletal muscle (MyoIV). (b) Variable layering of fascia, adipocytes, and skeletal muscle at two different back skin locations at in P22 control mice. (c) Control skin was dissected from P22 mice and the subcutis was manually separated from the dermis and epidermis. Il13ra1+ FBs (TIFFs) were quantified in each fraction. (d) Fgf18 expression by scRNAseq in control Lin− skin stromal cells. (e) Confocal microscopy of adult skin from Fgf18CreRET2; Rosa26tdTomato mice injected with tamoxifen for five days prior to harvest. Top row: Z-projection with tdTomato signal thresholded for visualization. Bottom row: inset of fascia with original tdTomato fluorescence. All results were reproduced over 2–3 independent experiments.
Extended Data Fig. 7 |. Further characterization of Th2-TIFF interactions in the subdermal niche.

(a) IF microscopy of skin from wildtype mice injected for five days with IL-13 or IL-33 starting at P21 with quantification of fascial proliferation by Ki67. n = 9 animals. (b) Skin histology from ΔneoTreg mice crossed to IL4/13- or IL33-deficient strains at P25 (10 days post-DT). (c) Expression of IL4RA on TIFFs from wildtype neonate (P25) and adult (P50) mice. n = 10 animals. (d–f) Adult mice were injected for 7 days with type 2 cytokines and the indicated cell populations in skin were quantified by flow cytometry. n = 13 animals (d); 7 animals (e-f). (g–h) TIFFs and dermal fibroblasts were sorted from P21 mouse skin and co-cultured with sorted IL-5Red5+ skin Th2 cells from ΔneoTreg mice for four days. n = 12 samples (h). (i–j) IL-18R1 and ST2 expression in skin lymphocyte subsets with quantification of IL-18R1 expression (see main fig. 3g for ST2). n = 4 animals. (k–l) ΔneoTreg mice were aged to adulthood, the subcutis was separated from the dermis/epidermis, and expression of alarmin receptors was quantified across lymphocyte subsets. n = 5 animals. Data are displayed as mean +/− SD from one independent experiment, representative of 2–3 repeats. *p < 0.05, **p < 0.01, ***p < 0.001 (all two-sided); Welch’s ANOVA with Dunnett Multiple Comparisons Test (a, d, h, j); Student’s t-test (c, e-f); two-way ANOVA with Šídák multiple comparison test (l).
Extended Data Fig. 8 |. Th2-TIFF interactions and niche priming across multiple models of early life subcutaneous inflammation.

(a-d) Mice were immunized subcutaneously (s.c.) with ovalbumin (OVA) and papain. CD49d+ Th2 cells (b, c) and TIFFs (d) were quantified at indicated timepoints. n = 25 animals I; 10 animals (d). (e–f) PdgfraCre; Il4raf/f mice and Cre− controls were injected with OVA-papain at P8 and P15. IL4RA expression (e) and TIFF frequency (f) were quantified at P25. n = 13 mice. (g–j) Mice were infected s.c. with Nippostrongylus brasiliensis at P8 and boosted with s.c. N. brasiliensis allergen at P15. CD49d+ Th2 cells (g, i) and TIFFs (j) were quantified at indicated timepoints. n = 13 mice (h); 12 mice (j). Data are displayed as mean +/− SD from one independent experiment; each experiment was reproduced 2–3 times. *p < 0.05, **p < 0.01, ***p < 0.001 (all two-sided); Student’s t-test (c-d, f, i-j); two-way ANOVA with Šídák multiple comparison test (e).
Extended Data Fig. 9 |. Neonatal Treg reduction primes skin for Th2-driven tissue reparative responses during adulthood.

(a–b) Control and ΔneoTreg mice were aged to adulthood and then treated with two shots DT (identical to neonatal dosing regimen). Representative histology is shown with fibrous bands outlined. (c) Th2 and ILC2 cell numbers in adult ctrl (Il5Red5/+; FoxP3DTR + PBS), ΔneoTreg (Il5Red5/+; FoxP3DTR + DT), and ΔneoTreg/ΔTh2 (Il5Red5/+; Rosa26DTA/+; FoxP3DTR) mice. n = 16 animals. (d) Wound bed ILC2 numbers (gated as CD45+ CD3− CD4− CD8− Thy1+ IL5Red5+). n = 7–10 animals per data point in 2 pooled experiments per time point (108 total). (e–n) Control, ΔneoTreg, and ΔneoTreg/ΔTh2 mice were aged to adulthood and subjected to full-thickness cutaneous wounding. (f) Th2 numbers in skin 0 − 10 days post wounding (dpw). n = 4–11 animals per data point in 2 pooled experiments per time point (89 total). (g) Th2 frequency in paired skin biopsies taken at dpw0 and dpw7. n = 22 animals in one experiment. (h–i) Wound area was quantified daily, fit to a one-phase exponential decay model, and tested for equivalence of the rate constant (h). Rate constants of curves fit to each biological replicate are shown in (i). (j–k) Alternatively activated macrophage (AAM) and eosinophil frequency in dpw10 wounded skin. n = 42 animals in 2 pooled experiments. (l) TIFF abundance in wound beds at 0 −10 dpw. n = 4–16 animals in 2 pooled experiments (97 total). (m–n) Flow cytometric quantification (m) and IF microscopy (n) of CD26hi TIFFs in wounds at dpw10. n = 39 animals in 2 pooled experiments. (o–u) ΔneoTreg mice were aged to adulthood, wounded, and treated with FTY720 every other day. Wound closure (p-q) and flow cytometric quantifications of Th2 cells, alternatively activated macrophages (AAMs), eosinophils, and TIFFs are shown (r-u) are shown. n = 11 animals. (v-ab) Neonatal mice were immunized with OVA/papain, aged to adulthood, and wounded. Wound closure (w-x) and flow cytometric quantifications of Th2 cells, alternatively activated macrophages (AAMs), eosinophils, and TIFFs are shown (y-ab). n = 22 animals. Data are displayed as mean +/− SD (c-d, f, i-m, q-u, x-ab) or SEM (h, p, w). Results were reproduced over 2 independent experiments (a-d; o-ab) or 4 independent experiments pooled into two separate analyses (e-n). *p < 0.05, **p < 0.01, ***p < 0.001 (all two-sided); ANOVA with Dunnett Multiple Comparisons Test (c, i-k, m, x-ab); least-squares quadratic regression with extra sum-of-squares F test (f, l); mixed-effects analysis with Šídák multiple comparison test (g); nonlinear one-phase exponential decay regression (h, p, w); Student’s t-test (q-u).
Extended Data Fig. 10 |. Characterization of human skin stroma.

(a) Gating strategy used to FACS-purify human Lin− stromal cells (CD45− CD31− Ecad−, CD235a−). (b) Expression of top 50 murine TIFF (mTIFF) orthologs in human skin stroma, ranked by fold-change. (c) Expression of mouse TIFFs and Thbs4+ FB markers in healthy human stromal clusters. (d) Human and ortholog-converted mouse scRNAseq data were integrated and co-clustered. Cluster identities from single-species analyses (main fig. 4a–b) are shown projected onto the cross-species UMAP. (e) Sample histology of healthy and eosinophilic fasciitis lesional skin with IHC staining for GATA3 and CD4.
Supplementary Material
Acknowledgements
We thank the staff at the UCSF Parnassus Flow Cytometry Core (RRID:SCR_018206) for assistance with flow cytometry analysis and cell sorting (supported in part by NIH P30 DK063720 and by the NIH S10 instrumentation grant 1S10OD021822-01); the UCSF Biological Imaging and Development Core for confocal microscopy and analysis; the UCSF Genomics CoLab and Institute for Human Genetics for scRNA-seq and the UCSF Mouse Pathology Core for histology; and T. Scharschmidt, C. Lowell, J. Cyster, M. Ansel, T. Peng and A. Abbas for comments and discussion; D. Ornitz and A. Hagan for the donation of Fgf18CreERT2 tissue; and R. Locksley and H.-E. Liang for N. brasiliensis larvae. Figs. 1a, b and Extended Data Figs. 8a, g, 9a, e, o and v were created using BioRender.com. I.C.B. was supported by NIH F30AI147364, NIH T32GM007618 and NIH T32AI007334. M.D.R. is supported by NIH R01AR077553 and R01AR071944.
Footnotes
Online content
Any methods, additional references, Nature Research reporting summaries, source data, extended data, supplementary information, acknowledgements, peer review information; details of author contributions and competing interests; and statements of data and code availability are available at https://doi.org/10.1038/s41586-021-04044-7.
Code availability
Code used for analysis of scRNA-seq data is available upon request from the corresponding author.
Competing interests
Funding for scRNA-seq studies of healthy human skin was provided by LEO Pharmaceuticals. M.D.R. is a founder and consultant for TRex Bio., Sitryx Bio. and Mozart Therapeutics.
Additional information Supplementary information The online version contains supplementary material available at https://doi.org/10.1038/s41586-021-04044-7.
Data availability
Sequencing data are publicly available at the Gene Expression Omnibus under accession number GSE183031. Cross-tissue fibroblast atlas data9 were downloaded from https://www.fibroxplorer.com/download. Additional data presented here are available upon request from the corresponding author. Source data are provided with this paper.
References
- 1.Al Nabhani Z & Eberl G Imprinting of the immune system by the microbiota early in life. Mucosal Immunol. 13, 183–189 (2020). [DOI] [PubMed] [Google Scholar]
- 2.Scharschmidt TC et al. A wave of regulatory T cells into neonatal skin mediates tolerance to commensal microbes. Immunity 43, 1011–1021 (2015). [DOI] [PMC free article] [PubMed] [Google Scholar]
- 3.Scharschmidt TC et al. Commensal microbes and hair follicle morphogenesis coordinately drive Treg migration into neonatal skin. Cell Host Microbe 21, 467–477 (2017). [DOI] [PMC free article] [PubMed] [Google Scholar]
- 4.Kim JM, Rasmussen JP & Rudensky AY Regulatory T cells prevent catastrophic autoimmunity throughout the lifespan of mice. Nat. Immunol 8, 191–197 (2007). [DOI] [PubMed] [Google Scholar]
- 5.Nussbaum JC et al. Type 2 innate lymphoid cells control eosinophil homeostasis. Nature 502, 245–248 (2013). [DOI] [PMC free article] [PubMed] [Google Scholar]
- 6.Collins N et al. Skin CD4+ memory T cells exhibit combined cluster-mediated retention and equilibration with the circulation. Nat. Commun 7, 11514 (2016). [DOI] [PMC free article] [PubMed] [Google Scholar]
- 7.Kobayashi T et al. Homeostatic control of sebaceous glands by innate lymphoid cells regulates commensal bacteria equilibrium. Cell 176, 982–997.e16 (2019). [DOI] [PMC free article] [PubMed] [Google Scholar]
- 8.Ali N et al. Regulatory T cells in skin facilitate epithelial stem cell differentiation. Cell 169, 1119–1129.e11 (2017). [DOI] [PMC free article] [PubMed] [Google Scholar]
- 9.Buechler MB et al. Cross-tissue organization of the fibroblast lineage. Nature 593, 575–579 (2021). [DOI] [PubMed] [Google Scholar]
- 10.Joost S et al. The molecular anatomy of mouse skin during hair growth and rest. Cell Stem Cell 26, 441–457.e7 (2020). [DOI] [PubMed] [Google Scholar]
- 11.Zhang L et al. Diet-induced obesity promotes infection by impairment of the innate antimicrobial defense function of dermal adipocyte progenitors. Sci. Transl. Med 13, eabb5280 (2021). [DOI] [PMC free article] [PubMed] [Google Scholar]
- 12.Driskell RR et al. Distinct fibroblast lineages determine dermal architecture in skin development and repair. Nature 504, 277–281 (2013). [DOI] [PMC free article] [PubMed] [Google Scholar]
- 13.Kimura-Ueki M et al. Hair cycle resting phase is regulated by cyclic epithelial FGF18 signaling. J. Invest. Dermatol 132, 1338–1345 (2012). [DOI] [PubMed] [Google Scholar]
- 14.Kim BS et al. TSLP elicits IL-33-independent innate lymphoid cell responses to promote skin inflammation. Sci. Transl. Med 5, 170ra16 (2013). [DOI] [PMC free article] [PubMed] [Google Scholar]
- 15.Salimi M et al. A role for IL-25 and IL-33-driven type-2 innate lymphoid cells in atopic dermatitis. J. Exp. Med 210, 2939–2950 (2013). [DOI] [PMC free article] [PubMed] [Google Scholar]
- 16.Ricardo-Gonzalez RR et al. Tissue signals imprint ILC2 identity with anticipatory function. Nat. Immunol 19, 1093–1099 (2018). [DOI] [PMC free article] [PubMed] [Google Scholar]
- 17.Obata-Ninomiya K et al. The skin is an important bulwark of acquired immunity against intestinal helminths. J. Exp. Med 210, 2583–2595 (2013). [DOI] [PMC free article] [PubMed] [Google Scholar]
- 18.Boothby IC, Cohen JN & Rosenblum MD Regulatory T cells in skin injury: at the crossroads of tolerance and tissue repair. Sci. Immunol 5, eaaz9631 (2020). [DOI] [PMC free article] [PubMed] [Google Scholar]
- 19.Correa-Gallegos D et al. Patch repair of deep wounds by mobilized fascia. Nature 576, 287–292 (2019). [DOI] [PubMed] [Google Scholar]
- 20.Naik S et al. Inflammatory memory sensitizes skin epithelial stem cells to tissue damage. Nature 550, 475–480 (2017). [DOI] [PMC free article] [PubMed] [Google Scholar]
- 21.Findley TW, Chaitow L & Huijing P (eds) Fascia: The Tensional Network of the Human Body (Churchill Livingstone, 2012). [Google Scholar]
- 22.Stuart T et al. Comprehensive integration of single-cell data. Cell 177, 1888–1902 (2019). [DOI] [PMC free article] [PubMed] [Google Scholar]
- 23.Ramachandran P et al. Resolving the fibrotic niche of human liver cirrhosis at single-cell level. Nature 575, 512–518 (2019). [DOI] [PMC free article] [PubMed] [Google Scholar]
- 24.Chan KK et al. Eosinophilic fasciitis following checkpoint inhibitor therapy: four cases and a review of literature. Oncologist 25, 140–149 (2020). [DOI] [PMC free article] [PubMed] [Google Scholar]
- 25.Mortezavi M, Barrett M & Edrissian M Successful treatment of refractory eosinophilic fasciitis with reslizumab. JAAD Case Rep. 6, 951–953 (2020). [DOI] [PMC free article] [PubMed] [Google Scholar]
- 26.Merrick D et al. Identification of a mesenchymal progenitor cell hierarchy in adipose tissue. Science 364, eaav2501 (2019). [DOI] [PMC free article] [PubMed] [Google Scholar]
- 27.Dahlgren MW et al. Adventitial stromal cells define group 2 innate lymphoid cell tissue niches. Immunity 50, 707–722.e6 (2019). [DOI] [PMC free article] [PubMed] [Google Scholar]
- 28.Spallanzani RG et al. Distinct immunocyte-promoting and adipocyte-generating stromal components coordinate adipose tissue immune and metabolic tenors. Sci. Immunol 4, eaaw3658 (2019). [DOI] [PMC free article] [PubMed] [Google Scholar]
- 29.Schwalie PC et al. A stromal cell population that inhibits adipogenesis in mammalian fat depots. Nature 559, 103–108 (2018). [DOI] [PubMed] [Google Scholar]
- 30.Scott RW, Arostegui M, Schweitzer R, Rossi FMV & Underhill TM Hic1 defines quiescent mesenchymal progenitor subpopulations with distinct functions and fates in skeletal muscle regeneration. Cell Stem Cell 25, 797–813.e9 (2019). [DOI] [PMC free article] [PubMed] [Google Scholar]
- 31.Dahlgren MW & Molofsky AB Adventitial cuffs: regional hubs for tissue immunity. Trends Immunol. 40, 877–887 (2019). [DOI] [PMC free article] [PubMed] [Google Scholar]
- 32.Vainchtein ID et al. Astrocyte-derived interleukin-33 promotes microglial synapse engulfment and neural circuit development. Science 359, 1269–1273 (2018). [DOI] [PMC free article] [PubMed] [Google Scholar]
- 33.Hagan AS, Zhang B & Ornitz DM Identification of a FGF18-expressing alveolar myofibroblast that is developmentally cleared during alveologenesis. Development 147, dev181032 (2020). [DOI] [PMC free article] [PubMed] [Google Scholar]
- 34.Camberis M et al. Evaluating the in vivo Th2 priming potential among common allergens. J. Immunol. Methods 394, 62–72 (2013). [DOI] [PubMed] [Google Scholar]
- 35.Bankhead P et al. QuPath: open source software for digital pathology image analysis. Sci. Rep 7, 16878 (2017). [DOI] [PMC free article] [PubMed] [Google Scholar]
- 36.Yang B et al. Single-cell phenotyping within transparent intact tissue through whole-body clearing. Cell 158, 945–958 (2014). [DOI] [PMC free article] [PubMed] [Google Scholar]
- 37.Korotkevich G et al. Fast gene set enrichment analysis. Preprint at bioRxiv 10.1101/060012 (2021). [DOI] [Google Scholar]
Associated Data
This section collects any data citations, data availability statements, or supplementary materials included in this article.
Supplementary Materials
Data Availability Statement
Sequencing data are publicly available at the Gene Expression Omnibus under accession number GSE183031. Cross-tissue fibroblast atlas data9 were downloaded from https://www.fibroxplorer.com/download. Additional data presented here are available upon request from the corresponding author. Source data are provided with this paper.