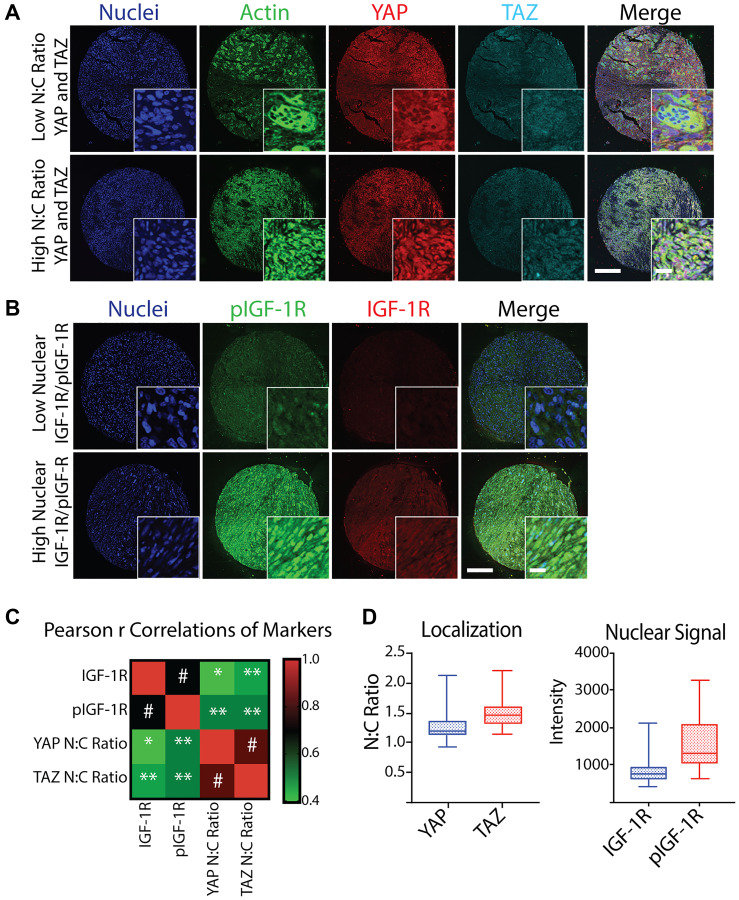
Figure 1. Quantification and correlation of YAP N:C ratio, TAZ N:C ratio, nuclear IGF-1R intensity, and nuclear pIGF-1R intensity from a TMA of post-treatment osteosarcoma biopsies.
(A) Representative confocal microscopy images of osteosarcoma taken at post-treatment biopsy in a tissue microarray (TMA) displaying low (top) and high (bottom) N:C ratio of YAP and TAZ co-stained with Hoechst (nuclei, blue), phalloidin (actin, green), scale = 250 μm, inset scale = 20 μm. (B) Representative confocal microscopy images of osteosarcoma TMA displaying low (top) and high (bottom) nuclear IGF-1R and pIGF-1R (bottom) co-stained with Hoechst (nuclei, blue), scale = 250 μm. (C) Heatmap of Spearman r Correlations of YAP N:C ratio, TAZ N:C ratio, mean nuclear IGF-1R intensity, and mean nuclear pIGF-1R intensity for each patient represented in the TMA (n = 37 for IGF-1R/pIGF-1R and n = 36 for YAP/TAZ due to loss of one sample on TMA) with corresponding p values. * p < 0.05, ** p < 0.01, # p ≤ 0.001. (D) Box plots of average marker values per patient across all patients represented in the TMA. Shaded boxes with inner line represent the interquartile range and median, where whiskers represent the range of calculated patient values.

