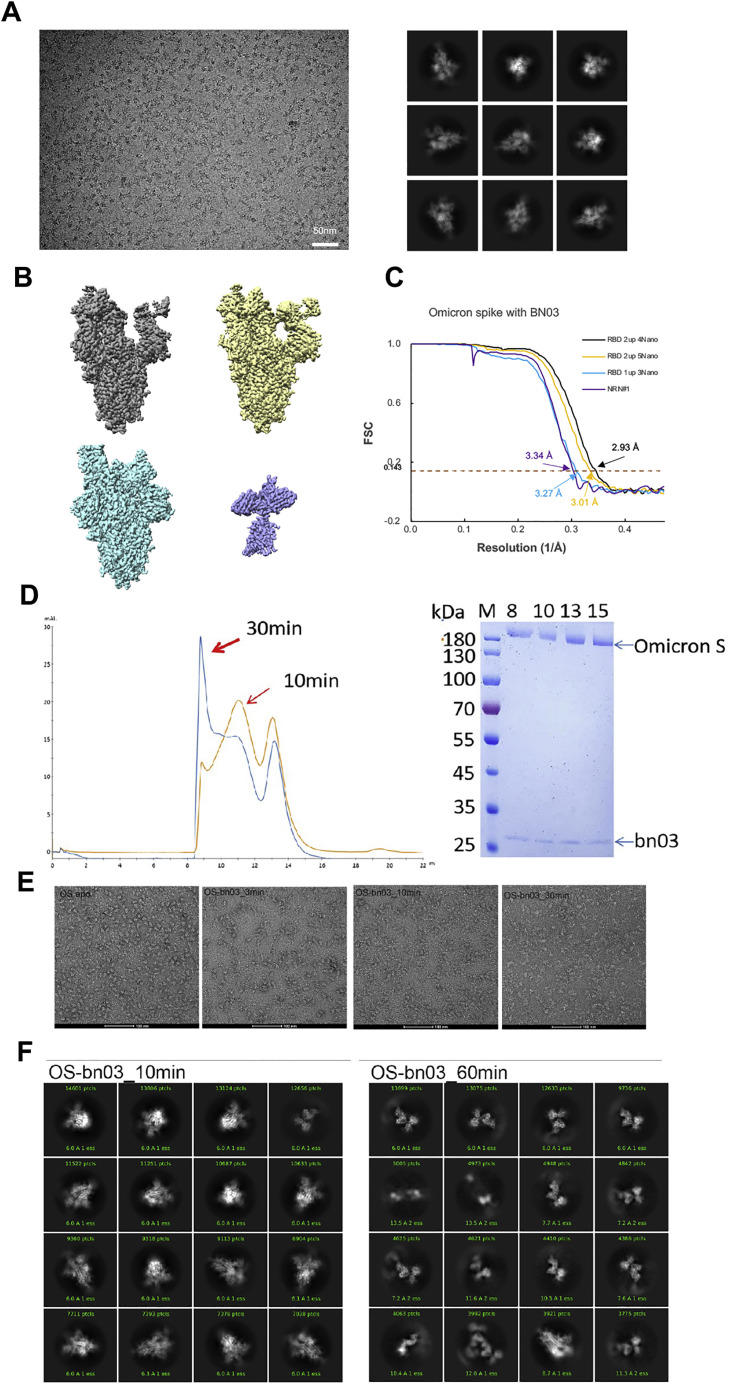
Figure S5.
Cryo-EM data collection and processing of bn03 bound SARS-CoV-2 Omicron S, related to Figure 3
(A) Representative electron micrograph and 2D classification results of XG014 bound SARS-CoV-2 S.
(B) The reconstruction map of the complex structures at three states and one local refinement map. (C) Gold-standard Fourier shell correlation curves for each structure. The 0.143 cut-off is indicated by a horizontal dashed line.
(D) Purification of bn03-Oimcron S complex. The gel-filtration curved showed that incubation of bn03 with Omicron-S-induced aggregation of S protein.
(E) Negative stain images of bn03-Omicron S complex, showing that incubating with bn03 for 30 min leads to Omicron S trimer disassembly. The disassembled monomers tend to aggregate.
(F) The 2D classification result of cryo-EM data collected using 10-min incubation complex and 60-min incubation complex.

