

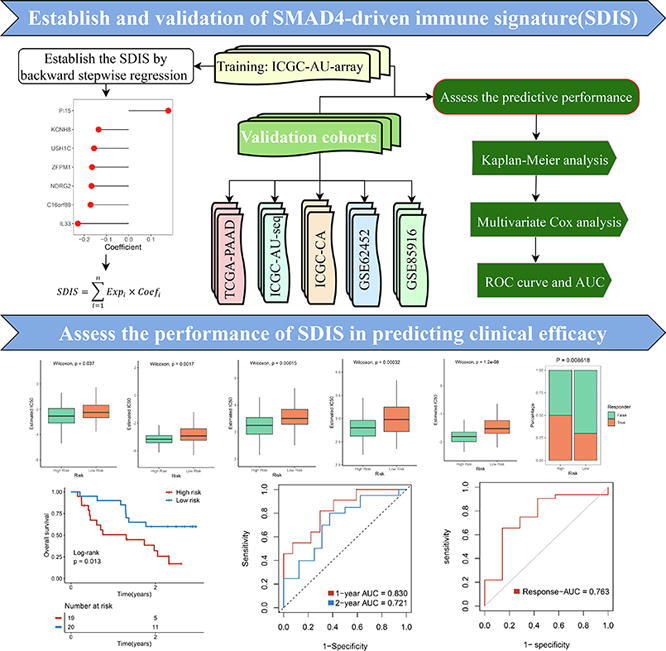
Graphical abstract
Keywords: Pancreatic cancer, SMAD4 mutation, Signature, Prognosis, Therapeutic response
Highlights
-
•
SMAD4 mutation affect the oncogenesis, progression and immunity of pancreatic cancer.
-
•
Combined with immune subtypes, a SMAD4-driven immune signature (SDIS) was established.
-
•
SDIS could robustly predict prognosis and efficacy in six independent cohorts.
-
•
SDIS might serve as an attractive platform to further tailor decision-making.
Abstract
SMAD4 mutation was recently implicated in promoting invasion and poor prognosis of pancreatic cancer (PACA) by regulating the tumor immune microenvironment. However, SMAD4-driven immune landscape and clinical significance remain elusive. In this study, we applied the consensus clustering and weighted correlation network analysis (WGCNA) to identify two heterogeneous immune subtypes and immune genes. Combined with SMAD4-driven genes determined by SMAD4 mutation status, a SMAD4-driven immune signature (SDIS) was developed in ICGC-AU2 (microarray data) via machine learning algorithm, and then was validated by RNA-seq data (TCGA, ICGC-AU and ICGC-CA) and microarray data (GSE62452 and GSE85916). The high-risk group displayed a worse prognosis, and multivariate Cox regression indicated that SDIS was an independent prognostic factor. In six cohorts, SDIS also displayed excellent accuracy in predicting prognosis. Moreover, the high-risk group was characterized by higher frequencies of TP53/CDKN2A mutations and SMAD4 deletion, superior immune checkpoint molecules expression and more sensitive to chemotherapy and immunotherapy. Meanwhile, the low-risk group was significantly enriched in metabolism-related pathways and suggested the potential to target tumor metabolism to develop specific drugs. Overall, SDIS could robustly predict prognosis in PACA, which might serve as an attractive platform to further tailor decision-making in chemotherapy and immunotherapy in clinical settings.
1. Introduction
As a digestive system tumor with high malignancy, metastasis tendency and insidious onset, pancreatic cancer (PACA) ranks the fourth highest mortality rate among tumor-related deaths [1]. Pancreatic ductal adenocarcinoma (PDAC) was the most common histologic type, accounting for about 90% of cases [2]. Over the two decades, the incidence of PACA has been increasing at an annual rate of 0.5–1.0%, and the 5-year survival rate has only increased from 5.26% in 2000 to 10% in 2020, without qualitative improvement [2]. As a standard first-line treatment modality, surgery combined with adjuvant chemotherapy achieved relatively long survival, but only very few patients with resectable disease could benefit from it [3]. Compared with other malignant tumors (e. g. liver cancer, lung cancer), the clinical breakthroughs in early detection and diagnosis of PACA were relatively lacking, and 80–85% of PACA patients have developed local progression and metastasis at the time of diagnosis [3]. With the development of next-generation sequencing and molecular targeted drugs, PARP inhibitors have shown great potential in PACA patients with BRCA mutation [3]. However, a recent phase III clinical trial displayed that Olaparib (a PARP inhibitor) prolonged progression-free survival from 3.8 months to 7.4 months compared with placebo, but the overall survival (OS) no statistical difference between the two groups [4]. Therefore, new clinical management and treatment strategies were urgently needed to improve outcomes in PACA patients.
Immunotherapy represented by immune checkpoint inhibitors (ICIs) has brought a new dawn for the treatment of solid tumors, unfortunately, ICIs alone have been clinically proven ineffective in PACA [5]. Increased evidences confirmed that the tumor microenvironment (TME) of PACA was characterized by rare immune effector cells (e.g., CD8 + T cells) and abundant immunosuppressive cells, such as regulatory T cells (Tregs), myeloid‐derived suppressor cells (MDSCs), M2‐type macrophages, and cancer-associated fibroblasts (CAFs), all of which may contribute to immune escape and tolerance in immunotherapy [3]. Numerous clinical trials also have demonstrated disappointing results either with ICIs alone or in combination with anti-CTLA-4 and anti-PD-1/PD-L1 [5]. Cancer vaccines, chemoradiotherapy and other treatments that promote T cell activation, combined with ICIs, have also not achieved significant success [5]. Gratifyingly, the CD40 agonistic antibody APX005M was approved by the FDA in 2020 as an orphan drug for PACA, following encouraging results from a phase Ib multicenter clinical trial [6]. The results showed that APX005M and gemcitabine plus nab-paclitaxel as first-line therapy created a 58% response rate in metastatic PACA patients [6]. Therefore, in the future, identifying patients with “immune-hot” and adopting combination therapy as early as possible may be a promising strategy for PACA patients.
SMAD4, also known as DPC4 (Deleted in pancreatic cancer locus4), encodes a core mediator of the TGF-β pathway and has been confirmed to play a tumor-suppressive role in various tumors such as PACA, cholangiocarcinoma and colorectal cancer, etc. [7]. Mutation or deletion of SMAD4 occurs in approximately 55% of PACA patients, and SMAD4 mutation was associated with shorter OS in PACA [8], [9]. Multiple studies have verified that SMAD4 mutation could render PACA resistant to radiotherapy by promoting autophagy, and SMAD4 gene therapy could reverse the invasive phenotype of SMAD4-deleted PACA cells [9], [10]. In addition, the TGF-β/SMAD4 signaling pathway was also involved in regulating the PACA TME and mediating the crosstalk between the tumor and stroma [11]. Ablation of SMAD4 modulates the immunosuppressive PACA microenvironment and enhances tumor cells sensitivity to combined immunotherapy by increasing T cells infiltration [12]. However, a comprehensive understanding of the role of SMAD4 mutation on the PACA immune microenvironment and their specific function in immunotherapy remains unknown.
Therefore, SMAD4 mutation played a vital role in TME, and might serve as a potential biomarker for monitoring PACA development and evaluating therapeutic efficacy. In this study, based on machine learning algorithm, we constructed and validated a SMAD4-driven immune signature (SDIS). SDIS exhibited excellent performance in evaluating the prognosis, chemotherapy, and immunotherapy efficacy of PACA patients. In addition, PACA patients in the high- and low-risk groups showed distinct clinical features, functional pathways, genome-driven events, and immune infiltration landscapes. Furthermore, SDIS also demonstrated excellent stability and robustness in five validation cohorts and one immunotherapy cohort. Overall, our study provides an available reference to understand the role of SMAD4 mutation in the PACA immune microenvironment, and reveals the underlying roles of SDIS in the stratified management and individualized treatment of PACA patients.
2. Materials and methods
2.1. Data acquisition and processing
All data processing, statistical analysis and visualization for this study were carried out in the R 4.0.5 software. We collected datasets meeting the study objectives from The Cancer Genome Atlas (TCGA, http://portal.gdc.cancer.gov/), International Cancer Genome Consortium (ICGC, http://dcc.icgc.org/), and Gene Expression Omnibus (GEO, https://www.ncbi.nlm.nih.gov/geo/) databases using the following criteria: (1) at least 50 PACA patients with clinical and prognostic information; (2) probes and gene IDs were clearly annotated, and >10,000 genes; (3) patients with primary tumors who did not receive other confounding factor interventions before sampling. Finally, we included 850 samples from six datasets, TCGA (n = 176), ICGC-PACA-AU-seq (ICGC-AU, n = 81), ICGC-PACA-AU-array (ICGC-AU2, n = 267), ICGC-PACA-CA (ICGC-CA, n = 182), GSE62452 (NCI, National Cancer Institute cohort, n = 65) and GSE85916 (n = 79). Of these, 158, 385, and 268 samples with genomic mutation data were included in TCGA, ICGC-PACA-AU, and ICGC-PACA-CA cohorts, respectively. The normalized matrix files of GEO cohorts were directly downloaded. RNA-seq data from TCGA (FPKM normalized) were generated from the UCSC-Xena database and further transformed into log2 (TPM + 1) format. Both exp-array and RNA-seq data of ICGC were obtained from its portal. The detailed baseline data of the six cohorts were presented in Table S1.
2.2. Single sample gene set enrichment analysis
Following the approach described in previous article, we utilized the ssGSEA algorithm in the “GSVA” package to evaluate the infiltration fractions of 28 immune cell types in TCGA cohort [13].
2.3. Consensus clustering
Based on the infiltration fraction of TME cells, we further performed consensus clustering in TCGA cohort by the “ConsensusClusterPlus” package [14]. The parameters were set as the Euclidean distance-based pam algorithm with 1000 iterations, and 80% of the samples were randomly drawn at each iteration. The optimal number of clusters was picked from the number of 2–9 clusters based on the CDF and PAC of the consensus score, and the clustering results were further visualized by two-dimensional PCA.
2.4. Differential expression analysis
To identify genes driven by SMAD4 mutation in PACA patients, we further used the “edgeR” package to differentially analyze between the SMAD4MUT and SMAD4WT patients. A cutoff threshold false discovery rate (FDR) < 0.05 along with FC < 2/3 or > 3/2 was set to identify DEGs.
2.5. Weighted correlation network analysis
We further conducted co-expression analysis using the “WGCNA” package to cluster gene modules with similar expression patterns while highly associated with the immune subtypes [15]. As shown in Fig. 3E, the soft power of β = 5 (scale-free R2 = 0.9) was selected, and then we further constructed the adjacency matrix by raising the intergenic Pearson correlation matrix to the soft threshold power. Next, the topological overlap matrix (TOM) was calculated using the TOMsimilarity algorithm, and genes with similar co-expression patterns in the samples were hierarchically clustered into different modules through dissimilarity between the TOM matrices (1-TOM). The cutreeDynamic algorithm (setting a minimum module size of 100) was utilized to incorporate similar co-expression modules. Finally, we calculated the correlation between each module and the clinical traits of the samples, and further selected the modules with the highest module-immune subtype associations to determine the genes highly correlated with immunity.
Fig. 3.

Screening immune-related genes. (A) The consensus score matrix of all samples when k = 2. A higher consensus score between two samples indicates they are more likely to be grouped into the same cluster in different iterations. (B) The cumulative distribution functions of consensus matrix for each k (indicated by colors). (C) The proportion of ambiguous clustering (PAC) score, a low value of PAC implies a flat middle segment, allowing conjecture of the optimal k (k = 2) by the lowest PAC. (D) Two-dimensional principal component plot by the abundance of 28 immune cell types in the two clusters. The orange dots represented C2, and blue dots represented C1. (E) Analysis of network topology for various soft-thresholding powers. (F) The infiltration heatmap of 28 immune cell types in the two subtypes. (G) The correlation heatmap of the modules obtained by WGCNA and clinical traits. (H) The correlation between genes within black modules with immune subtypes.
2.6. Signature generation
Genes recognized by WGCNA as closely related to immunity and simultaneously driven by SMAD4 mutation were defined as the SMAD4-driven immune genes (SDIGs). We performed univariate Cox regression analysis to determine the prognostic performance of SDIGs in four cohorts with mutational information. Next, we selected eligible genes (P < 0.2 and all of the hazard ratio (HR) > 1 or < 1) in at least 3/4 of the cohorts for backward stepwise regression and used the following formula to establish SDIS that can predict the prognosis of PACA patients:
where n denotes the gene in SDIS, Expi denotes the expression level of genei, and Coefi denotes the regression coefficient of genei in the backward stepwise regression analysis. Patients in ICGC-AU2 training set and TCGA, ICGC-AU, ICGC-CA, GSE62452 and GSE85916 validation sets were then stratified into the high- and low-risk groups using the median risk score. The performance of SDIS was further assessed by Kaplan-Meier survival analysis, multivariate Cox regression analysis, as well as receiver operating characteristic (ROC) curve and area under the ROC curve (AUC) value.
2.7. Genomic alteration analysis
Somatic mutation data for the ICGC cohort were downloaded from its portal. The raw mutation file of TCGA was obtained using the “TCGAbiolinks” package. The mutation landscape of PACA patients and high- and low-risk groups was visualized by the waterfall function of the “maftools” package. Copy number variation (CNV) data for the high- and low-risk groups of TCGA cohort were acquired through the cBioportal portal website.
2.8. Gene set enrichment analysis
The gseKEGG and gseGO functions of the “clusterProfiler” package were conducted to perform GSEA, and further identified the KEGG and GO pathways that were significantly enriched in the high- and low-risk groups. The enrichment pathways in the top five of normalized enrichment score (NES) and adjusted P value < 0.05 were selected for visualization.
2.9. Immune molecule expression and immunogenicity assessment
The “MCPcounter” package was used to evaluate the infiltration abundance of immune cell types and stromal cells in PACA samples. A total of 27 ICMs including 10 B7-CD28 family, 9 TNF superfamily as well as 8 other molecules were recruited from a previous article [16]. In addition, IPS calculated using a range of marker molecules for immune response or tolerance were used to measure immunogenicity in the high- and low-risk groups [17]. The higher IPS and TMB indicated stronger immunogenicity of tumors.
2.10. Response to chemotherapy
The pRRopheticPredict function of the “pRRophetic” package was applied to estimate the half-maximal inhibitory concentration (IC50) of several common drugs such as gemcitabine, paclitaxel and cisplatin, TP53 activator JNJ.26854165 and CDK Inhibitor CGP.60474 in TCGA cohort. The lower IC50 was more sensitive to this drug.
2.11. Evaluation the efficacy of immunotherapy
TIDE website was employed to predict responsiveness to ICIs in the high- and low-risk groups [18], [19]. The Subclass Mapping (Submap) algorithm was implemented to calculate the similarity of the expression pattern of PACA patients in the high- and low-risk groups to melanoma patients who responded/non-responded to immunotherapy, which in turn indirectly predicted immunotherapy efficacy [20], [21]. In addition, we enrolled an additional publicly available cohort of 39 patients with advanced melanoma who received anti-PD-1 therapy (GSE91061) [22]. Kaplan-Meier survival curve, ROC curve and AUC for predicting patient survival and response to immunotherapy were computed to assess the predictive power of SDIS in GSE91061 cohort.
2.12. Statistical analysis
Categorical variables were analyzed by Pearson's chi-square test or Fisher's exact test. Continuous variables were compared using Wilcoxon rank sum test or Student’s t test. Univariate, multivariate Cox regression and Kaplan-Meier prognostic analysis were performed by the “survival” package. ROC curve and AUC for predicting response to immunotherapy were generated by the “AUC” package, and survival ROC curves and AUCs for the training set, five validation sets as well as the immunotherapy cohort were all quantified by the “timeROC” package. P values of two-sided<0.05 were considered statistically significant.
3. Results
3.1. Mutational landscape and genes driven by SMAD4 mutation
Our workflow is illustrated in Fig. 1. SMAD4 mutation was one of the most frequent mutation types in TCGA cohort, with 18% mutation frequency and was located only after TP53, KRAS and CDKN2A. Among them, missense mutation, nonsense mutation and frameshift deletion were the most common types (Fig. 2A). Similarly, in ICGC-AU and ICGC-CA cohorts, SMAD4 mutation ranked third and fifth with mutation frequency of 21% and 22%, respectively (Fig. S1). The results of differential analysis showed that 1881 differentially expressed genes (DEGs) were significantly up-regulated while 398 DEGs were down-regulated in SMAD4MUT patients compared with SMAD4WT patients, with BPIFB2, PRSS57, SFTPC, MPPED1 and CGB ranking in the top five-fold change (FC, Fig. 2B).
Fig. 1.

The workflow of our research. Our detailed process for obtaining SMAD4-driven immune genes and establishing SDIS is as follows: (1). According to the SMAD4 mutation status of PACA samples, we first obtained 2279 SMAD4 mutation-driven genes by differential analysis. (2). The abundance of 28 immune cell types in PACA samples was assessed using the single sample gene set enrichment analysis(ssGSEA) algorithm, after which the samples were stratified into two immune subtypes (Immune-H and Immune-L) using consensus clustering, and the black module (containing 1446 immune-related genes) most associated with immune subtypes was further identified using the weighted correlation network analysis (WGCNA) algorithm. (3). Using Venn diagram, 180 SMAD4-driven immune genes were obtained by intersection of 2279 SMAD4-driven genes and 1446 immune-related genes. (4). Afterwards, we screened 3 risk and 14 protective eligible genes (P < 0.2 and all of the hazard ratio (HR) > 1 or < 1) in at least 3/4 of the cohorts by univariate Cox regression analysis. (5). Finally, we generated a 7-gene prognostic signature in the ICGC-AU2 training cohort by backward stepwise regression machine learning algorithm using the 17 eligible genes obtained in step (4) and named: SMAD4-driven immune signature (SDIS).
Fig. 2.

Mutational landscape and genes driven by SMAD4 mutation of pancreatic cancer (PACA) patients in TCGA cohort. (A) Frequency and type of mutations in the top 30 genes in PACA. Genes are sorted according to frequency of mutations. (B) Identification the differentially expressed genes between the SMAD4MUT and SMAD4WT patients. Orange dots represented up-regulated genes, green dots represented down-regulated genes and grey dots represented genes with no significance.
3.2. Consensus clustering identifies two immune subtypes
Based on the infiltration of 28 immune cell subsets, two heterogenous immune subtypes of PACA samples were revealed (Fig. 3A). The cumulative distribution function (CDF) curve and proportion of ambiguous clustering (PAC) analysis of the consensus score further confirmed that division into two clusters was the best choice (Fig. 3B, C). The principal component analysis (PCA) of TCGA cohort also showed that the two groups of samples were significantly separated in spatial distribution (Fig. 3D). Among them, subtype 1 displayed a significantly superior infiltration abundance of immune cell types, while immunity of subtype 2 was relatively deficient, which were defined as Immune-H and Immune-L subtypes, respectively (Fig. 3F).
3.3. Identification of an immune-related co-expression module based on WGCNA
Weighted correlation network analysis (WGCNA) is a powerful bioinformatics analysis tool to identify genes with similar expression patterns [15]. We sought to identify specific modules closely related to the immune subtypes using WGCNA. Based on TCGA cohort expression profile, we identified 8 modules, among which the gray module was the gene composition that could not be assigned to other modules due to low correlation. We then included several vital clinical traits such as age, gender, stage, TNM stage and grade, and the results of correlation analysis showed that the black module containing 1446 genes not only had the strongest association with immune subtypes (R^2 = 0.76, P < 0.001), but also had a significant correlation with OS, gender, M stage and grade (Fig. 3G). Further analysis also confirmed an extremely strong correlation between genes within the black module and immune subtypes (R = 0.94, P < 0.001, Fig. 3H).
3.4. Construction of a SMAD4-driven immune signature
We obtained 180 SDIGs by intersection of 2279 SMAD4-driven genes and 1446 immune genes by Venn diagram (Fig. S2A). According to the screening criteria that were consistently risk or protective factors in at least 3/4 of the cohorts, we identified 3 risk genes and 14 protective genes from the results of univariate Cox regression analysis (Fig. S2B-C). The detailed univariate Cox regression results of these 17 eligible genes in the four cohorts were shown in Fig. S2D–G. Next, based on backward stepwise regression, we established SDIS in the training set using these genes. The risk score for each sample of the training and validation sets can be calculated using the following equation: SDIS = 0.1781 * Expression (PI15) −0.1352 * Expression (KCNH8) −0.1555 * Expression (USH1C) −0.1643 * Expression (ZFPM1) −0.1668 * Expression (NDRG2) −0.1713 * Expression (C16orf89) −0.2283 * Expression (IL33).
Next, we stratified PACA patients into the high- and low-risk groups using the median value (0.94), and the Kaplan-Meier survival curves for OS and relapse-free survival (RFS) showed that the high-risk group had significantly shorter survival (Fig. 4A, B). The results of multivariate Cox regression analysis including age, gender, stage, grade and SMAD4 mutation status also demonstrated that SDIS was an independent risk factor for OS and RFS (HR: 1.494 [1.305–1.710] and 1.942 [1.472–2.563], P < 0.05, Fig. 4C, D). In addition, in the training set, the AUC values of SDIS for predicting 1-, 2-, and 3-years OS were 0.715, 0.708, and 0.630, respectively, suggesting that SDIS could accurately predict the prognosis of PACA patients (Fig. 4E).
Fig. 4.

The development and validation of SMAD4-driven immune signature (SDIS) for pancreatic cancer (PACA). (A, B) Kaplan-Meier analysis for OS (A) and RFS (B) between the high- and low-risk groups in ICGC-AU2 cohort. (C, D) Multivariate Cox regression analysis of OS (C) and RFS (D) in ICGC-AU2 cohort. (E-J) The ROC curves of SDIS for predicting 1-, 2-, and 3-years OS in ICGC-AU2 cohort (E), TCGA cohort (F), ICGC-AU cohort (G), ICGC-CA cohort (H), GSE62452 cohort (I), GSE85916 cohort (J). OS, overall survival; RFS, relapse-free survival; ROC, receiver operating curve.
3.5. Validation of SDIS in five external cohorts
To investigate the stability and robustness of SDIS, we evaluated its performance in TCGA, ICGC-AU, ICGC-CA, GSE62452, and GSE85916 validation cohorts. Consistent with ICGC-AU2 training cohort, the Kaplan-Meier survival analysis results of the five external validation cohorts indicated that patients stratified into the high-risk groups had significantly shorter OS and RFS than the low-risk group (all P < 0.05, Fig. S3A-H). Furthermore, we verified the prognostic value of SDIS as a continuous variable in the validation cohort by multivariate Cox regression analysis. After adjustment for confounders such as age, gender, stage, grade and SMAD4 mutation status, SDIS remained statistically significant in TCGA (HR: 1.237 [1.003–1.526]), ICGC-AU (HR: 1.462 [1.126–1.898]) and ICGC-CA cohorts (HR: 1.313 [1.074–1.605]) (all P < 0.05, Fig. S3I, K, M). Multivariate Cox results of RFS also suggested that SDIS was an independent risk factor in ICGC-AU (HR: 2.084 [1.251–3.472]) and ICGC-CA cohorts (HR: 1.646 [1.287–2.105], P < 0.05, Fig. S3L, N). It is worth pointing out that since only 69 of 176 samples in TCGA cohort owned RFS information, although SDIS showed a corresponding trend, it lacked statistical significance (HR: 1.317 [0.940–1.844], P = 0.109, Fig. S3J). As shown in Fig. 4F–J, the AUCs of SDIS for 1-, 2-, and 3-year OS in the five validation cohorts reached 0.638, 0.603 and 0.684 in TCGA cohort; 0.745, 0.774 and 0.730 in ICGC-AU cohort; 0.633, 0.680 and 0.696 in ICGC-CA cohort; 0.679, 0.846 and 0.883 in GSE62452 cohort; and 0.688, 0.661 and 0.738 in GSE85916 cohort, respectively. Overall, these results demonstrated that SDIS was a robust and feasible prognostic model in PACA.
The results of the above multivariate Cox regression analysis indicated that SMAD4 mutation status could not accurately predict prognosis of PACA, whereas our SDIS remained an independent risk factor for OS and RFS in PACA patients (Fig. 3C, D, Fig. S3I-N). To further verify whether SMAD4 mutation alone could predict prognosis in the SDIS subtype, we further performed Kaplan-Meier survival analysis in the whole, high-risk and low-risk PACA samples. The OS and RFS results of all four cohorts suggested that SMAD4 mutation status could not accurately stratify PACA patients (P > 0.05, Fig. S4A–W). These results confirmed the superiority of SDIS over SMAD4 mutation alone in predicting the prognosis of PACA patients.
3.6. Genomic landscape of SDIS
By drawing a waterfall plot of the top 20 mutations in both groups, we found that among the top 5 high-frequency mutations, TP53, KRAS and CDKN2A mutations were more frequent in the high-risk group than in the low-risk group, while SMAD4 and TTN were the opposite (Fig. 5A-B). Additionally, we also investigated the recurrent copy number amplification and deletion in the high- and low-risk groups, and the results showed that the high-frequency homozygous deletions (HOMDEL) were generally consistent between the two groups, but amplifications differed greatly (Fig. 5C). In the high-risk group, amplification mainly occurred on the oncogene MYC, transcriptional pseudogene POU5F1B, and long non-coding RNAs (LncRNAs, CCAT2, CCAT1, CASC8, PRNCR1, PCAT1), etc. On the other hand, the transcription factor (GATA6), lncRNAs (GATA6-AS1, MIR133A1HG, TTC39C-AS1), transmembrane protein (TMEM241), ubiquitin protein ligase (MIB1), and Cyclin-dependent Kinase (CDK) regulator (CABLES1) were amplified in the low-risk group. In term of HOMDEL, we observed relatively consistent high-frequency deletion in CDK inhibitors (CDKN2A, CDKN2B, etc.), interferon (IFNE, IFNA8, etc.) and lncRNAs (LINC01239, MIR31HG, etc.) in the two groups. Of note, the deletion frequency of SMAD4 in the high-risk group reached 20.5%, while it was only 5.8% in the low-risk group. In summary, mutations and CNVs landscape differ greatly between the two groups, which provided a novel orientation for chemotherapy.
Fig. 5.

The genomic alterations landscape of the high- and low-risk groups in TCGA cohort. (A) The waterfall plot of top 20 mutation genes in the two groups. Each column represented individual patients. The right barplot and number indicated the mutation frequency in each gene. The color of each column indicated the mutation type of this gene in the sample. (B) Heatmap of mutation frequency of top 20 mutation genes in the high- and low-risk groups. (C) The top 10 amplification and homozygous deletion (HOMDEL) genes in the high- and low-risk groups.
3.7. Underlying mechanisms and clinical significances of SDIS
To further elucidate the potential biological characteristics of the two groups, we performed Gene set enrichment analysis (GSEA) of Kyoto Encyclopedia of Genes and Genomes (KEGG) and Gene Ontology (GO) pathways. As illustrated, the high-risk group was observably enriched in immunity and cell proliferation-related pathways (Fig. 6A, C). For example, antigen processing and presentation, natural killer (NK) cell-mediated cytotoxicity, ECM-receptor interaction and focal adhesion and collagen fibril organization, as well as cell proliferation-related pathways such as cell cycle and sister chromatid segregation. While the low-risk group was predominantly associated with metabolic and digestion-related biological processes, including fat digestion and absorption, pancreatic secretion, retinol metabolism and xenobiotic metabolic process, etc. (Fig. 6B, D).
Fig. 6.

The KEGG and GO enriched pathways and immune landscapes in the high- and low-risk groups. (A-B) The top five KEGG enriched pathways in the high (A) and low (B) risk groups. (C-D) The top five GO enriched pathways in the high (C) and low (D) risk groups. (E) The heatmaps of 8 immune cell types and 27 immune checkpoints profiles in the high- and low-risk groups. KEGG, Kyoto Encyclopedia of Genes and Genomes; GO, Gene Ontology.
The clinical characteristics of the two groups were also further explored. As shown in Fig. S5A-L, there was no significant difference in age, gender, and stage between the two groups. However, the high-risk group was closely associated with the more advanced grade (Fig. S5M-P, P = 9.252e-06 in ICGC-AU2 cohort; P = 0.0624 in TCGA cohort; P = 0.0344 in ICGC-AU cohort; P = 0.0001 in GSE62452 cohort).
3.8. Immune landscape and immune checkpoint profiles of SDIS
Because SDIS was constructed based on immune genes, we consequently investigated whether there were differences in the infiltration abundance of 8 immune cell types (CD8 + T cell, NK cell, B cell, Macrophage, Myeloid dendritic cell (DC), Neutrophil, Endothelial cell and CAF) and 27 immune checkpoint molecules (ICMs) expression between the two groups. The results displayed that in addition to superior macrophage and CAF infiltration, the high-risk group also exhibited higher ICMs expression, including CD274, CD276, PDCD1LG2, CD40, CD70, TNFRSF9, HAVCR2, LAG3 and NT5E (Figs. 6E, Fig. S6A, D). Immunophenoscore (IPS) and tumor mutation burden (TMB), as important indicators of measuring overall immunogenicity, had been widely applied in tumor research [17], [23]. Compared with the low-risk group, the high-risk group displayed a significantly higher IPS (P = 0.0042, Fig. S6B). TMB also showed a corresponding trend, but the difference did not reach statistical significance (P = 0.32, Fig. S6C). Furthermore, we performed Spearman correlation analysis with risk score as a continuous variable, and the results indicated that SDIS score was strongly correlated with the above evaluation indexes (Fig. S6E).
3.9. Chemotherapy and immunotherapy evaluation
Given the patients in the high-risk group occurred mutations and CNVs at classical sites such as TP53, KRAS, CDKN2A and MYC, we hypothesized that they may be more sensitive to chemotherapy. Using the “pRRophetic” package, we observed that several common chemotherapeutic drugs such as gemcitabine, paclitaxel, and cisplatin as well as TP53 activator JNJ.26854165 and CDK Inhibitor CGP.60474 had lower IC50 values in the high-risk group, indicating more sensitivity to chemotherapy (Fig. 7A–E). In addition, previous analyses demonstrated that patients in the high-risk group possessed higher immunogenicity and ICMs expression, suggesting that they were more likely to benefit from immunotherapy. Based on the Tumour Immune Dysfunction and Exclusion (TIDE) web tool, the high-risk group had a significantly greater response rate to immunotherapy (Fig. 7F). The analysis results of the Submap algorithm also displayed that the expression profile of the high-risk group was more similar to those of patients who responded to immunotherapy (Fig. 7G).
Fig. 7.

Efficacy evaluation of chemotherapy and immunotherapy in the high- and low-risk groups patients. (A-E) The estimated IC50 of several common drugs such as gemcitabine (A), paclitaxel (B), cisplatin (C), JNJ.26854165 (D) and CGP.60474 (E) in the high- and low-risk groups. (F) The TIDE tool was used to predict the sensitivity of the two subtypes to immunotherapy in TCGA cohorts. (G) Submap analysis of the two subtypes and 47 pretreated patients with comprehensive immunotherapy annotations in TCGA cohort. For Submap analysis, a smaller p-value implied a more similarity of paired expression profiles. (H-J) Kaplan-Meier survival analysis of high SDIS and low SDIS groups (H), the ROC curve of SDIS for predicting 1- and 2-year OS (I), and ROC curve of SDIS for predicting immunotherapy response (J) in GSE91061 cohort. IC50, half-maximal inhibitory concentration; TIDE, Tumour Immune Dysfunction and Exclusion; SDIS, SMAD4-driven immune signature.
In addition, we recruited an immunotherapy cohort (GSE91061) containing 39 melanoma patients with complete clinical and prognostic information [22]. Kaplan-Meier analysis exhibited that OS was significantly shorter in the high-risk group (P = 0.013, Fig. 7H). The results of ROC curve displayed that the AUC of SDIS in predicting 1-, 2-year OS of patients receiving immunotherapy reached 0.830 and 0.721, respectively (Fig. 7I). Due to the lack of biomarkers that can accurately predict the efficacy of immunotherapy, many sensitive patients have missed the opportunity of immunotherapy, or insensitive patients have serious adverse events or even death after receiving immunotherapy [24]. Surprisingly, SDIS achieved an AUC of 0.763 for prediction of response to immunotherapy in GSE91061 cohort (Fig. 7J). These results strongly suggest that SDIS can be used to evaluate the prognosis of patients and response to chemotherapy and immunotherapy, and also has certain practical significance for individualized treatment and stratified management of cancer patients in cinical practice.
4. Discussion
PACA is a major challenge for clinicians because of its high malignancy, rapid progression, and lack of effective treatments [1], [2], [3]. TGF-β/SMAD4 biological process plays an irreplaceable role in TME remodeling and tumor development in PACA [7], [12]. Recent studies have confirmed deletion or mutation of SMAD4 occurred in 55% of PACA patients, and SMAD4 mutation could promote invasion, metastasis and poor prognosis by mediating tumor-stroma interaction and immune cell types infiltration [8], [9], [12]. In our report, based on SMAD4 mutation status and immune subtypes, we identified and validated a SDIS model, which was also an independent risk factor for PACA patients. Compared with the low-risk group, patients in the high-risk group had worse prognosis, higher frequency of classical locus mutations such as TP53, KRAS, and CDKN2A, superior infiltration abundance of immune cell types and ICMs expression, and showed functional characteristics related to immunity and cell cycle. In addition, further analysis exhibited that the PACA patients in the high-risk group was more sensitive to chemotherapy and immunotherapy, and SDIS also showed excellent predictive performance in the immunotherapy cohort. Therefore, in the precision-therapy era, SDIS has the potential to be a reliable biomarker for stratified management and individualized treatment of PACA patients.
In recent years, the immune landscape and immunotherapy in PACA have been increasingly investigated, and several prognostic signatures based on immune/stromal scores or immune gene expression have also been constructed and validated [3], [5], [6], [25], [26], [27]. However, current studies have focused solely on the transcriptome RNA expression, and little attention has been placed on genomic information that plays a decisive role in PACA initiation and progression [8], [9]. In this study, we took into account the SMAD4 mutation status that plays a crucial role in PACA development and TME remodeling and obtained 2279 SMAD4-driven DEGs by differential analysis. Unlike previous studies, we first calculated the infiltration fractions of 28 immune cell types for each PACA sample in TCGA cohort by the single sample gene set enrichment analysis (ssGSEA). Second, based on the infiltration fractions of immune cell types, we determined two immune subtypes by consensus clustering. Finally, the WGCNA algorithm was applied to obtain a black module containing 1446 immune genes, which had the highest correlation with the immune subtypes. Compared with searching for immune genes directly from the database, our method was more specific and applicable. The similar methods have also been implemented and validated in gastric and colorectal cancer [28], [29].
Overfitting was one of the critical issues in machine learning to develop biomedical models, and many models perform well in the training set, but perform poorly in the other cohorts [30]. Since SDIS contains fewer elements, this 7-gene SDIS has a small tendency to overfit, which still showed satisfactory predictive effect in the five external validation cohorts. Consistent with the results of the training set, Kaplan-Meier analysis revealed that the high-risk group of the five external validation cohorts had significantly shorter OS and RFS, and multivariate Cox regression also demonstrated that SDIS was an independent risk factor for OS and RFS. Due to the 5-year survival rate of PACA was <10%, we evaluated the predictive power of SDIS for 1-, 2-, and 3-year OS using ROC curve and AUC [2]. The results displayed the AUCs of SDIS for 1-, 2-, and 3-year OS reached 0.638, 0.603 and 0.684 in TCGA cohort; 0.745, 0.774 and 0.730 in ICGC-AU cohort; 0.633, 0.680 and 0.696 in ICGC-CA cohort; 0.679, 0.846 and 0.883 in GSE62452 cohort; 0.688, 0.661 and 0.738 in GSE85916 cohort, respectively. In summary, these findings suggest that SDIS could accurately predict the prognosis of PACA patients.
After stratifying PACA patients into the two groups, we observed no significant difference between the two groups in age, gender, and stage. This was also consistent with the present multivariate Cox analysis results, suggesting that SDIS was not significantly associated with several important clinical traits that may affect the prognosis of PACA patients, which avoids the affliction of multicollinearity to some extent. Next, GSEA analysis was employed to identify the potential molecular mechanisms in the two groups. As expected, the high-risk group was significantly enriched in immunity and cell cycle-related pathways, corresponding to more sensitive CDK inhibitors and immunotherapy efficacy. On the other hand, the low-risk group was significantly enriched in metabolic and digestion-related functional pathways, suggesting that we could target tumor metabolism to develop specific drugs for the low-risk group patients.
Furthermore, to depict the molecular profiles of the two groups, we also investigated the distinct genomic alterations between the two groups. The mutation frequency of the two main tumor suppressor genes TP53 and CDKN2A was higher in the high-risk group patients, which partly explained their higher sensitivity to TP53 activator JNJ.26854165 and CDK inhibitor CGP.60474. CNVs analysis revealed that lncRNAs play a major role in the high frequency amplification and deletion of the two groups, many studies have verified that lncRNAs play an indispensable role in tumorigenesis, progression, metastasis and resistance in PACA [31]. In addition, molecular studies have confirmed that mutation or deletion of SMAD4 is correlated with the invasive phenotype and worse prognosis in PACA [7], [8], [9]. Recent reports have also shown that ablation of SMAD4 reverses the immunosuppressive microenvironment of PACA and enhances sensitivity to immunotherapy by increasing the infiltration of T cells [12]. Notably, the frequency of SMAD4 deletion reached 20.5% in the high-risk group and only 5.8% in the low-risk group, which was consistent with the worse prognosis, relatively active TME, and more sensitive immunotherapy efficacy in the high-risk group.
To evade immune surveillance and antitumor immune response, immunoediting could establish the immunosuppressive activity of tumors by various mechanisms, including increasing the abundance of immunosuppressive cells (TAMs, Tregs, etc.) and the expression levels of ICMs, as well as reducing the immunogenicity of tumors [17], [32]. ICIs targeting ICMs offered promise for the treatment of PACA patients, we then explored the differences in immune landscape and immunotherapy efficacy between the high- and low-risk groups [5], [6]. As expected, patients in the high-risk group owned higher infiltration of immunosuppressive cells such as CAFs and molecular expression of ICMs (CD274, CD276, PDCD1LG2, CD70, TNFRSF9, HAVCR2, LAG3, NT5E). These results indicated that patients in the high-risk group have a strong inhibitory TME, which further resulting in immune escape or immune tolerance, and poorer prognosis. In addition, TMB and IPS analysis also verified that patients in the high-risk group had superior immunogenicity. These findings suggest that patients in the high-risk group are more likely to benefit from immunotherapy. We further applied TIDE and Submap tools to explore the potential significance of SDIS in predicting immunotherapy, and the results showed that patients in the high-risk group had a greater response rate. In addition, in GSE91061 immunotherapy cohort, SDIS could also accurately predict response to immunotherapy (AUC = 0.763) and patient OS (AUC = 0.830 in 1-year OS and 0.721 in 2-year OS). Overall, SDIS is a promising biomarker to select patients with “immune-hot” for further immunotherapy.
The vast majority of existing prognosis models were obtained based on transcriptome RNA expression data and ignored the genomic information that plays a decisive role in PACA initiation and progression, which to some extent also leads to insufficient repeatability and robustness for widespread use [8], [9]. Stratified management of patients with precision medicine as the core concept is the hope of substantially improving survival and life quality, but this requires us to find PACA biomarkers with high sensitivity, stability, and simplicity. In the present study, we developed SDIS based on SMAD4 mutation status and immune subtypes of PACA. SDIS accurately predicted the outcome of PACA patients in both the training and external validation cohorts. Further analysis also indicated that the high-risk group had more immunosuppressive cells infiltration, higher ICMs expression, and better chemotherapy and immunotherapy efficacy. On the other hand, the low-risk group was significantly enriched in metabolism pathways and showed the potential to target tumor metabolism to develop specific drugs. Our work provided a reliable tool for the stratified management and individualized treatment of PACA in clinical practice.
Patient stratification has become a valuable tool for cancer patients to receive individualized treatment and long-range management, which can provide accurate diagnostic and prognostic information and guide clinical decision-making. Espiau-Romera P et al. systematically summarized many published molecular and metabolic subtypes of PACA [33]. Among them, the most popular is the Moffitt subtype, which stratifies PACA patients into two subtypes: classical and basal [34]. In addition, the Purity Independent Subtyping of Tumors (PurIST) developed by Rashid NU et al. is a robust classifier with highly reproducible performance across various platforms and sample types [35]. These classifiers have some clinical significance, but molecular subtypes can only simply classify PACA samples into several subtypes by sequencing, which restricts its clinical practical value. Instead of, our SDIS focuses on prognostic models, and after obtaining the expression level of a 7-gene panel through kit or PCR, the risk score of a specific individual can be calculated according to the formula, which is easier for clinical translation and promotion.
Our research provided new insights into the treatment of PACA, but there were still some certain limitations. First, we extensively collected six cohorts from TCGA, ICGC, and GEO public databases, but these data were all from predominantly white western countries and lacked information on yellow and black cohorts. Second, although we applied algorithms to evaluate functional characteristics and sensitivity to chemotherapy and immunotherapy in the two groups, prospective clinical trials and follow-up data are needed. In addition, among the seven genes contained in SDIS, NDRG2 has been shown to be involved in tumor biological processes such as PI3K/Akt, apoptosis and autophagy [36]. IL33 also plays an integral role in tumor development and immune responses [37]. However, because these genes have shown great clinical predictive in tumors and few existing studies have been reported, the role and related mechanism of these genes in tumors need more studies in the future.
5. Conclusion
In conclusion, based on SMAD4 mutation status and immune subtypes of PACA, we constructed and validated a 7-gene signature termed: SDIS. In six independent cohorts, SDIS not only accurately predicted prognosis of PACA patients, but also was an independent risk factor for them. The high-risk group was significantly enriched in immunity and cell cycle-related pathways, had more immunosuppressive cells infiltration, higher ICMs expression, and was also more sensitive to chemotherapy and immunotherapy. On the other hand, patients in the low-risk group were mainly enriched in metabolism-related pathways and have a relatively good prognosis, showing the clinical prospect of targeting tumor metabolism to develop specific drugs. Overall, the SDIS could robustly predict prognosis in PACA, which might serve as an attractive platform to further tailor decision-making in chemotherapy and immunotherapy in clinical settings.
Declaration of Competing Interest
The authors declare that they have no known competing financial interests or personal relationships that could have appeared to influence the work reported in this paper.
Acknowledgments
Acknowledgement
We thank the researchers who provided sequencing data as well as the workers who developed the R package.
Funding
This work was financially supported by the grant from the National Natural Science Foundation of China (No. 81870457, No. 82172944).
Ethics approval and consent to participate
Not applicable.
Footnotes
Supplementary data to this article can be found online at https://doi.org/10.1016/j.csbj.2022.02.031.
Contributor Information
Libo Wang, Email: 13273026498@163.com.
Zaoqu Liu, Email: liuzaoqu@163.com.
Xinwei Han, Email: fcchanxw@zzu.edu.cn.
Yuling Sun, Email: ylsun@zzu.edu.cn.
Appendix A. Supplementary data
The following are the Supplementary data to this article:
References
- 1.Siegel RL, Miller KD, Fuchs HE, Jemal A. Cancer Statistics, 2021. CA: A Cancer Journal For Clinicians 2021; 71(1): 7-33. https://doi.org/10.3322/caac.21654. [DOI] [PubMed]
- 2.Park W., Chawla A., O'Reilly E.M. Pancreatic cancer: a review. JAMA. 2021;326(9):851–862. doi: 10.1001/jama.2021.13027. [DOI] [PMC free article] [PubMed] [Google Scholar]
- 3.Mizrahi J.D., Surana R., Valle J.W., Shroff R.T. Pancreatic cancer. Lancet. 2020;395(10242):2008–2020. doi: 10.1016/S0140-6736(20)30974-0. [DOI] [PubMed] [Google Scholar]
- 4.Golan T., Hammel P., Reni M., Van Cutsem E., Macarulla T., Hall M.J., et al. Maintenance olaparib for germline -mutated metastatic pancreatic cancer. N Engl J Med. 2019;381(4):317–327. doi: 10.1056/NEJMoa1903387. [DOI] [PMC free article] [PubMed] [Google Scholar]
- 5.Bear A.S., Vonderheide R.H., O'Hara M.H. Challenges and opportunities for pancreatic cancer immunotherapy. Cancer Cell. 2020;38(6):788–802. doi: 10.1016/j.ccell.2020.08.004. [DOI] [PMC free article] [PubMed] [Google Scholar]
- 6.O'Hara M.H., O'Reilly E.M., Varadhachary G., Wolff R.A., Wainberg Z.A., Ko A.H., et al. CD40 agonistic monoclonal antibody APX005M (sotigalimab) and chemotherapy, with or without nivolumab, for the treatment of metastatic pancreatic adenocarcinoma: an open-label, multicentre, phase 1b study. Lancet Oncol. 2021;22(1):118–131. doi: 10.1016/S1470-2045(20)30532-5. [DOI] [PubMed] [Google Scholar]
- 7.Zhao M., Mishra L., Deng C.-X. The role of TGF-β/SMAD4 signaling in cancer. Int J Biol Sci. 2018;14(2):111–123. doi: 10.7150/ijbs.23230. [DOI] [PMC free article] [PubMed] [Google Scholar]
- 8.Blackford A., Serrano O.K., Wolfgang C.L., Parmigiani G., Jones S., Zhang X., et al. SMAD4 gene mutations are associated with poor prognosis in pancreatic cancer. Clin Cancer Res. 2009;15(14):4674–4679. doi: 10.1158/1078-0432.CCR-09-0227. [DOI] [PMC free article] [PubMed] [Google Scholar]
- 9.Wang F., Xia X., Yang C., Shen J., Mai J., Kim H.-C., et al. Gene mutation renders pancreatic cancer resistance to radiotherapy through promotion of autophagy. Clin Cancer Res. 2018;24(13):3176–3185. doi: 10.1158/1078-0432.CCR-17-3435. [DOI] [PMC free article] [PubMed] [Google Scholar]
- 10.Duda D.G., Sunamura M., Lefter L.P., Furukawa T., Yokoyama T., Yatsuoka T., et al. Restoration of SMAD4 by gene therapy reverses the invasive phenotype in pancreatic adenocarcinoma cells. Oncogene. 2003;22(44):6857–6864. doi: 10.1038/sj.onc.1206751. [DOI] [PubMed] [Google Scholar]
- 11.Qian Y., Gong Y., Fan Z., Luo G., Huang Q., Deng S., et al. Molecular alterations and targeted therapy in pancreatic ductal adenocarcinoma. J. Hematol. Oncol. 2020;13(1):130. doi: 10.1186/s13045-020-00958-3. [DOI] [PMC free article] [PubMed] [Google Scholar]
- 12.Li J., Yuan S., Norgard R.J., Yan F., Sun Y.H., Kim I.-K., et al. Epigenetic and transcriptional control of the epidermal growth factor receptor regulates the tumor immune microenvironment in pancreatic cancer. Cancer Discov. 2021;11(3):736–753. doi: 10.1158/2159-8290.CD-20-0519. [DOI] [PMC free article] [PubMed] [Google Scholar]
- 13.Liu Z., Wang L., Guo C., Liu L., Jiao D., Sun Z., et al. TTN/OBSCN 'Double-Hit' predicts favourable prognosis, 'immune-hot' subtype and potentially better immunotherapeutic efficacy in colorectal cancer. J Cell Mol Med. 2021;25(7):3239–3251. doi: 10.1111/jcmm.16393. [DOI] [PMC free article] [PubMed] [Google Scholar]
- 14.Wilkerson M.D., Hayes D.N. ConsensusClusterPlus: a class discovery tool with confidence assessments and item tracking. Bioinformatics. 2010;26(12):1572–1573. doi: 10.1093/bioinformatics/btq170. [DOI] [PMC free article] [PubMed] [Google Scholar]
- 15.Langfelder P, Horvath S. WGCNA: an R package for weighted correlation network analysis. BMC Bioinformatics 2008; 9(559. https://doi.org/10.1186/1471-2105-9-559. [DOI] [PMC free article] [PubMed]
- 16.Liu Z., Lu T., Li J., Wang L., Xu K., Dang Q., et al. Clinical significance and inflammatory landscape of anovel recurrence-associated immune signature in stage II/III colorectal cancer. Front Immunol. 2021;12:702594. doi: 10.3389/fimmu.2021.702594. [DOI] [PMC free article] [PubMed] [Google Scholar]
- 17.Charoentong P., Finotello F., Angelova M., Mayer C., Efremova M., Rieder D., et al. Pan-cancer immunogenomic analyses reveal genotype-immunophenotype relationships and predictors of response to checkpoint blockade. Cell Rep. 2017;18(1):248–262. doi: 10.1016/j.celrep.2016.12.019. [DOI] [PubMed] [Google Scholar]
- 18.Jiang P., Gu S., Pan D., Fu J., Sahu A., Hu X., et al. Signatures of T cell dysfunction and exclusion predict cancer immunotherapy response. Nat Med. 2018;24(10):1550–1558. doi: 10.1038/s41591-018-0136-1. [DOI] [PMC free article] [PubMed] [Google Scholar]
- 19.Liu Z., Wang L., Liu L., Lu T., Jiao D., Sun Y., et al. The identification and validation of two heterogenous subtypes and a risk signature based on ferroptosis in hepatocellular carcinoma. Front Oncol. 2021;11:619242. doi: 10.3389/fonc.2021.619242. [DOI] [PMC free article] [PubMed] [Google Scholar]
- 20.Hoshida Y., Brunet J.-P., Tamayo P., Golub T.R., Mesirov J.P. Subclass mapping: identifying common subtypes in independent disease data sets. PLoS ONE. 2007;2(11) doi: 10.1371/journal.pone.0001195. [DOI] [PMC free article] [PubMed] [Google Scholar]
- 21.Liu Z., Liu L., Lu T., Wang L., Li Z., Jiao D., et al. Hypoxia molecular characterization in hepatocellular carcinoma identifies one risk signature and two nomograms for clinical management. J Oncol. 2021;2021:6664386. doi: 10.1155/2021/6664386. [DOI] [PMC free article] [PubMed] [Google Scholar]
- 22.Riaz N., Havel J.J., Makarov V., Desrichard A., Urba W.J., Sims J.S., et al. Tumor and microenvironment evolution during immunotherapy with nivolumab. Cell. 2017;171(4) doi: 10.1016/j.cell.2017.09.028. [DOI] [PMC free article] [PubMed] [Google Scholar]
- 23.Liu Z., Zhang Y., Shi C., Zhou X., Xu K., Jiao D., et al. A novel immune classification reveals distinct immune escape mechanism and genomic alterations: implications for immunotherapy in hepatocellular carcinoma. J Transl Med. 2021;19(1):5. doi: 10.1186/s12967-020-02697-y. [DOI] [PMC free article] [PubMed] [Google Scholar]
- 24.Hommes J.W., Verheijden R.J., Suijkerbuijk K.P.M., Hamann D. Biomarkers of checkpoint inhibitor induced immune-related adverse events-a comprehensive review. Front Oncol. 2020;10:585311. doi: 10.3389/fonc.2020.585311. [DOI] [PMC free article] [PubMed] [Google Scholar]
- 25.Chen S., Huang F., Chen S., Chen Y., Li J., Li Y., et al. Bioinformatics-based identification of tumor microenvironment-related prognostic genes in pancreatic cancer. Front Genet. 2021;12:632803. doi: 10.3389/fgene.2021.632803. [DOI] [PMC free article] [PubMed] [Google Scholar]
- 26.Qian H., Li H., Xie J., Lu X., Li F., Wang W., et al. Immunity-related gene signature identifies subtypes benefitting from adjuvant chemotherapy or potentially responding to PD1/PD-L1 blockage in pancreatic cancer. Front Cell Dev Biol. 2021;9:682261. doi: 10.3389/fcell.2021.682261. [DOI] [PMC free article] [PubMed] [Google Scholar]
- 27.Liu Z., Lu T., Li J., Wang L., Xu K., Dang Q., et al. Development and clinical validation of a novel six-gene signature for accurately predicting the recurrence risk of patients with stage II/III colorectal cancer. Cancer Cell Int. 2021;21(1):359. doi: 10.1186/s12935-021-02070-z. [DOI] [PMC free article] [PubMed] [Google Scholar]
- 28.Zeng D., Li M., Zhou R., Zhang J., Sun H., Shi M., et al. Tumor Microenvironment characterization in gastric cancer identifies prognostic and immunotherapeutically relevant gene signatures. Cancer Immunol Res. 2019;7(5):737–750. doi: 10.1158/2326-6066.CIR-18-0436. [DOI] [PubMed] [Google Scholar]
- 29.Zhao X., Liu J., Liu S., Yang F., Chen E. Construction and validation of an immune-related prognostic model based on TP53 status in colorectal cancer. Cancers (Basel) 2019;11(11) doi: 10.3390/cancers11111722. [DOI] [PMC free article] [PubMed] [Google Scholar]
- 30.Deo R.C. Machine learning in medicine. Circulation. 2015;132(20):1920–1930. doi: 10.1161/CIRCULATIONAHA.115.001593. [DOI] [PMC free article] [PubMed] [Google Scholar]
- 31.Sempere L.F., Powell K., Rana J., Brock A.A., Schmittgen T.D. Role of non-coding RNAs in tumor progression and metastasis in pancreatic cancer. Cancer Metastasis Rev. 2021 doi: 10.1007/s10555-021-09995-x. [DOI] [PMC free article] [PubMed] [Google Scholar]
- 32.Pardoll D.M. The blockade of immune checkpoints in cancer immunotherapy. Nat Rev Cancer. 2012;12(4):252–264. doi: 10.1038/nrc3239. [DOI] [PMC free article] [PubMed] [Google Scholar]
- 33.Espiau-Romera P., Courtois S., Parejo-Alonso B., Sancho P. Molecular and metabolic subtypes correspondence for pancreatic ductal adenocarcinoma classification. J Clin Med. 2020;9(12):4128. doi: 10.3390/jcm9124128. [DOI] [PMC free article] [PubMed] [Google Scholar]
- 34.Moffitt R.A., Marayati R., Flate E.L., Volmar K.E., Loeza S.G.H., Hoadley K.A., et al. Virtual microdissection identifies distinct tumor- and stroma-specific subtypes of pancreatic ductal adenocarcinoma. Nat Genet. 2015;47(10):1168–1178. doi: 10.1038/ng.3398. [DOI] [PMC free article] [PubMed] [Google Scholar]
- 35.Rashid N.U., Peng X.L., Jin C., Moffitt R.A., Volmar K.E., Belt B.A., et al. Purity independent subtyping of tumors (PurIST), A clinically robust, single-sample classifier for tumor subtyping in pancreatic cancer. Clin Cancer Res. 2020;26(1):82–92. doi: 10.1158/1078-0432.CCR-19-1467. [DOI] [PMC free article] [PubMed] [Google Scholar]
- 36.Wei M., Ma Y., Shen L., Xu Y., Liu L., Bu X., et al. NDRG2 regulates adherens junction integrity to restrict colitis and tumourigenesis. EBioMedicine. 2020;61(1) doi: 10.1016/j.ebiom.2020.103068. [DOI] [PMC free article] [PubMed] [Google Scholar]
- 37.Eissmann M.F., Buchert M., Ernst M. IL33 and mast cells-the key regulators of immune responses in gastrointestinal cancers? Front Immunol. 2020;11(1):1389. doi: 10.3389/fimmu.2020.01389. [DOI] [PMC free article] [PubMed] [Google Scholar]
Associated Data
This section collects any data citations, data availability statements, or supplementary materials included in this article.