

Abstract
Circular RNAs are a class of highly conserved RNAs with stable covalently closed circular structures. Metabolic reprogramming of cancer cells reshapes the tumor microenvironment and can suppress antitumor immunity. Here, we discovered a novel circular RNA, termed circRHBDD1, which augments aerobic glycolysis and restricts anti-PD-1 therapy in hepatocellular carcinoma (HCC). Mechanistic studies revealed that circRHBDD1 recruits the m6A reader YTHDF1 to PIK3R1 mRNA and accelerates the translation of PIK3R1 in an m6A-dependent manner. EIF4A3-mediated exon back-splicing contributes to the upregulation of circRHBDD1. Moreover, circRHBDD1 is highly expressed in anti-PD-1 responder HCC patients, and targeting circRHBDD1 improves anti-PD-1 therapy in an immune-competent mouse model. Overall, these findings illustrate the metabolic importance of the circRHBDD1/YTHDF1/PIK3R1 axis in HCC and show that suppression of circRHBDD1 may bolster the efficacy of anti-PD-1 therapy for HCC treatment.
Keywords: circular RNA, hepatocellular carcinoma, YTHDF1, PIK3R1, glycolysis
Graphical abstract
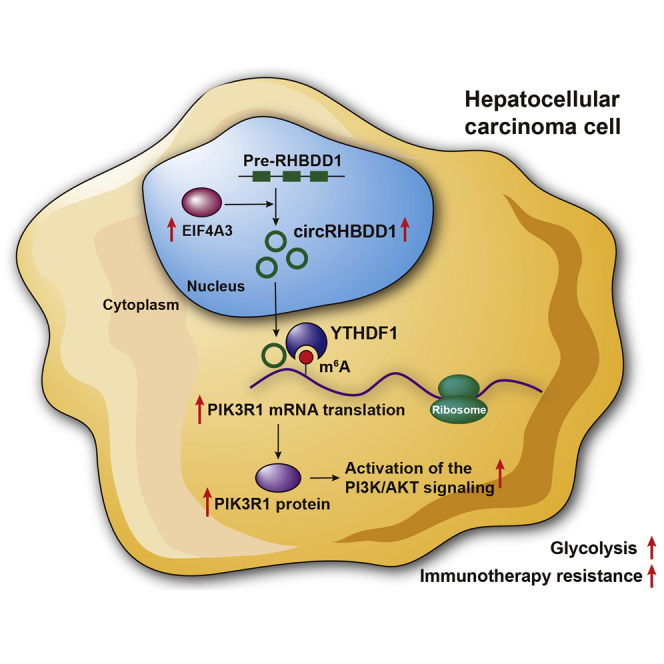
Metabolic reprogramming of cancer cells reshapes the tumor microenvironment and can suppress antitumor immunity. Cai et al. show that circRHBDD1 recruits YTHDF1 to PIK3R1 mRNA and augments PIK3R1 translation in an m6A-dependent manner, thereby promoting glycolysis and restricting anti-PD-1 therapy in hepatocellular carcinoma.
Introduction
Hepatocellular carcinoma (HCC) ranks sixth in terms of incidence and is the third leading cause of cancer-related death worldwide.1 Despite the progress made in HCC treatment, the 5-year survival rate remains dismal. Immunotherapy with immune checkpoint inhibitors has revolutionized the therapeutic modalities for HCC.2 Anti-PD-1 treatment can overcome T cell anergy and activate the antitumor immune response. Although durable responses have been witnessed in a subset of patients, the overall response rate of PD-1 blockade is relatively low.3
As hallmarks of cancer, evading immune destruction and the reprogramming of energy metabolism are closely intertwined.4 Cancer cells tend to convert glucose to lactate through accelerated aerobic glycolysis instead of completing oxidation through the tricarboxylic acid cycle.5 This phenomenon, also known as the Warburg effect, satisfies the increasing demands for the energy of cancer cells.6 Metabolic rewiring occurring in cancer cells alters the tumor microenvironment through nutrient competition and the accumulation of immunosuppressive metabolites, which can subvert immune cell function and thwart the antitumor immunity.7 Importantly, cancer cells outcompete T cells for glucose, contributing to the restricted response to anti-PD-1 therapy.8 Accordingly, targeting tumor glycolysis might be a promising strategy to overcome resistance to anti-PD-1 therapy in HCC.
Circular RNAs (circRNAs) are a class of covalent closed RNA transcripts generated from the back-splicing of pre-mRNA. CircRNAs are abundant, stable, evolutionarily conserved, and present spatiotemporally specific expression patterns. As indispensable regulators in various physiological and pathological processes, circRNAs function through diverse mechanisms, including interacting with RNA-binding proteins, acting as microRNA sponges, regulating gene transcription, and translating into peptides.9 Accumulating evidence has cast light on the association of circRNAs with metabolic reprogramming of cancer cells.10, 11, 12 Recent studies also indicated the involvement of circRNAs in antitumor immunity.13,14 Thus, investigating the potential immunomodulatory effects of glycolysis-associated circRNAs in HCC is worthwhile.
Here, we discovered a novel circRNA, termed circRHBDD1, and demonstrated that EIF4A3-induced upregulation of circRHBDD1 facilitated reprogramming of glucose metabolism in HCC. In vivo experiments with patient-derived xenograft (PDX) mouse models confirmed the tumor-promoting effects of circRHBDD1. Mechanistically, circRHBDD1 recruited the m6A reader YTHDF1 to PIK3R1 mRNA and accelerated PIK3R1 translation via m6A modification, allowing activation of the phosphatidylinositol 3-kinase (PI3K)/AKT signaling pathway. Moreover, targeting circRHBDD1 in cancer cells could enhance the response to anti-PD-1 therapy. This study reveals a novel circRNA that augments HCC glycolysis and may support the concept of combining glycolysis inhibitors with immunotherapy.
Results
CircRHBDD1 is highly expressed in HCC and predicts unfavorable survival
We compared the circRNA expression profiles between three paired HCC tissues and adjacent liver tissues using circRNA sequencing. A total of 7,747 distinct circRNA candidates with ≥2 unique back-splicing junction reads were detected by both CIRI2 and CIRCexplorer2 algorithms. Of these, 5,010 were annotated in circBase. The DESeq2 package was further applied to identify the differentially expressed circRNAs. As illustrated in Figures 1A and 1B, 44 and 65 circRNAs were upregulated and downregulated in HCC tissues, respectively. Among them, the top five upregulated circRNAs were validated by qRT-PCR in 20 matched HCC and peritumor tissues that were randomly chosen from cohort 1 (Figure 1C). We found that hsa_circ_0058497, which was derived from the RHBDD1 gene locus and hereafter referred to as circRHBDD1, exhibited the most prominent upregulation, and was selected for further study. These data from cohort 1 further confirmed the upregulation of circRHBDD1 in the RNA-sequencing results (fold change = 11.57). Consistent with the results from tissue samples, the expression level of circRHBDD1 was significantly higher in HCC cell lines than in the normal human liver cell line (Figure 1D).
Figure 1.

CircRHBDD1 is highly expressed in HCC
(A) Cluster heatmap showing the differentially expressed circRNAs in paired human HCC tissues and peritumor tissues (n = 3). (B) Volcano plot showing circRNAs that changed significantly between HCC tissues and matched peritumor tissues. (C) Expression levels of the five most upregulated circRNAs were validated by qRT-PCR in 20 matched HCC and peritumor tissues from cohort 1. (D) Expression levels of circRHBDD1 in seven human HCC cell lines along with the normal human liver cell line QSG-7701. (E) Structure and back-splicing site of circRHBDD1. (F) CircRHBDD1 and GAPDH were amplified from cDNA or gDNA from HCCLM3 cells with divergent and convergent primers, respectively. (G) CircRHBDD1 and GAPDH were amplified from cDNA or gDNA from HepG2 cells with divergent and convergent primers, respectively. (H) qRT-PCR assays for circRHBDD1 and RHBDD1 mRNA using the template cDNA reverse transcribed by random primers and oligo(dT) primers in HCCLM3 and HepG2 cells. (I) qRT-PCR analysis for the expression of circRHBDD1 and RHBDD1 mRNA in HCCLM3 and HepG2 cells treated with RNase R. (J) qRT-PCR assays for the expression of circRHBDD1 and RHBDD1 mRNA in HCCLM3 cells treated with the transcription inhibitor actinomycin D at the indicated time points. (K) qRT-PCR assays for the expression of circRHBDD1 and RHBDD1 mRNA in HepG2 cells treated with the transcription inhibitor actinomycin D at the indicated time points. (L) FISH detection of circRHBDD1 in HCCLM3 cells. (M) Abundance of circRHBDD1 from separated nuclear and cytoplasmic fractions was determined by qRT-PCR in HCCLM3 cells. (N) Abundance of circRHBDD1 from separated nuclear and cytoplasmic fractions was determined by qRT-PCR in HepG2 cells. ∗p < 0.05; ∗∗p < 0.01; ∗∗∗p < 0.001; ns, no significance.
Divergent PCR followed by Sanger sequencing analysis revealed that circRHBDD1 was generated from exons 6–8 of the RHBDD1 gene through a back-splicing mechanism (Figure 1E). Agarose gel electrophoresis assays showed that divergent primers could amplify circRHBDD1 in cDNA, but no product was detected in genomic DNA (gDNA) (Figures 1F and 1G). qRT-PCR using oligo(dT) primers indicated that circRHBDD1 possessed no poly(A) tail (Figure 1H). CircRHBDD1 resisted RNase R-mediated digestion (Figure 1I) and was more stable than its linear counterpart (Figures 1J and 1K). Fluorescence in situ hybridization (FISH) and fractionation experiments demonstrated that circRHBDD1 was mainly located in the cytoplasm rather than the nucleus (Figures 1L–1N).
To further investigate the clinical value of circRHBDD1 in HCC, we examined the expression of circRHBDD1 in cohort 1, consisting of 96 paired HCC and peritumor specimens. qRT-PCR confirmed that circRHBDD1 was highly expressed in HCC tissues compared with peritumor samples (Figure 2A). FISH analysis further verified the overexpression of circRHBDD1 in HCC tissues (Figure 2B). The patients from cohort 1 were divided into high and low circRHBDD1 expression groups according to the median expression value. As shown in Table S1, the circRHBDD1 expression level was associated with tumor number (p = 0.013), microvascular invasion (p = 0.002), tumor size (p = 0.007), α-fetoprotein (p = 0.014), and tumor-node-metastasis (TNM) stage (p = 0.001). Marked upregulation of circRHBDD1 was witnessed in HCC patients with tumor size >5 cm and in those at TNM stage III–IV (Figures 2C and 2D). To determine the prognostic role of circRHBDD1 in HCC patient survival, we performed univariate and multivariate survival analyses on independent cohort 2 comprising 160 HCC patients (Figures 2E–2H and Table S2). Kaplan-Meier survival plots showed that high circRHBDD1 expression was correlated with poor overall survival and disease-free survival. Cox proportional hazards regression analyses indicated that circRHBDD1 level was an independent prognostic factor for overall survival (hazard ratio [HR] 1.549, 95% confidence interval [CI] 1.046–2.293; p = 0.029) and disease-free survival (HR 2.388, 95% CI 1.417–4.024; p = 0.001). Taken together, these results suggested that circRHBDD1 was upregulated in HCC tissues and cell lines, and high circRHBDD1 expression predicted unfavorable survival outcomes.
Figure 2.

CircRHBDD1 predicts unfavorable patient survival in HCC
(A) Expression levels of circRHBDD1 in 96 paired HCC and peritumor tissues from cohort 1 were determined by qRT-PCR (p < 0.001). (B) FISH detection of circRHBDD1 in ten matched HCC and peritumor tissues from cohort 1. (C) Expression levels of circRHBDD1 were compared between patients with tumor size ≤5 cm and those with tumor size >5 cm. (D) CircRHBDD1 expression levels were detected between the TNM stage I–II group and the TNM stage III–IV group. (E) Kaplan-Meier analysis of the correlation between circRHBDD1 expression levels and overall survival (p < 0.001). (F) Multivariate analyses of the independent predictive factors for overall survival. Hazard ratios (HR) and the corresponding 95% confidence intervals (CI) are shown. (G) Kaplan-Meier analysis of the association of circRHBDD1 expression levels with disease-free survival (p < 0.001). (H) Multivariate analyses of the independent predictive factors for disease-free survival. HRs with the corresponding 95% CIs are shown. ∗∗∗p < 0.001.
CircRHBDD1 promotes HCC glycolysis in vitro and in vivo
To explore the functions of circRHBDD1 in HCC, we sought to characterize the altered cellular phenotypes in HCC cells with circRHBDD1 knockdown or overexpression. Two lentiviruses targeting the back-spliced sequence of circRHBDD1 were designed, and sh-circRHBDD1#1 and sh-circRHBDD1#2 remarkably inhibited the expression of circRHBDD1 but not that of RHBDD1 mRNA (Figures 3A and 3B). A significant reduction in cell proliferation in HCCLM3 and MHCC97H cells after circRHBDD1 knockdown was detected by colony-formation assay (Figure 3C). Cell Counting Kit-8 (CCK-8) assays showed that silencing circRHBDD1 remarkably suppressed HCC cell viability (Figures 3D and 3E). 5-Ethynyl-2′-deoxyuridine (EdU) imaging analysis confirmed the inhibitory effects of circRHBDD1 knockdown on HCC cells (Figure 3F). In contrast, overexpression of circRHBDD1 significantly enhanced the proliferative capabilities of HepG2 and Huh7 cells (Figures S1A–S1E).
Figure 3.

Knockdown of circRHBDD1 inhibits HCC viability in vitro
(A) qRT-PCR analysis of circRHBDD1 and RHBDD1 mRNA in HCCLM3 cells after the transfection of two shRNAs targeting the back-spliced sequence of circRHBDD1. (B) qRT-PCR analysis of circRHBDD1 and RHBDD1 mRNA in MHCC97H cells after the transfection of sh-circRHBDD1#1 and sh-circRHBDD1#2. (C) Proliferation ability was evaluated by colony-formation assay (representative wells are presented) in circRHBDD1-silenced HCCLM3 and MHCC97H cells. (D) Proliferation of HCCLM3 cells after circRHBDD1 silencing was detected by CCK-8 assay. (E) Proliferation of circRHBDD1-silenced MHCC97H cells was examined using CCK-8 assay. (F) EdU assays were conducted to assess the proliferative ability of HCCLM3 and MHCC97H cells with circRHBDD1 knockdown. ∗p < 0.05; ∗∗p < 0.01; ∗∗∗p < 0.001; ns, no significance.
Next, we performed RNA-sequencing analysis on circRHBDD1-silenced HCCLM3 cells and the corresponding control cells (Figure 4A). Pathway enrichment analysis indicated a potential role of circRHBDD1 in glucose metabolic reprogramming (Figure 4B). As a critical step limiting intracellular glucose availability, glucose transmembrane transport is mainly mediated by glucose transporter 1 (GLUT1) in cancer cells. Hexokinase 2 (HK2) subsequently converts intracellular glucose to glucose-6-phosphate (G6P) and facilitates aerobic glycolysis.15,16 CircRHBDD1 knockdown was associated with the decreased mRNA and protein levels of GLUT1 and HK2 in HCCLM3 and MHCC97H cells (Figures 4C, 4D, S2A, and S2B). Knockdown of circRHBDD1 significantly reduced the glycolysis rate and glycolysis capacity, as indicated by the extracellular acidification rate (ECAR) data (Figures 4E and S2C). The oxygen consumption rate (OCR), an indicator of mitochondrial respiration, was increased in circRHBDD1-silenced cells (Figures 4F and S2D). CircRHBDD1 knockdown led to decreased levels of G6P, lactate, and ATP (Figures 4G and S2E). Consistently, glycolysis was enhanced upon circRHBDD1 overexpression in HepG2 and Huh7 cells (Figures S3A–S3E). In 22 HCC patients from cohort 1 who received preoperative [18F]fluorodeoxyglucose PET/CT imaging, we found that the maximum standardized uptake value (SUVmax) was considerably higher in patients from the circRHBDD1high group than in those from the circRHBDD1low group (Figures 4H and 4I).
Figure 4.

CircRHBDD1 knockdown suppresses glycolysis in HCCLM3 cells
(A) Heatmap showing the differentially expressed genes upon circRHBDD1 knockdown in HCCLM3 cells (n = 3). (B) Pathway enrichment analysis showing the top canonical pathways after circRHBDD1 knockdown. (C) Levels of GLUT1 and HK2 mRNA in HCCLM3 cells with circRHBDD1 knockdown. (D) Levels of GLUT1 and HK2 proteins in circRHBDD1-silenced HCCLM3 cells. (E) ECAR data showed that silencing circRHBDD1 significantly reduced the rate of glycolysis and the glycolysis capacity in HCCLM3 cells. (F) OCR results showed that circRHBDD1-silenced HCCLM3 cells displayed increased basal respiration and maximum respiration. (G) Cellular G6P level, lactate production, and cellular ATP level were detected in HCCLM3 cells with circRHBDD1 knockdown. (H) FISH was used to determine the expression of circRHBDD1, and representative 18F-FDG PET/CT imaging of HCC patients from cohort 1 with high or low circRHBDD1 expression is shown. (I) Analysis of SUVmax in the circRHBDDhigh and circRHBDDlow groups (n = 22). ∗p < 0.05; ∗∗p < 0.01; ∗∗∗p < 0.001.
We utilized PDX mouse models to investigate the effects of circRHBDD1 on HCC growth using ten fresh HCC tissues from patients undergoing hepatectomy (Figure 5A). CircRHBDD1 expression levels were detected in the engrafted tumors using qRT-PCR. Xenografts derived from patient #5 had the highest expression level of circRHBDD1 while the engrafted tumors originating from patient #2 exhibited the lowest circRHBDD1 level (Figure 5B). The engrafted tumors from patients #5 and #2 were histopathologically analyzed (Figure 5C). We injected the circRHBDD1 plasmid and cholesterol-conjugated circRHBDD1 small interfering RNA (siRNA) into tumor tissues for 3 weeks. The xenograft tumor volume and weight were markedly reduced in the si-circRHBDD1-treated groups. Conversely, the xenografts injected with the circRHBDD1 plasmid were larger and heavier (Figures 5D–5F). qRT-PCR and FISH assays were used to confirm the consistent knockdown or overexpression of circRHBDD1 in engrafted HCC tumors (Figures 5G and 5H). As indicated in Figure 5I, we found decreased expression levels of GLUT1 and Ki-67 in circRHBDD1-silenced xenografts, but elevated levels were observed in xenografts treated with circRHBDD1 plasmid based on the immunohistochemistry (IHC) results.
Figure 5.

CircRHBDD1 facilitates HCC tumor growth in vivo
(A) Graphic illustration of the establishment of HCC PDX mouse models. (B) Expression levels of circRHBDD1 were detected in the xenografts isolated from mice of PDX using qRT-PCR. The engrafted tumors derived from patient #5 had the highest expression level of circRHBDD1, whereas the xenografts originating from patient #2 exhibited the lowest circRHBDD1 level. (C) The engrafted tumors from patient #5 and patient #2 were histopathologically analyzed. (D) Photographs of the engrafted tumors from PDX mice treated with circRHBDD1 plasmid or cholesterol-conjugated circRHBDD1 siRNA. (E) Tumor volume was measured in the engrafted tumors. (F) Tumor weight was recorded in the engrafted tumors. (G) Expression levels of circRHBDD1 were detected in the engrafted tumors by qRT-PCR. (H) FISH images showing the expression levels of circRHBDD1 in the engrafted tumors. (I) Expression levels of GLUT1 and Ki-67 in the tumor tissues of PDX were analyzed using immunohistochemistry. ∗p < 0.05; ∗∗p < 0.01; ∗∗∗p < 0.001.
CircRHBDD1 activates PI3K/AKT signaling by augmenting PIK3R1 translation
In the aforementioned pathway enrichment results (Figure 4B), PI3K/AKT signaling was found to be among the top canonical pathways. We wondered whether circRHBDD1 could affect the PI3K/AKT pathway. Western blotting analysis verified that circRHBDD1 knockdown suppressed the activation of PI3K/AKT signaling (Figure 6A). Previous studies by our group and others revealed that PIK3R1, a regulatory subunit of PI3K, is an important upstream molecule of PI3K/AKT signaling during HCC progression.17, 18, 19 As shown in Figure 6B, PIK3R1 protein levels were decreased after circRHBDD1 was silenced. IHC analysis of PDX confirmed that circRHBDD1 knockdown was associated with decreased PIK3R1 and p-AKT levels, while PIK3R1 and p-AKT levels were elevated in circRHBDD1-overexpressing xenografted tumors (Figure 6C). Intriguingly, the level of PIK3R1 mRNA was not significantly altered in circRHBDD1-silenced cells compared with controls (Figure 6D). There was no apparent difference in the degradation rate of PIK3R1 protein after circRHBDD1 knockdown (Figures 6E and 6F). Moreover, the proteasome inhibitor MG132 and autophagy inhibitor chloroquine (CQ) could not reverse the downregulation of PIK3R1 protein induced by circRHBDD1 knockdown (Figure 6G), suggesting that circRHBDD1 knockdown-induced PIK3R1 protein downregulation did not occur through the proteasome and lysosomal protein degradation pathways. Based on these results, we hypothesized that circRHBDD1 augmented PIK3R1 protein expression, possibly via translational control. Therefore, we collected mono-/polysome fractions from cytoplasmic extracts of sh-circRHBDD1#1 and sh-NC HCCLM3 cells by sucrose gradient centrifugation. As indicated in Figure 6H, circRHBDD1 knockdown significantly suppressed the proportion of PIK3R1 mRNA in the polysome fraction, whereas the presence of PIK3R1 mRNA in non-translating ribosome fractions was increased.
Figure 6.

CircRHBDD1 activates PI3K/AKT signaling by augmenting YTHDF1-mediated translation of PIK3R1
(A) Western blotting analysis showing the expression levels of p-PI3K, PI3K, p-AKT, and AKT in circRHBDD1-silenced HCCLM3 and MHCC97H cells. (B) Expression levels of PIK3R1 in circRHBDD1-silenced HCCLM3 and MHCC97H cells were determined by western blotting. (C) Expression levels of PIK3R1 and p-AKT in the tumor tissues of PDX were analyzed using immunohistochemistry. (D) PIK3R1 mRNA levels were detected by qRT-PCR in circRHBDD1-silenced HCCLM3 and MHCC97H cells. (E) The effects of circRHBDD1 knockdown on the degradation rate of PIK3R1 protein in HCCLM3 cells pretreated with cycloheximide (CHX) were analyzed by western blotting. (F) Quantitative analysis of (E). (G) The effects of MG132 and chloroquine (CQ) on circRHBDD1 knockdown-induced PIK3R1 downregulation were determined by western blotting. (H) The amount of PIK3R1 mRNA in various polysome fractions was analyzed by qRT-PCR. (I) An AGO2-RIP assay was performed to detect the levels of circRHBDD1 in the AGO2 IP pellet. (J) Results from the CPAT database indicating the absence of coding potential for circRHBDD1. (K) Mass spectrometry analysis was conducted to determine the proteins that could bind to circRHBDD1. YTHDF1 was revealed as a potential circRHBDD1-interacting protein. (L) RNA pull-down assays followed by western blotting for YTHDF1 in HCCLM3 cells. (M) The interaction between YTHDF1 and circRHBDD1 was verified by RIP assays. (N) FISH for circRHBDD1 and immunofluorescence for YTHDF1 in HCCLM3 cells. The profiles of colocalization are also provided. (O) TCGA data suggested that the expression level of YTHDF1 was upregulated in HCC tissues compared with peritumoral tissues (p < 0.05). (P) YTHDF1 was associated with unfavorable overall survival in HCC patients based on the TCGA data (hazard ratio = 1.8). ∗∗∗p < 0.001; ns, no significance.
We performed rescue experiments by overexpressing PIK3R1 in circRHBDD1-silenced HCCLM3 cells. The overexpression efficiency was confirmed by western blotting and qRT-PCR (Figures S4A and S4B). CCK-8 and EdU assays demonstrated that PIK3R1 upregulation rescued the inhibited cell proliferation in sh-circRHBDD1#1 HCCLM3 cells (Figures S4C and S4D). The glycolysis rate, glycolysis capacity, basal respiration, and maximum respiration were restored after PIK3R1 overexpression in circRHBDD1-silenced HCCLM3 cells (Figures S5A and S5B). In circRHBDD1-silenced cells, upregulation of PIK3R1 abolished the reduction in the levels of glycolysis metabolites (Figure S5C). The expression levels of p-AKT, GLUT1, and HK2 were restored after PIK3R1 upregulation in circRHBDD1-silenced cells (Figure S5D).
To confirm that circRHBDD1 affected HCC progression through PI3K/AKT signaling, we performed rescue experiments in circRHBDD1-overexpressing HepG2 cells using the PI3K/AKT pathway inhibitor LY294002 (Figure S6A). Treatment with LY294002 rescued the enhanced cell proliferation in circRHBDD1-overexpressing HepG2 cells (Figures S6B and S6C). LY294002 restored the glycolysis rate, glycolysis capacity, basal respiration, maximum respiration, G6P, lactate, and ATP levels in circRHBDD1-overexpressing cells (Figures S6D–S6F). These results revealed that circRHBDD1 promoted HCC proliferation and glycolysis via PI3K/AKT signaling.
CircRHBDD1 interacts with YTHDF1 and accelerates the translation of PIK3R1 in an m6A-dependent manner
To delineate how circRHBDD1 facilitated the translation of PIK3R1 mRNA, we performed an AGO2-RNA immunoprecipitation (RIP) assay, whose results suggested that circRHBDD1 might not function as a microRNA sponge (Figure 6I). Coding-Potential Assessment Tool (CPAT) bioinformatics prediction results indicated that circRHBDD1 could not encode peptides (Figure 6J). RNA pull-down assays combined with mass spectrometry suggested YTHDF1 as a potential circRHBDD1-interacting protein (Figure 6K), and western blotting confirmed that circRHBDD1 could pull down YTHDF1 (Figure 6L). RIP assays further confirmed the interaction between YTHDF1 and circRHBDD1 (Figure 6M). FISH results showed that circRHBDD1 colocalized with YTHDF1 in HCCLM3 cells (Figure 6N). Bioinformatics analysis indicated that YTHDF1 was upregulated in HCC tissues compared with peritumoral tissues (Figure 6O) and was associated with unfavorable overall survival in HCC (Figure 6P), consistent with previous studies.20,21
Given that YTHDF1 has been well established as an m6A-binding protein that facilitates translation of m6A-modified mRNA,22,23 we postulated that YTHDF1 could enhance PIK3R1 translation via m6A modification. The results from the REPIC database suggested the presence of two m6A peaks in PIK3R1.24 RMVar and RMBase v2.0 databases also confirmed the presence of RRACH m6A sequence motifs in PIK3R1.25,26 Consistently, crosslinking immunoprecipitation (CLIP) and RIP data from the m6A2Target database identified PIK3R1 mRNA as a potential target of YTHDF1 (GEO: GSE78030 and GSE63591).27 Ectopic expression of YTHDF1 led to a remarkable increase in the protein expression and m6A level of PIK3R1 (Figures 7A–7C) while opposite results were observed in YTHDF1-silenced cells (Figures S7A–S7C). YTHDF1 overexpression did not affect the mRNA level of PIK3R1 (Figure 7D) but significantly elevated the presence of PIK3R1 mRNA in the polysome fraction (Figure 7E).
Figure 7.

YTHDF1 regulates PIK3R1 translation in an m6A-dependent manner
(A) The overexpression efficiency of YTHDF1 was validated by qRT-PCR in HepG2 and Huh7 cells. (B) Western blotting assays showing the protein levels of YTHDF1 and PIK3R1 in YTHDF1-overexpressing HepG2 and Huh7 cells. (C) meRIP-qPCR analysis showing the m6A level of PIK3R1 detected in YTHDF1-overexpressing HepG2 and Huh7 cells. (D) PIK3R1 mRNA levels of HepG2 cells with or without YTHDF1 overexpression were examined using qRT-PCR. (E) The amount of PIK3R1 mRNA in various polysome fractions was analyzed by qRT-PCR in HepG2 cells with or without YTHDF1 overexpression. (F) Schematic illustration of wild-type (YTHDF1-WT) and mutant (YTHDF1-Mut) YTHDF1 constructs. (G) Protein levels of PIK3R1 in HepG2 and Huh7 cells transfected with YTHDF1-WT or YTHDF1-Mut. (H) qRT-PCR analysis showing the levels of PIK3R1 mRNA in HepG2 and Huh7 cells transfected with YTHDF1-WT or YTHDF1-Mut. (I) PIK3R1-specific qPCR analysis of the co-precipitated RNAs by a FLAG antibody in RIP analysis. (J) The two m6A peaks among PIK3R1 mRNA. (K) The two m6A peaks among PIK3R1 mRNA were confirmed by meRIP-qPCR in HCCLM3 cells. (L) Protein level of PIK3R1 in HCCLM3 cells co-transfected with empty vector, wild-type, or mutant FLAG-tagged YTHDF1 and wild-type or mutant HA-tagged PIK3R1. ∗∗∗p < 0.001; ns, no significance.
To elucidate whether YTHDF1-mediated PIK3R1 upregulation was dependent on m6A modification, we generated a FLAG-tagged mutant YTHDF1 construct (YTHDF1-Mut) with two point mutations (K395A and Y397A) to abrogate its m6A-binding ability (Figure 7F), as previously reported.28,29 After YTHDF1 wild-type (YTHDF1-WT) and YTHDF1-Mut recombination plasmids were successfully transfected into HepG2 and Huh7 cells, we found that the elevated protein expression of PIK3R1 in YTHDF1-WT cells was abolished in YTHDF1-Mut transfected HCC cells (Figure 7G). However, the PIK3R1 mRNA levels were comparable between YTHDF1-WT and YTHDF1-Mut (Figure 7H). Ectopic expression of YTHDF1-Mut dramatically hindered the interaction between PIK3R1 mRNA and YTHDF1 according to the RIP results (Figure 7I). Based on a liver cell dataset from the Gene Expression Omnibus database (GEO: GSE122744), two m6A peaks among PIK3R1 mRNA were observed, with Peak1 in the 5′ UTR and Peak2 in the 3′ UTR of PIK3R1 (Figure 7J). We performed methylated RIP (meRIP)-qPCR and confirmed these two m6A peaks among PIK3R1 mRNA in HCCLM3 cells (Figure 7K). Furthermore, overexpression of YTHDF1-WT led to increased PIK3R1 expression in PIK3R1-WT and PIK3R1-Peak1 MUT, while no response was observed in PIK3R1-Peak2 MUT and PIK3R1-Peak1&2 MUT (Figure 7L), suggesting that the m6A peak in the PIK3R1 3′ UTR was responsible for the modulation of YTHDF1. In addition, RIP assays using a YTHDF1 antibody revealed that circRHBDD1 overexpression increased the interaction between YTHDF1 and PIK3R1 mRNA (Figure S8A). Consistent with this result, the interaction between YTHDF1 and PIK3R1 mRNA was notably blunted by circRHBDD1 knockdown (Figure S8B). Collectively, the above data demonstrated that circRHBDD1 could function as a scaffold to strengthen the interaction between YTHDF1 and PIK3R1 mRNA and augment the translation of PIK3R1 mRNA in an m6A-dependent manner.
Moreover, we performed rescue experiments by knocking down YTHDF1 in circRHBDD1-overexpressing HepG2 cells. Western blotting results showed that YTHDF1 knockdown restored the elevated levels of PIK3R1 and p-AKT expression in circRHBDD1-overexpressing cells (Figure S9A). The expression of circRHBDD1 was not significantly affected after YTHDF1 knockdown (Figure S9B). No significant effect on PIK3R1 mRNA expression was observed in circRHBDD1-overexpressing HepG2 cells after YTHDF1 knockdown (Figure S9C). In addition, YTHDF1 knockdown in circRHBDD1-overexpressing HCC cells restored the increased capabilities of proliferation and glycolysis (Figures S9D–S9H).
To further validate the effects of the circRHBDD1/YTHDF1/PIK3R1 axis, we performed in vivo rescue experiments. As shown in Figures S10A–S10C, PIK3R1 overexpression in HCCLM3 sh-circRHBDD1#1 cells significantly reversed the inhibitory effects of circRHBDD1 knockdown on tumor volume and weight. In addition, the enhanced xenograft growth in the HepG2 circRHBDD1 overexpression group was counteracted by YTHDF1 knockdown (Figures S11A–S11C).
EIF4A3 promotes the expression of circRHBDD1
RNA-binding proteins can bind to the flanking intron sequences of circRNAs and mediate circRNA biogenesis.30 To investigate the upstream regulator of circRHBDD1 in HCC, we searched the CircInteractome database31 and found three EIF4A3 binding sites flanking circRHBDD1, referred to as sites a, b, and c (Figure 8A). The Cancer Genome Atlas (TCGA) data showed that EIF4A3 was upregulated in HCC and that high EIF4A3 expression was associated with poor overall survival (Figures 8B and 8C). Previous studies showed that EIF4A3, as a key component of the exon junction complex, promotes the expression of several circRNAs.32, 33, 34 The circRHBDD1 level was positively correlated with the expression level of EIF4A3 (Figure 8D). To elucidate the effect of EIF4A3 on circRHBDD1 expression, we knocked down EIF4A3 expression using two siRNAs in both HCCLM3 and MHCC97H cells (Figures 8E and 8F). The circRHBDD1 level was significantly decreased after EIF4A3 knockdown (Figure 8G). Similarly, overexpression of EIF4A3 led to an increase in circRHBDD1 expression levels in HepG2 and Huh7 cells (Figures 8H–8J). In contrast, the mRNA levels of EIF4A3 were not altered in circRHBDD1-silenced cells (Figure S12). As shown in Figure 8K, EIF4A3 could bind to the flanking sequences through two upstream putative binding sites (sites a and b) but not the downstream site (site c). Mutants of both sites a and b abolished the reduction in circRHBDD1 expression levels in EIF4A3-silenced cells (Figure 8L). These results demonstrated that EIF4A3 might induce the biogenesis of circRHBDD1 by binding to sites a and b.
Figure 8.

EIF4A3 promotes the expression of circRHBDD1
(A) The putative binding sites (sites a, b, and c) of EIF4A3 in the upstream and downstream regions of RHBDD1 pre-mRNA were predicted with the CircInteractome database. (B) TCGA data suggested that the expression level of EIF4A3 was upregulated in HCC tissues compared with peritumoral tissues (p < 0.05). (C) EIF4A3 was associated with unfavorable overall survival in HCC patients based on TCGA data (hazard ratio = 1.9). (D) Correlation analysis revealed that circRHBDD1 level was positively correlated with the expression level of EIF4A3 in HCC tissues from cohort 1 (p < 0.001, r = 0.502). (E) Knockdown efficiency of EIF4A3 siRNAs was validated by qRT-PCR in HCCLM3 and MHCC97H cells. (F) Western blotting assays verifying the knockdown efficiency of EIF4A3 in HCCLM3 and MHCC97H cells. (G) Expression levels of circRHBDD1 in HCCLM3 and MHCC97H cells with EIF4A3 knockdown. (H) The overexpression efficiency of EIF4A3 was validated by qRT-PCR in HepG2 and Huh7 cells. (I) Western blotting assays verifying the overexpression efficiency of EIF4A3 in HepG2 and Huh7 cells. (J) Expression levels of circRHBDD1 in EIF4A3-overexpressing HepG2 and Huh7 cells. (K) RIP assays confirmed that EIF4A3 could directly bind to the RHBDD1 pre-mRNA at sites a and b. (L) Mutants of both sites a and b restored the reduction in circRHBDD1 expression level in EIF4A3-silenced cells. ∗p < 0.05; ∗∗p < 0.01; ∗∗∗p < 0.001; ns, no significance.
CircRHBDD1 restricts anti-PD-1 therapy in HCC
Targeting cancer metabolism, and thus the associated reprogramming of the tumor microenvironment, can unleash antitumor immune responses. Inhibitors of cancer glycolysis can induce synergistic responses with immunotherapy.35 Given that circRHBDD1 could augment HCC glycolysis, we next evaluated whether circRHBDD1 inhibition could enhance the efficacy of anti-PD-1 therapy in HCC. We analyzed 18 HCC patients with recurrence or distant metastasis receiving anti-PD-1 therapy. Detailed information on the patients is presented in Table S3. After four cycles of anti-PD-1 treatment, the efficacy was assessed using CT or MRI. There were five patients with partial response and 13 patients with progressive disease, as defined by RECIST1.1. Patients were classified into the responder group (partial response) or the non-responder group (progressive disease) (Figure 9A).36,37 The expression level of circRHBDD1 in the non-responder group was much higher than that in the responder group (Figure 9B). Bioinformatics analysis showed that YTHDF1 was positively associated with immune cell infiltration and the expression levels of several immune-associated genes in liver cancer (Figures 9C and 9D). To further delineate the effects of circRHBDD1 on the efficacy of anti-PD-1 therapy, we established a xenograft model by subcutaneous implantation of circRHBDD1-silenced Hepa1–6 cells or control cells and subjected it to anti-PD-1 or immunoglobulin G (IgG) treatment (Figures 9E and S13). Treatment of immunocompetent mice harboring circRHBDD1-silenced tumors with anti-PD-1 significantly hindered tumor growth and improved overall survival (Figures 9F–9H). Immunofluorescence staining of CD8+ cells in tumor tissues showed similar results (Figure 9I).
Figure 9.

CircRHBDD1 restricts anti-PD-1 therapy in HCC
(A) Representative CT imaging of HCC patients treated with anti-PD-1 in the responder and non-responder groups. (B) Expression level of circRHBDD1 in the responder group and the non-responder group (n = 18). (C) YTHDF1 expression was positively correlated with infiltration levels of immune cells in liver cancer according to TIMER database by correlation analysis. (D) Pan-cancer analysis of the correlation between YTHDF1 and the expression levels of immune-associated genes. (E) Illustration of the treatment plan for C57BL/6 mice subcutaneously transplanted with circRHBDD1-silenced or control Hepa1-6 cells. (F) Tumor volume was measured in the engrafted tumors. (G) Tumor weight was recorded in the engrafted tumors. (H) Survival curves of mice transplanted with circRHBDD1 knockdown or control Hepa1-6 cells and treated with anti-PD1 or IgG. (I) Immunofluorescence staining of CD8 in tumor tissues extracted from engrafted tumors of CB57L/6 mice. ∗p < 0.05; ∗∗p < 0.01; ∗∗∗p < 0.001.
Discussion
Benefiting from the rapid development and application of high-throughput sequencing technology, emerging studies have identified abnormal expression patterns of circRNAs in human cancers. We used circRNA sequencing and identified a novel circRNA derived from exons 6–8 of the RHBDD1 gene that was highly expressed in HCC. Glucose metabolism is frequently hijacked by tumor cells to maintain viability, and circRNAs play an important role in this glycolytic switch.38 It is tempting to uncover novel circRNAs that participate in HCC glycolysis. Utilizing loss- and gain-of-function assays, we examined the effects of circRHBDD1 on ECAR, OCR, GLUT1, HK2, and several metabolites in glycolysis. In vitro results showed that circRHBDD1 was closely associated with augmented glycolysis in HCC. Moreover, we constructed PDX mouse models and verified the tumor-promoting effects of circRHBDD1 in vivo. PDX models recapitulate the principal morphologic and genetic features of the original tumors and represent powerful resources for evaluating the in vivo effect of novel therapeutic strategies.39
The PI3K/AKT signaling pathway orchestrates multiple metabolic processes in cancer and plays a crucial role in the regulation of glucose metabolism. As a regulatory subunit of PI3K, PIK3R1 activates PI3K/AKT signaling to accelerate glycolysis.40 In breast cancer, miR-155-mediated PIK3R1 upregulation positively modulates glucose metabolism through the FOXO3a/cMYC axis.41 Here, our results demonstrated that circRHBDD1 activated PI3K/AKT signaling through PIK3R1. Upregulation of circRHBDD1 led to elevated protein levels of PIK3R1. No statistically significant change in PIK3R1 mRNA, however, was observed upon circRHBDD1 overexpression or knockdown. Treatment with MG132 or CQ could not reverse the decreased PIK3R1 protein levels in circRHBDD1-silenced HCC cells, indicating that circRHBDD1 might not affect the degradation of PIK3R1 protein. We then performed polysome profiling analysis and revealed that circRHBDD1 facilitated the translation of PIK3R1.
To elucidate how circRHBDD1 regulated the translation of PIK3R1, we performed an RNA pull-down assay followed by mass spectrometry, whereby YTHDF1 was demonstrated to interact with circRHBDD1. As the most abundant post-transcriptional mRNA modification, m6A is involved in numerous biological processes. Dynamic and reversible m6A modification is installed by m6A methyltransferases (writers), recognized by m6A-binding proteins (readers), and removed by demethylases (erasers). m6A participates in almost every aspect of the RNA life cycle, including mRNA translation, splicing, and stabilization.42 As an m6A reader protein, YTHDF1 recognizes m6A sites and promotes targeted mRNA translation.43 Reportedly, YTHDF1 augments EIF3C translation in an m6A-dependent manner, thereby facilitating ovarian cancer tumorigenesis and metastasis.23 Recruitment of YTHDF1 to m6A-modified TRIM29 participates in the translation of TRIM29 in cisplatin-resistant ovarian cancer cells.44 The translation of FZD7 is controlled by YTHDF1 in gastric carcinogenesis.29 In the present study, we combined multiple bioinformatics databases and meRIP assays and found that YTHDF1 promoted PIK3R1 mRNA translation in an m6A-dependent manner. Functional deletion of the YTH domain blocks the m6A-binding capability of YTHDF1. We found that YTHDF1-Mut interrupted the interaction between PIK3R1 mRNA and YTHDF1 and abolished the increased expression levels of PIK3R1 protein in cancer cells. In addition to YTHDF1 identified by pull-down assay, other proteins may also interact with circRHBDD1 and be involved in circRHBDD1-induced metabolic reprogramming in ways yet to be uncovered. The involvement of m6A writers and erasers in the interaction between YTHDF1 and PIK3R1 still needs further investigation.
RNA-binding proteins have been proposed to function as trans factors in the regulation of circRNA biogenesis. Reportedly, Quaking could enhance circRNA formation by binding to the introns flanking circRNA-forming exons and bring the circularized exons closer together. Splicing factors, including EIF4A3, FUS, HNRNPL, RBM20, and Mbl, have been found to modulate circRNA generation in different biological settings.45 In silico analysis indicated several binding sites of EIF4A3 in the flanking sequence of circRHBDD1. Further experiments confirmed that EIF4A3 could bind to the upstream region of the RHBDD1 pre-mRNA transcript and regulate the expression of circRHBDD1. EIF4A3-mediated exon back-splicing could be responsible for the upregulation of circRHBDD1 in HCC.
An impressive clinical benefit has been observed in a fraction of HCC patients treated with anti-PD-1 therapy.46,47 However, limited response to anti-PD-1 therapy in most patients remains a major challenge.48 Recent single-cell sequencing studies have supported the intricate interactions between HCC cells and the tumor microenvironment.49,50 Cancer cell metabolic reprogramming can reshape the landscape of the tumor microenvironment.51 The glycolytic activity of cancer cells promotes the secretion of lactate and acidification of the tumor milieu, which compromises the antitumor immune response of T and natural killer cells.52 Reportedly, aerobic glycolytic activity in human tumors is negatively associated with the efficacy of immunotherapy.53 In this study, we demonstrated that the combination of circRHBDD1 inhibition and anti-PD-1 treatment could achieve better antitumor efficacy. These results suggested that circRHBDD1 could be a potential therapeutic candidate, alone or in combination with immune checkpoint blockade, for HCC.
In summary, our findings indicated that circRHBDD1 expression was significantly elevated in HCC and promoted glycolysis in HCC cells. Mechanistically, circRHBDD1 interacted with YTHDF1 and augmented PIK3R1 translation in an m6A-dependent manner. EIF4A3 might induce the upregulation of circRHBDD1 in HCC. Furthermore, circRHBDD1 inhibition can synergize with anti-PD-1 therapy. Therefore, targeting the circRHBDD1/YTHDF1/PIK3R1 axis may hold promise for HCC therapeutic modalities.
Materials and methods
Patients and tissue samples
To determine circRHBDD1 expression, we enrolled two independent cohorts of HCC patients. For cohort 1, 96 paired HCC tissues and corresponding adjacent tissues were collected from patients who received a hepatectomy at the First Affiliated Hospital of Nanjing Medical University from 2017 to 2019. Cohort 2, used for survival analysis, consisted of 160 HCC patients undergoing a hepatectomy between 2010 and 2015 at the First Affiliated Hospital of Wannan Medical College. None of the included patients had received chemotherapy or radiotherapy before surgery. Written informed consent was obtained from all patients before enrollment. This study was conducted in accordance with the Declaration of Helsinki. The study protocol was approved by the Ethics Committee of the First Affiliated Hospital of Nanjing Medical University and the Ethics Committee of the First Affiliated Hospital of Wannan Medical College.
CircRNA sequencing
CircRNA sequencing using three paired HCC tissues and adjacent liver tissues was performed by RiboBio (Guangzhou, China). In brief, total RNA was extracted from HCC tissues and adjacent tissues using TRIzol reagent (Invitrogen, Carlsbad, CA, USA). RNA purity was assessed using an ND-1000 Nanodrop, and an Agilent 2200 TapeStation (Agilent Technologies, Santa Clara, CA, USA) was adopted to detect RNA integrity. An Epicentre Ribo-Zero rRNA Removal Kit (Illumina, San Diego, CA, USA) was employed for rRNA removal. RNase R (Epicentre Technologies, Madison, WI, USA) was used to degrade linear RNA. Adapter ligation and enrichment with a low cycle were performed according to the protocols of the NEBNext Ultra RNA Library Prep Kit for Illumina. The purified RNA was then used for cDNA synthesis and sequencing. CIRI2 and CIRCexplorer2 algorithms were adopted to determine circRNAs. Differentially expressed circRNAs (p < 0.05 and fold change >2) were identified based on the DESeq2 package.
RNA extraction, RNase R treatment, and qRT-PCR
Total RNA was extracted from tissues and cells using TRIzol reagent (Invitrogen). For RNase R treatment, 2 μg of total RNA was incubated with 3 U/μg of RNase R (Epicentre Technologies) for 15 min at 37°C. Reverse transcription was conducted using PrimeScript RT Master Mix (TaKaRa, Dalian, China). qPCR was performed using TB Green Premix Ex Taq (TaKaRa) on an ABI 7900HT (Applied Biosystems, Foster City, CA, USA). The primers for qRT-PCR used in this study are listed in Table S4.
FISH and immunofluorescence
Cells or tissues were fixed with 4% paraformaldehyde, permeabilized with 0.5% Triton X-100 in PBS, and incubated in hybridization buffer with circRHBDD1 probes overnight. 4′,6-Diamidino-2-phenylindole was used to stain the nuclei. All images were analyzed on a fluorescence microscope (Leica Microsystems, Mannheim, Germany). A specific FISH probe for circRHBDD1 was designed and synthesized by RiboBio.
For the immunofluorescence assay, cells or tissues were fixed in a 4% paraformaldehyde solution, permeabilized in PBS with 0.5% Triton X-100, blocked in 3% bovine serum albumin, and incubated with the primary antibody at 4°C overnight. Following incubation with the secondary antibody, the images were collected on a fluorescence microscope (Leica Microsystems).
Seahorse metabolic analysis
ECAR and OCR were measured using a Seahorse XF Glycolysis Stress Test Kit and Seahorse XF Cell Mito Stress Test Kit (Agilent Technologies) according to the manufacturer's protocols. In brief, 1 × 10⁴ cells/well were seeded into Seahorse XF 96-cell-culture plates and then loaded into the Seahorse XF 96 Extracellular Flux Analyzer (Agilent Technologies). For ECAR measurement, glucose, the oxidative phosphorylation inhibitor oligomycin, and the glycolytic inhibitor 2-deoxyglucose were sequentially added at the indicated time points. Oligomycin, the mitochondrial uncoupler carbonyl cyanide p-trifluoromethoxy phenylhydrazone, and the mitochondrial complex III inhibitor antimycin A plus the mitochondrial complex I inhibitor rotenone were sequentially injected for OCR detection.
Measurement of lactate production, G6P, and ATP levels
Cells were seeded into 96-well cell-culture plates and incubated overnight. After starvation for 2 h, the supernatant was harvested for measurement of lactate production using the L-lactate Assay Kit (Abcam, Cambridge, UK). The levels of cellular G6P were measured using a Glucose-6-phosphate Fluorometric Assay Kit (Cayman, Ann Arbor, MI, USA), and an ATP Determination Kit (Thermo Fisher Scientific, CA, USA) was used to determine ATP levels according to the manufacturer's instructions.
PDX mouse model
We used NOD/SCID and BALB/c mice to construct PDX models of HCC as previously described.54 In brief, primary tumor tissues from HCC patients undergoing hepatectomy were kept in ice-cold culture medium supplemented with 1% penicillin/streptomycin and cut into approximately 2–3 mm3 fragments in 100 μL of 50% Matrigel (BD Biosciences, San Jose, CA, USA). The tissue samples were then implanted subcutaneously into the flanks of NOD/SCID mice. Engrafted tumors were harvested when they grew to 1–2 cm3 and spliced for serial transplantation in BALB/c nude mice. When the engrafted tumor volume reached approximately 50 mm3, an intratumoral injection of 10 optical density circRHBDD1 plasmids, empty plasmids, cholesterol-conjugated circRHBDD1 siRNA, or negative control RNAi was performed every 3 days for 3 weeks. Tumor volume and weight were measured, and the tumors were processed for qRT-PCR, FISH, and IHC assays. Animal studies were approved by the Animal Welfare and Ethical Committee of Wannan Medical College.
RIP and meRIP assays
RIP assays were performed using a Magna RIP RNA-Binding Protein Immunoprecipitation Kit (EMD Millipore, Billarica, MA, USA) according to the manufacturer's instructions. In brief, cells were lysed using RIP lysis buffer containing protease and RNase inhibitors (EMD Millipore). The cell lysates were then incubated with antibodies against AGO2 (Abcam), EIF4A3 (Abcam), YTHDF1 (Cell Signaling Technology, Beverly, MA, USA), FLAG (Sigma-Aldrich), or nonspecific IgG antibody (EMD Millipore), respectively at 4°C overnight. The meRIP assay was conducted using a Magna MeRIP m6A Kit (EMD Millipore) based on the manufacturer's protocol. The immunoprecipitated RNA was isolated and subjected to qRT-PCR analysis.
RNA pull-down assay
The circRHBDD1 pull-down assay was performed using a Magnetic RNA-protein Pull-down Kit (Thermo Fisher Scientific) in accordance with the manufacturer's protocol. The biotin-labeled sense and antisense probes were designed and synthesized by RiboBio. In brief, total RNA was incubated with biotin-labeled probes for 5 min and streptavidin magnetic beads (Invitrogen) for 30 min with rotation. Unbound RNA was washed away, and RNA-protein binding buffer was added. The supernatant was obtained for silver staining, mass spectrometry, and western blotting.
Statistical analysis
Statistical analyses were performed using SPSS 26.0 (IBM, Armonk, NY, USA) and GraphPad Prism 8.0 (GraphPad Software, La Jolla, CA, USA) software. Data are shown as the mean ± standard error of mean. A two-sided Student's t test was used to analyze the differences between groups. A paired t test was used to evaluate the differences in circRNA expression levels between tumor and peritumor samples. The chi-squared test or Fisher's exact test was adopted to analyze the association of circRHBDD1 levels with clinicopathological variables. Survival distributions were estimated by Kaplan-Meier curves with the log-rank test. The prognostic value of circRHBDD1 was assessed using a Cox proportional hazards model. The correlation between EIF4A3 and circRHBDD1 levels was analyzed using Pearson's correlation coefficient. A two-tailed p < 0.05 was considered statistically significant: ∗p < 0.05; ∗∗p < 0.01; ∗∗∗p < 0.001; ns, no significance.
Additional experimental details are included in supplemental materials and methods.
Acknowledgments
This work was supported by the National Natural Science Foundation of China (no. 82002556, 82103293, and 82172651), the Natural Science Foundation of Jiangsu Province (no. BK20201083), the Natural Science Foundation of Anhui Province (no. 1908085QH332 and 2108085MH287), the Key Research and Development Project of Anhui Province (no. 202104j07020019), the Support Plan for Outstanding Young Talents of Anhui Education Department (no. gxyq2021257), the Funding of “Peak” Training Program for Scientific Research of Yijishan Hospital, Wannan Medical College (no. GF2019J08 and GF2019G17), and the Talent Introduction Science Foundation of Yijishan Hospital, Wannan Medical College (no. YR202109 and YR202110).
Author contributions
J.C., Z.C., and X.Z. conceived and designed the study. J.C., Z.C., and Y.Z. collected clinical samples. J.C., Z.C., J.W., and Z.Z. performed the experiments. J.C., Y.Z., J.M., and X.Z. analyzed the data. J.C. and Z.C. wrote the paper. J.M. and X.Z. revised the paper. All authors read and approved the final manuscript.
Declaration of interests
The authors declare no competing interests.
Footnotes
Supplemental information can be found online at https://doi.org/10.1016/j.omto.2022.02.021.
Contributor Information
Jiading Mao, Email: maojiading0205@sina.com.
Xueliang Zuo, Email: zuoxueliang0202@126.com.
Supplemental information
References
- 1.Sung H., Ferlay J., Siegel R.L., Laversanne M., Soerjomataram I., Jemal A., Bray F. Global cancer statistics 2020: GLOBOCAN estimates of incidence and mortality worldwide for 36 cancers in 185 countries. CA Cancer J. Clin. 2021;71:209–249. doi: 10.3322/caac.21660. [DOI] [PubMed] [Google Scholar]
- 2.Sangro B., Sarobe P., Hervás-Stubbs S., Melero I. Advances in immunotherapy for hepatocellular carcinoma. Nat. Rev. Gastroenterol. Hepatol. 2021;18:525–543. doi: 10.1038/s41575-021-00438-0. [DOI] [PMC free article] [PubMed] [Google Scholar]
- 3.Llovet J.M., Kelley R.K., Villanueva A., Singal A.G., Pikarsky E., Roayaie S., Lencioni R., Koike K., Zucman-Rossi J., Finn R.S. Hepatocellular carcinoma. Nat. Rev. Dis. Primers. 2021;7:6. doi: 10.1038/s41572-020-00240-3. [DOI] [PubMed] [Google Scholar]
- 4.Hanahan D., Weinberg R.A. Hallmarks of cancer: the next generation. Cell. 2011;144:646–674. doi: 10.1016/j.cell.2011.02.013. [DOI] [PubMed] [Google Scholar]
- 5.Thakur C., Chen F. Connections between metabolism and epigenetics in cancers. Semin. Cancer Biol. 2019;57:52–58. doi: 10.1016/j.semcancer.2019.06.006. [DOI] [PMC free article] [PubMed] [Google Scholar]
- 6.Icard P., Shulman S., Farhat D., Steyaert J.M., Alifano M., Lincet H. How the Warburg effect supports aggressiveness and drug resistance of cancer cells? Drug Resist. Updat. 2018;38:1–11. doi: 10.1016/j.drup.2018.03.001. [DOI] [PubMed] [Google Scholar]
- 7.Ramapriyan R., Caetano M.S., Barsoumian H.B., Mafra A.C.P., Zambalde E.P., Menon H., Tsouko E., Welsh J.W., Cortez M.A. Altered cancer metabolism in mechanisms of immunotherapy resistance. Pharmacol. Ther. 2019;195:162–171. doi: 10.1016/j.pharmthera.2018.11.004. [DOI] [PubMed] [Google Scholar]
- 8.Afonso J., Santos L.L., Longatto-Filho A., Baltazar F. Competitive glucose metabolism as a target to boost bladder cancer immunotherapy. Nat. Rev. Urol. 2020;17:77–106. doi: 10.1038/s41585-019-0263-6. [DOI] [PubMed] [Google Scholar]
- 9.Chen L.L. The expanding regulatory mechanisms and cellular functions of circular RNAs. Nat. Rev. Mol. Cell Biol. 2020;21:475–490. doi: 10.1038/s41580-020-0243-y. [DOI] [PubMed] [Google Scholar]
- 10.Li H., Yang F., Hu A., Wang X., Fang E., Chen Y., Li D., Song H., Wang J., Guo Y., et al. Therapeutic targeting of circ-CUX1/EWSR1/MAZ axis inhibits glycolysis and neuroblastoma progression. EMBO Mol. Med. 2019;11:e10835. doi: 10.15252/emmm.201910835. [DOI] [PMC free article] [PubMed] [Google Scholar]
- 11.Li Q., Wang Y., Wu S., Zhou Z., Ding X., Shi R., Thorne R.F., Zhang X.D., Hu W., Wu M. CircACC1 regulates assembly and activation of AMPK complex under metabolic stress. Cell Metab. 2019;30:157–173.e7. doi: 10.1016/j.cmet.2019.05.009. [DOI] [PubMed] [Google Scholar]
- 12.Liang Y., Wang H., Chen B., Mao Q., Xia W., Zhang T., Song X., Zhang Z., Xu L., Dong G., et al. circDCUN1D4 suppresses tumor metastasis and glycolysis in lung adenocarcinoma by stabilizing TXNIP expression. Mol. Ther. Nucleic Acids. 2021;23:355–368. doi: 10.1016/j.omtn.2020.11.012. [DOI] [PMC free article] [PubMed] [Google Scholar]
- 13.Huang X.Y., Zhang P.F., Wei C.Y., Peng R., Lu J.C., Gao C., Cai J.B., Yang X., Fan J., Ke A.W., et al. Circular RNA circMET drives immunosuppression and anti-PD1 therapy resistance in hepatocellular carcinoma via the miR-30-5p/snail/DPP4 axis. Mol. Cancer. 2020;19:92. doi: 10.1186/s12943-020-01213-6. [DOI] [PMC free article] [PubMed] [Google Scholar]
- 14.Li B., Zhu L., Lu C., Wang C., Wang H., Jin H., Ma X., Cheng Z., Yu C., Wang S., et al. circNDUFB2 inhibits non-small cell lung cancer progression via destabilizing IGF2BPs and activating anti-tumor immunity. Nat. Commun. 2021;12:295. doi: 10.1038/s41467-020-20527-z. [DOI] [PMC free article] [PubMed] [Google Scholar]
- 15.Boroughs L.K., DeBerardinis R.J. Metabolic pathways promoting cancer cell survival and growth. Nat. Cell Biol. 2015;17:351–359. doi: 10.1038/ncb3124. [DOI] [PMC free article] [PubMed] [Google Scholar]
- 16.Feng J., Li J., Wu L., Yu Q., Ji J., Wu J., Dai W., Guo C. Emerging roles and the regulation of aerobic glycolysis in hepatocellular carcinoma. J. Exp. Clin. Cancer Res. 2020;39:126. doi: 10.1186/s13046-020-01629-4. [DOI] [PMC free article] [PubMed] [Google Scholar]
- 17.Zuo X., Chen Z., Cai J., Gao W., Zhang Y., Han G., Pu L., Wu Z., You W., Qin J., et al. 5-hydroxytryptamine receptor 1D aggravates hepatocellular carcinoma progression through FoxO6 in AKT-dependent and independent manners. Hepatology. 2019;69:2031–2047. doi: 10.1002/hep.30430. [DOI] [PubMed] [Google Scholar]
- 18.He S., Zhang J., Zhang W., Chen F., Luo R. FOXA1 inhibits hepatocellular carcinoma progression by suppressing PIK3R1 expression in male patients. J. Exp. Clin. Cancer Res. 2017;36:175. doi: 10.1186/s13046-017-0646-6. [DOI] [PMC free article] [PubMed] [Google Scholar]
- 19.Chang R.M., Xiao S., Lei X., Yang H., Fang F., Yang L.Y. miRNA-487a promotes proliferation and metastasis in hepatocellular carcinoma. Clin. Cancer Res. 2017;23:2593–2604. doi: 10.1158/1078-0432.CCR-16-0851. [DOI] [PubMed] [Google Scholar]
- 20.Zhao Z., Yang L., Fang S., Zheng L., Wu F., Chen W., Song J., Chen M., Ji J. The effect of m6A methylation regulatory factors on the malignant progression and clinical prognosis of hepatocellular carcinoma. Front. Oncol. 2020;10:1435. doi: 10.3389/fonc.2020.01435. [DOI] [PMC free article] [PubMed] [Google Scholar]
- 21.Qu N., Qin S., Zhang X., Bo X., Liu Z., Tan C., Wen G., Jiang H. Multiple m(6)A RNA methylation modulators promote the malignant progression of hepatocellular carcinoma and affect its clinical prognosis. BMC Cancer. 2020;20:165. doi: 10.1186/s12885-020-6638-5. [DOI] [PMC free article] [PubMed] [Google Scholar]
- 22.Wang X., Zhao B.S., Roundtree I.A., Lu Z., Han D., Ma H., Weng X., Chen K., Shi H., He C. N(6)-methyladenosine modulates messenger RNA translation efficiency. Cell. 2015;161:1388–1399. doi: 10.1016/j.cell.2015.05.014. [DOI] [PMC free article] [PubMed] [Google Scholar]
- 23.Liu T., Wei Q., Jin J., Luo Q., Liu Y., Yang Y., Cheng C., Li L., Pi J., Si Y., et al. The m6A reader YTHDF1 promotes ovarian cancer progression via augmenting EIF3C translation. Nucleic Acids Res. 2020;48:3816–3831. doi: 10.1093/nar/gkaa048. [DOI] [PMC free article] [PubMed] [Google Scholar]
- 24.Liu S., Zhu A., He C., Chen M. REPIC: a database for exploring the N(6)-methyladenosine methylome. Genome Biol. 2020;21:100. doi: 10.1186/s13059-020-02012-4. [DOI] [PMC free article] [PubMed] [Google Scholar]
- 25.Luo X., Li H., Liang J., Zhao Q., Xie Y., Ren J., Zuo Z. RMVar: an updated database of functional variants involved in RNA modifications. Nucleic Acids Res. 2020;49:D1405–D1412. doi: 10.1093/nar/gkaa811. [DOI] [PMC free article] [PubMed] [Google Scholar]
- 26.Xuan J.J., Sun W.J., Lin P.H., Zhou K.R., Liu S., Zheng L.L., Qu L.H., Yang J.H. RMBase v2.0: deciphering the map of RNA modifications from epitranscriptome sequencing data. Nucleic Acids Res. 2018;46:D327–D334. doi: 10.1093/nar/gkx934. [DOI] [PMC free article] [PubMed] [Google Scholar]
- 27.Deng S., Zhang H., Zhu K., Li X., Ye Y., Li R., Liu X., Lin D., Zuo Z., Zheng J. M6A2Target: a comprehensive database for targets of m6A writers, erasers and readers. Brief Bioinform. 2020;22:bbaa055. doi: 10.1093/bib/bbaa055. [DOI] [PubMed] [Google Scholar]
- 28.Xu C., Liu K., Ahmed H., Loppnau P., Schapira M., Min J. Structural basis for the discriminative recognition of N6-methyladenosine RNA by the human YT521-B homology domain family of proteins. J. Biol. Chem. 2015;290:24902–24913. doi: 10.1074/jbc.M115.680389. [DOI] [PMC free article] [PubMed] [Google Scholar]
- 29.Pi J., Wang W., Ji M., Wang X., Wei X., Jin J., Liu T., Qiang J., Qi Z., Li F., et al. YTHDF1 promotes gastric carcinogenesis by controlling translation of FZD7. Cancer Res. 2020;81:2651–2665. doi: 10.1158/0008-5472.CAN-20-0066. [DOI] [PubMed] [Google Scholar]
- 30.Kristensen L.S., Andersen M.S., Stagsted L.V.W., Ebbesen K.K., Hansen T.B., Kjems J. The biogenesis, biology and characterization of circular RNAs. Nat. Rev. Genet. 2019;20:675–691. doi: 10.1038/s41576-019-0158-7. [DOI] [PubMed] [Google Scholar]
- 31.Dudekula D.B., Panda A.C., Grammatikakis I., De S., Abdelmohsen K., Gorospe M. CircInteractome: a web tool for exploring circular RNAs and their interacting proteins and microRNAs. RNA Biol. 2016;13:34–42. doi: 10.1080/15476286.2015.1128065. [DOI] [PMC free article] [PubMed] [Google Scholar]
- 32.Zheng X., Huang M., Xing L., Yang R., Wang X., Jiang R., Zhang L., Chen J. The circRNA circSEPT9 mediated by E2F1 and EIF4A3 facilitates the carcinogenesis and development of triple-negative breast cancer. Mol. Cancer. 2020;19:73. doi: 10.1186/s12943-020-01183-9. [DOI] [PMC free article] [PubMed] [Google Scholar]
- 33.Wei Y., Lu C., Zhou P., Zhao L., Lyu X., Yin J., Shi Z., You Y.P. EIF4A3-induced circular RNA ASAP1 promotes tumorigenesis and temozolomide resistance of glioblastoma via NRAS/MEK1/ERK1/2 signaling. Neuro Oncol. 2020;23:611–624. doi: 10.1093/neuonc/noaa214. [DOI] [PMC free article] [PubMed] [Google Scholar]
- 34.Wang R., Zhang S., Chen X., Li N., Li J., Jia R., Pan Y., Liang H. EIF4A3-induced circular RNA MMP9 (circMMP9) acts as a sponge of miR-124 and promotes glioblastoma multiforme cell tumorigenesis. Mol. Cancer. 2018;17:166. doi: 10.1186/s12943-018-0911-0. [DOI] [PMC free article] [PubMed] [Google Scholar]
- 35.Li X., Wenes M., Romero P., Huang S.C., Fendt S.M., Ho P.C. Navigating metabolic pathways to enhance antitumour immunity and immunotherapy. Nat. Rev. Clin. Oncol. 2019;16:425–441. doi: 10.1038/s41571-019-0203-7. [DOI] [PubMed] [Google Scholar]
- 36.Aslan K., Turco V., Blobner J., Sonner J.K., Liuzzi A.R., Núñez N.G., De Feo D., Kickingereder P., Fischer M., Green E., et al. Heterogeneity of response to immune checkpoint blockade in hypermutated experimental gliomas. Nat. Commun. 2020;11:931. doi: 10.1038/s41467-020-14642-0. [DOI] [PMC free article] [PubMed] [Google Scholar]
- 37.Terranova-Barberio M., Pawlowska N., Dhawan M., Moasser M., Chien A.J., Melisko M.E., Rugo H., Rahimi R., Deal T., Daud A., et al. Exhausted T cell signature predicts immunotherapy response in ER-positive breast cancer. Nat. Commun. 2020;11:3584. doi: 10.1038/s41467-020-17414-y. [DOI] [PMC free article] [PubMed] [Google Scholar]
- 38.Yu T., Wang Y., Fan Y., Fang N., Wang T., Xu T., Shu Y. CircRNAs in cancer metabolism: a review. J. Hematol. Oncol. 2019;12:90. doi: 10.1186/s13045-019-0776-8. [DOI] [PMC free article] [PubMed] [Google Scholar]
- 39.Invrea F., Rovito R., Torchiaro E., Petti C., Isella C., Medico E. Patient-derived xenografts (PDXs) as model systems for human cancer. Curr. Opin. Biotechnol. 2020;63:151–156. doi: 10.1016/j.copbio.2020.01.003. [DOI] [PubMed] [Google Scholar]
- 40.Lee J.H., Liu R., Li J., Wang Y., Tan L., Li X.J., Qian X., Zhang C., Xia Y., Xu D., et al. EGFR-phosphorylated platelet isoform of phosphofructokinase 1 promotes PI3K activation. Mol. Cell. 2018;70:197–210.e7. doi: 10.1016/j.molcel.2018.03.018. [DOI] [PMC free article] [PubMed] [Google Scholar]
- 41.Kim S., Lee E., Jung J., Lee J.W., Kim H.J., Kim J., Yoo H.J., Lee H.J., Chae S.Y., Jeon S.M., et al. microRNA-155 positively regulates glucose metabolism via PIK3R1-FOXO3a-cMYC axis in breast cancer. Oncogene. 2018;37:2982–2991. doi: 10.1038/s41388-018-0124-4. [DOI] [PMC free article] [PubMed] [Google Scholar]
- 42.Zaccara S., Ries R.J., Jaffrey S.R. Reading, writing and erasing mRNA methylation. Nat. Rev. Mol. Cell Biol. 2019;20:608–624. doi: 10.1038/s41580-019-0168-5. [DOI] [PubMed] [Google Scholar]
- 43.Lan Q., Liu P.Y., Haase J., Bell J.L., Hüttelmaier S., Liu T. The critical role of RNA m(6)A methylation in cancer. Cancer Res. 2019;79:1285–1292. doi: 10.1158/0008-5472.CAN-18-2965. [DOI] [PubMed] [Google Scholar]
- 44.Hao L., Wang J.M., Liu B.Q., Yan J., Li C., Jiang J.Y., Zhao F.Y., Qiao H.Y., Wang H.Q. m6A-YTHDF1-mediated TRIM29 upregulation facilitates the stem cell-like phenotype of cisplatin-resistant ovarian cancer cells. Biochim. Biophys. Acta Mol. Cell Res. 2020;1868:118878. doi: 10.1016/j.bbamcr.2020.118878. [DOI] [PubMed] [Google Scholar]
- 45.Li X., Yang L., Chen L.L. The biogenesis, functions, and challenges of circular RNAs. Mol. Cell. 2018;71:428–442. doi: 10.1016/j.molcel.2018.06.034. [DOI] [PubMed] [Google Scholar]
- 46.Zhang H., Dai Z., Wu W., Wang Z., Zhang N., Zhang L., Zeng W.J., Liu Z., Cheng Q. Regulatory mechanisms of immune checkpoints PD-L1 and CTLA-4 in cancer. J. Exp. Clin. Cancer Res. 2021;40:184. doi: 10.1186/s13046-021-01987-7. [DOI] [PMC free article] [PubMed] [Google Scholar]
- 47.Xu F., Jin T., Zhu Y., Dai C. Immune checkpoint therapy in liver cancer. J. Exp. Clin. Cancer Res. 2018;37:110. doi: 10.1186/s13046-018-0777-4. [DOI] [PMC free article] [PubMed] [Google Scholar]
- 48.Waidmann O. Recent developments with immunotherapy for hepatocellular carcinoma. Expert Opin. Biol. Ther. 2018;18:905–910. doi: 10.1080/14712598.2018.1499722. [DOI] [PubMed] [Google Scholar]
- 49.Sun Y., Wu L., Zhong Y., Zhou K., Hou Y., Wang Z., Zhang Z., Xie J., Wang C., Chen D., et al. Single-cell landscape of the ecosystem in early-relapse hepatocellular carcinoma. Cell. 2021;184:404–421. doi: 10.1016/j.cell.2020.11.041. [DOI] [PubMed] [Google Scholar]
- 50.Zhang Q., He Y., Luo N., Patel S.J., Han Y., Gao R., Modak M., Carotta S., Haslinger C., Kind D., et al. Landscape and dynamics of single immune cells in hepatocellular carcinoma. Cell. 2019;179:829–845.e20. doi: 10.1016/j.cell.2019.10.003. [DOI] [PubMed] [Google Scholar]
- 51.Dey P., Kimmelman A.C., DePinho R.A. Metabolic codependencies in the tumor microenvironment. Cancer Discov. 2021;11:1067–1081. doi: 10.1158/2159-8290.CD-20-1211. [DOI] [PMC free article] [PubMed] [Google Scholar]
- 52.Renner K., Bruss C., Schnell A., Koehl G., Becker H.M., Fante M., Menevse A.N., Kauer N., Blazquez R., Hacker L., et al. Restricting glycolysis preserves T cell effector functions and augments checkpoint therapy. Cell Rep. 2019;29:135–150.e9. doi: 10.1016/j.celrep.2019.08.068. [DOI] [PubMed] [Google Scholar]
- 53.Cascone T., McKenzie J.A., Mbofung R.M., Punt S., Wang Z., Xu C., Williams L.J., Wang Z., Bristow C.A., Carugo A., et al. Increased tumor glycolysis characterizes immune resistance to adoptive T cell therapy. Cell Metab. 2018;27:977–987.e4. doi: 10.1016/j.cmet.2018.02.024. [DOI] [PMC free article] [PubMed] [Google Scholar]
- 54.Zuo X., Chen Z., Gao W., Zhang Y., Wang J., Wang J., Cao M., Cai J., Wu J., Wang X. M6A-mediated upregulation of LINC00958 increases lipogenesis and acts as a nanotherapeutic target in hepatocellular carcinoma. J. Hematol. Oncol. 2020;13:5. doi: 10.1186/s13045-019-0839-x. [DOI] [PMC free article] [PubMed] [Google Scholar]
Associated Data
This section collects any data citations, data availability statements, or supplementary materials included in this article.