Abstract
Tandem mass spectrometry of denatured, multiply charged high mass protein precursor ions yield extremely dense spectra with hundreds of broad and overlapping product ion isotopic distributions of differing charge states that yield an elevated baseline of unresolved “noise” centered about the precursor ion. Development of mass analyzers and signal processing methods to increase mass resolving power and manipulation of precursor and product ion charge through solution additives or ion–ion reactions have been thoroughly explored as solutions to spectral congestion. Here, we demonstrate the utility of electron capture dissociation (ECD) coupled with high-resolution cyclic ion mobility spectrometry (cIMS) to greatly increase top-down protein characterization capabilities. Congestion of protein ECD spectra was reduced using cIMS of the ECD product ions and “mobility fractions”, that is, extracted mass spectra for segments of the 2D mobiligram (m/z versus drift time). For small proteins, such as ubiquitin (8.6 kDa), where mass resolving power was not the limiting factor for characterization, pre-IMS ECD and mobility fractions did not significantly increase protein sequence coverage, but an increase in the number of identified product ions was observed. However, a dramatic increase in performance, measured by protein sequence coverage, was observed for larger and more highly charged species, such as the +35 charge state of carbonic anhydrase (29 kDa). Pre-IMS ECD combined with mobility fractions yielded a 135% increase in the number of annotated isotope clusters and a 75% increase in unique product ions compared to processing without using the IMS dimension. These results yielded 89% sequence coverage for carbonic anhydrase.
The recent development and proliferation of high-resolution and accurate mass spectrometry (MS) platforms have led to significant advancements in the field of top-down mass spectrometry (TDMS). Fourier transform mass spectrometry, including Orbitrap and Fourier transform ion cyclotron resonance (FTICR), has dominated the landscape of top-down protein analysis in recent years. However, new hybrid time-of-flight (TOF) mass spectrometry platforms have greatly expanded capabilities.1−4 Additionally, the development of more effective tandem mass spectrometry (MS/MS) methods,5 such as electron capture dissociation (ECD),6,7 electron transfer dissociation (ETD),8 and ultraviolet photodissociation (UVPD),9 have made it possible to thoroughly characterize proteoforms10 by TDMS. The requirement for high mass resolving power and accuracy for intact protein analyses is in part a consequence of highly congested MS/MS spectra that contain many highly charged, broad, and overlapping product ion isotopic distributions.11 Traditionally, the challenge of handling highly congested mass spectra was addressed by further development of mass analyzers12−16 and signal processing methods17−20 to increase mass resolving power and accuracy. Alternatively, charge reduction of product ions, via ion–ion reactions, reduces spectral complexity by spreading ions over a larger m/z range, thus reducing spectral congestion.21−24 High-resolution ion mobility spectrometry (IMS) coupled with mass spectrometry (IMS-MS)25 offers another attractive approach in which the complexity of ion populations introduced to a mass analyzer can be reduced via gas-phase ion separations.
In general, separation in IMS is achieved through a balance in opposing forces produced by an electric field and drag due to collisions with buffer gas. Ions separate based on size, shape, and charge. Over the past decades, variations of IMS platforms have been developed, including drift tube IMS (DTIMS),26 traveling wave IMS (TWIMS),27 trapped IMS (TIMS),28 and field asymmetric IMS (FAIMS),29 that differ in the method for application of the electric field and buffer gas. The diffusion limited resolving power of both drift tube and traveling wave IMS separations is directly proportional to the square root of the path length, applied electric field, and ion charge and inversely proportional to buffer gas temperature. Efforts to continually increase IMS resolving power have led to the development of several unique DTIMS and TWIMS platforms that increase the path length without a significant increase to the instrument footprint. In 2006, Waters Corporation released the first commercial Q-IM-TOF platform, the SYNAPT HDMS, that enabled a high degree of experimental flexibility and utilized a traveling wave IMS device.30 Increasing the path length of TWIMS devices does not require the concomitant increase in applied electric field, contrasting with DTIMS, thereby eliminating many of the practical limitations for the development of long path length and closed-loop, multipass IMS devices.
Further development to improve IMS resolution in a compact, long path length IMS separation was introduced by Waters Corporation in the form of a cyclic IMS (cIMS) device.31 This cIMS device is similar in geometry to previous drift tube based ion cyclotron mobility spectrometry instruments;32,33 however, the cIMS is based on traveling waves, and ions can simultaneously undertake a user-definable number of passes before ejection from the cIMS device. The cIMS device was implemented in a quadrupole-cyclic ion mobility time-of-flight mass spectrometer (Q-cIMS-TOF, Waters SELECT SERIES Cyclic IMS), which was unique among commercially available IMS-MS platforms. The Q-cIMS-TOF enabled flexible combinations of mass selection, ion activation, IMS separation, IMS selection, and IMSn prior to high-resolution TOF detection. The unique capabilities of the cIMS platform have been demonstrated for the analysis of isomeric modifications of RNA,34 oligosaccharides,35−40 gas-phase stability and dynamics of intact protein ions,41,42 intact proteins from tissue sections,43 crude oil,44 and synthetic polymers.45,46
Recent efforts by Smith and co-workers have led to the development of the highly flexible structures for lossless ion manipulations (SLIM), which enabled ultralong serpentine paths and multipass IMS capabilities based on traveling waves. SLIM IMS separations have demonstrated significant increases in resolving power (>1000) from ultralong path length separations and increased charge capacity with “in-SLIM” ion accumulation.47,48 SLIM IMS-MS has been applied to characterization of a wide variety of biomolecules,49−53 including the determination of drug antibody ratios for antibody drug conjugates at the intact subunit level.54
The Q-cIMS-TOF platform has the potential to enable more effective top-down proteoform characterization in addition to protein structure and dynamics studies. It was previously shown that the SYNAPT Q-IMS-TOF platform can be modified to enable alternative ion activation methods before or after the IMS cell. This flexibility has given rise to a number of highly effective approaches to characterization of native and denatured proteins.55−58 Williams et al.57 demonstrated the utility of an electromagnetostatic ExD cell59,60 for post-IMS ECD to probe the structure of native proteins and protein complexes as well as the unfolding of monomers ejected from noncovalent protein complexes. The ExD cell has also shown impressive capabilities for the characterization of monoclonal antibodies,61,62 structural changes in native protein complexes,63 and modified peptides.64,65 Presented here, the implementation of an ExD cell in pre-cIMS and post-cIMS positions in a Q-cIMS-TOF mass spectrometer is reported. Diagnostic c+57 and z-57 product ions of post-cIMS ECD enabled differentiation of mobility resolved isobaric aspartate and iso-aspartate containing peptides. In addition, significant enhancements in top-down protein characterization were achieved with cIMS separations of ECD product ions as demonstrated with model denatured and native proteins.
Experimental Section
Materials and Sample Preparation
Bovine carbonic anhydrase, equine myoglobin, and bovine ubiquitin were purchased as solids from Sigma-Aldrich. Streptavidin was purchased as a solid from Pierce. The trastuzumab heavy chain T12 peptides containing position 4 aspartic acid isomers were purchased from Biomatik. For denaturing analysis, carbonic anhydrase and ubiquitin were reconstituted to final concentrations of 10 and 1 μM, respectively, in 50:50 water/acetonitrile with 0.1% formic acid. The trastuzumab peptides were mixed in a 1:1 ratio at a total peptide concentration of 1 μM in 0.1% formic acid in water. For native MS analysis, carbonic anhydrase, myoglobin, and streptavidin were reconstituted to final concentrations of 5 μM in 200 mM ammonium acetate. Carbonic anhydrase and streptavidin were subsequently buffer-exchanged against 200 mM ammonium acetate using Bio-Rad MicroBioSpin 6 gel filtration spin columns for further sample cleanup.
Cyclic Ion Mobility-Mass Spectrometry
For denaturing analysis of carbonic anhydrase and ubiquitin, and analysis of the trastuzumab peptides, the solutions were introduced into the mass spectrometer using direct infusion at 5 μL/min via a standard universal electrospray source using a capillary voltage of 1.5 kV. For native analysis, the solutions of carbonic anhydrase, myoglobin, and streptavidin were introduced using PicoTip GlassTip 4 μm I.D. glass nanocapillaries (New Objective, MA, USA) via a nanoelectrospray source with an applied capillary voltage of 1–1.5 kV. Other instrument parameters were optimized where required for the transmission of intact native species. Unless otherwise stated, the cyclic ion mobility device was operated in single-pass mode, giving a separation path length of 98 cm. Briefly, ions are accumulated upstream in the trap traveling wave (t-wave) device and released into the multifunctional t-wave ion entry/exit array. To perform ion mobility spectrometry, t-waves are propagated orthogonally to the main instrument axis, and ions are consequently separated within the cyclic device. After separation is complete, the ions exit the device via the multifunctional array with the t-waves operated in the forward axial direction. The TOF was operated in V optics mode with a resolving power specification of 60 000 fwhm.
ExD Cell Placement and Design
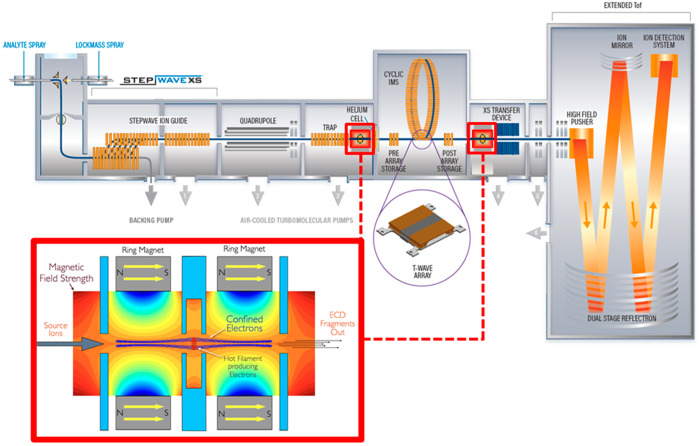
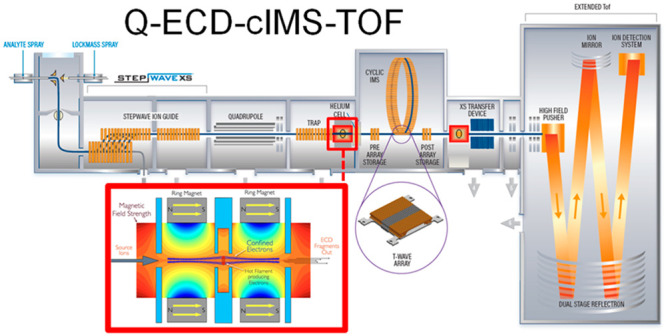
In the SELECT SERIES Cyclic IMS instrument, the ExD cell can be placed in either a pre- or post-cIMS position in the post-trap or pretransfer guide, respectively. These devices are stacked ring ion guides with applied radial RF and axial DC for ion transfer. The incorporation of the ExD cell centrally within these guides is beneficial as it does not require any modification to, or shortening of, other guides, collision cells, or lenses. The ExD cell is composed of a filament holder and heated filament at the center, 7 mm long cylindrical permanent magnets with titanium electrostatic lens inserts, and 1 mm thick titanium electrostatic lenses at each end of the cell. All lens apertures were 3 mm diameter. Electrons were emitted from the filament using a heating current of 2.2–2.3 A and modulating the potential difference between the filament bias and the filament holder. Electrons were confined radially by the magnetic field and axially by a negative bias applied to the lenses at each end of the ExD cell. A schematic of the mass spectrometer and ExD cell is shown in Figure 1.
Figure 1.
Schematic of the Waters SELECT SERIES Cyclic IMS mass spectrometer and the e-MSion, Inc. ExD cell. Instrument configurations include Q-ExD-cIMS-TOF and Q-cIMS-ExD-TOF for pre- and/or post-cIMS ExD.
Data Acquisition and Data Analysis
This study was designed to demonstrate the ultimate performance for ECD coupled with cIMS for continuous infusions, and not LC-MS/MS experiments. For the post-cIMS ECD of trastuzumab peptides and pre-cIMS ECD of ubiquitin experiments, 1 and 4 min of data were accumulated at an acquisition rate of 2 scans/s, respectively. Pre-cIMS ECD of carbonic anhydrase experiments utilized 10 min of data averaging. Waters MassLynx version 4.1 was used to generate mass spectra as a function of drift time and the resulting centroided mass spectra. Waters Driftscope version 2.9 was used to produce 2D mobiligrams and extract mass spectra for a portion of the 2D mobiligram. Centroid mass spectra were converted to MGF file type, and the peak intensity threshold was applied (intensity of 50 or 500). The MGF files were used as the input for the LCMS Spectator (version 1.1.7023.32278; https://github.com/PNNL-Comp-Mass-Spec/LCMS-Spectator/releases). ECD spectra were annotated with b/y and c/z ions, and product ions maps were generated using an LCMS Spectator with 10 ppm mass error and Pearson correlation of 0.8 for isotopic distributions.
Results and Discussion
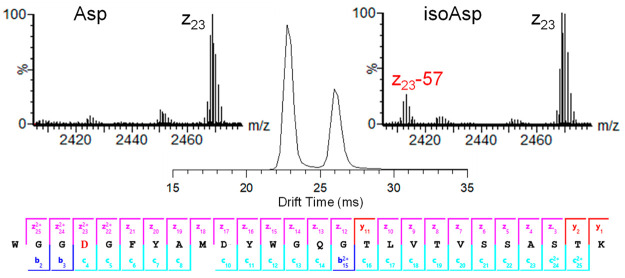
Isomerization of aspartic acid (Asp) to isoaspartic acid (isoAsp) is a nonenzymatic post-translational modification (PTM) that occurs spontaneously in proteins and impacts the stability and function of protein therapeutics.66 Detection and quantification of isoAsp is challenging because isomerization of Asp to isoAsp does not yield a net change in charge or mass of the polypeptides. However, because of the change in structure resulting from isomerization, Asp and isoAsp peptides can be separated by IMS. Figure 2 shows the mobility separation for a mixture of synthetic trastuzumab heavy chain CDR3 W99-K124 peptides containing Asp102 or isoAsp102. The Asp and isoAsp peptides were completely resolved in a single pass of the cIMS (R ∼ 65 Ω/δΩ). The mobility peaks were readily assigned to Asp and isoAsp using post-cIMS ECD due to diagnostic neutral losses from c- and z-ions, +57 and −57 respectively, specific to isoAsp.67 The insets for Figure 2 show the presence of a z23–57 ion in the mass spectrum for the second mobility peak and confirms the presences of isoAsp. As illustrated by the product ion map at the bottom of Figure 2, complete sequence coverage of the peptide was observed, with c/z-ions precisely localizing the position of Asp isomerization to Asp102 (i.e., the fourth residue) and not Asp108.
Figure 2.
cIMS separation of a synthetic mixture of trastuzumab heavy chain peptide W99-K124 with Asp and isoAsp at position 102 (i.e., the fourth residue in the peptide sequence). Mass spectrum insets show the z23 ions observed for each mobility peak. The presence of z23–57 ions confirmed the mobility peak at 26 ms is the peptide containing isoAsp.
The post-cIMS ExD cell position yielded extensive fragmentation and identification of mobility separated isomeric peptides. This illustrates the more general capability to probe the gas-phase structure of analytes and correlate differences in fragmentation to chemical changes or as a function of changing experimental conditions.57,68 The pre-cIMS ExD cell position offers complementary capabilities that can significantly enhance analyte characterization, especially top-down protein characterization. Zinnel et al. developed a MS-CID-IM-MS top-down approach that enabled detection of low abundance CID product ions and increased sequence coverage for peptides and small proteins.55 Below, we expand upon this work to demonstrate the capabilities of a MS-ECD-cIMS-MS approach for top-down and native top-down protein characterization.
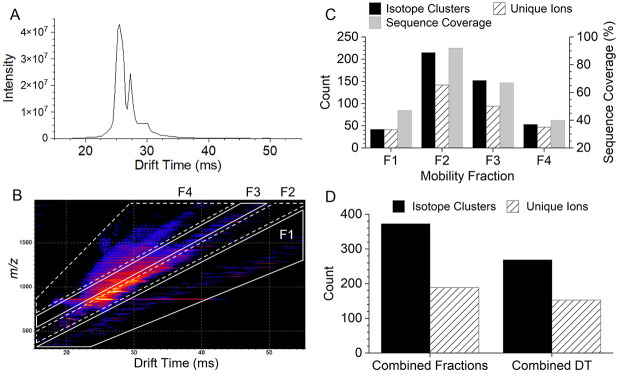
For relatively small proteins, such as ubiquitin (8.6 kDa), the resolving power of modern TOF mass analyzers is not a limiting factor for achieving extensive sequence coverage as the product ion mixture is not overly complex. However, cIMS separation of ubiquitin ECD product ions can enhance detection of low abundance and low charge product ions masked by high abundance and higher charge state ions. The +10 charge state of ubiquitin was mass-selected, dissociated using pre-cIMS ECD, and product ions were separated in the cIMS device prior to TOF mass analysis. Figure 3 shows the resulting 1D (intensity versus drift time) and 2D (m/z versus drift time) mobiligrams. Data were processed in two ways to demonstrate the utility of cIMS to enhance top-down workflows: (1) the entire drift time range of the 1D mobiligram was combined into a single mass spectrum, and (2) mass spectra were extracted from regions of the 2D mobiligram, here termed “mobility fractions”, and analyzed separately. Both methods of data processing yielded 96% sequence coverage, and Figure S1 (Supporting Information) contains the product ion maps for each method. While cIMS of the ECD product ions of +10 ubiquitin did not increase sequence coverage, significant increases in the number of annotated isotope clusters and unique ions were observed using cIMS and mobility fractions.
Figure 3.
1D (A) and 2D (B) cIMS mobiligrams for ECD of +10 ubiquitin. The regions mobility fractions used for extraction of mass spectra are outlined in the 2D mobiligram (m/z vs drift time). The number of annotated isotope clusters/unique ions and sequence coverage for each mobility fraction (C). Comparison of the number of isotope clusters (unique clusters for combined fractions), unique ions, and sequence coverage observed from a single mass spectrum from all drift times (DT) combined and the combined results of the four mobility fractions (D).
Selection of m/z and drift nested mobility fractions, as shown in Figure 3B, should roughly follow product ion charge-state trendlines.55 This would simplify the mass spectrum by extracting ions of a narrow charge state distribution that are spread over a broad m/z range and minimize spectral congestion. For example, fraction 1 in Figure 3B contains primarily singly charged product ions. The product ions observed in fractions 1, 2, 3, and 4 have charge state distributions of 1.2 ± 0.5, 4.7 ± 2.2, 4.4 ± 1.2, and 3.7 ± 0.9, respectively. In the future, more sophisticated selection of mobility regions may further narrow the charge state distributions, and optimization of the ion mobility separation69 is needed to further reduce overlap of trendlines at higher charge states. Figure 3C shows the number of annotated product ion isotope clusters, number of unique ions (e.g., c101+ and c102+ are not unique; c9 and c10 are unique), and sequence coverage observed for each mobility fraction. Product ions maps for each mobility fraction are shown in Figure S2. Mobility fractions 2 and 3 contained the densest portions of the 2D mobiligram, and all precursor and charge reduced precursor ions were intentionally selected in only mobility fraction 2. Figure 3D compares the overall results in terms of the total number of annotated isotope clusters and unique ions for the two processing methods. The combined results of the four mobility fractions yielded 39% more annotated isotope clusters and 24% more unique ions compared to combining the entire drift time range into a single spectrum. In future studies of heterogeneously modified proteins, for example, histone methylation and acetylation, enhanced detection of low abundance product ions could increase capabilities for characterization of site-specific PTM heterogeneity. While these are significant improvements, even greater enhancements are expected for the top-down analysis of larger denatured proteins.
Carbonic anhydrase II is another highly studied model protein used for the development and demonstration of a wide variety of ion activation methods and data acquisition strategies. The highest performance in recent years, in terms of sequence coverage, was achieved with the combination of an ETD/ECD, UVPD, or hybrid ion activation methods and ultra-high-resolution Orbitrap or FTICR mass analysis.9,23,61,70,71 Here, we subjected the +35 charge state of bovine carbonic anhydrase II to ECD, subsequent cIMS separation of ECD product ions, and high-resolution TOF mass analysis. The 2D mobiligram with outlines of the five mobility fractions used to extract product ion mass spectra is shown in Figure 4A. An additional mobility fraction was used to compensate for the greater complexity because of the high precursor charge state and large number of high mass and high charge state product ions. Figure 4B shows the product ion charge state distributions of each mobility fraction. Mobility fraction 1 contained predominantly singly charged ECD product ions and a few low abundance CID fragments that may be formed in the transfer optics. In addition to the remaining precursor and charge reduced precursor ions, fraction 2 contained large, highly charged ECD product ions with an average charge state of +22. Mobility fraction 3 contained a broad distribution of product ion charge states, whereas mobility fractions 4 and 5 contained relatively narrow distributions of lower charge state product ions. There was significant overlap in the product ion charge state distributions of the mobility fractions; however, there was relatively low overlap in the isotope clusters and unique ions identified in each mobility fraction. Figure 4C shows the percentage overlap in isotope clusters and unique ions between adjacent mobility fractions. Fractions 1 and 2 contained less than 5% overlap in both isotope clusters and unique ions. This is expected since mobility fraction 1 contained predominantly singly charged ions, whereas fraction 2 contained precursor, charge reduced precursor, and high mass product ions. Overlap between fractions 2 and 3, 3 and 4, and 4 and 5 was minimal for isotope clusters but more significant for unique ions. This indicates that the various charge states of any product ion were distributed between different mobility fractions.
Figure 4.
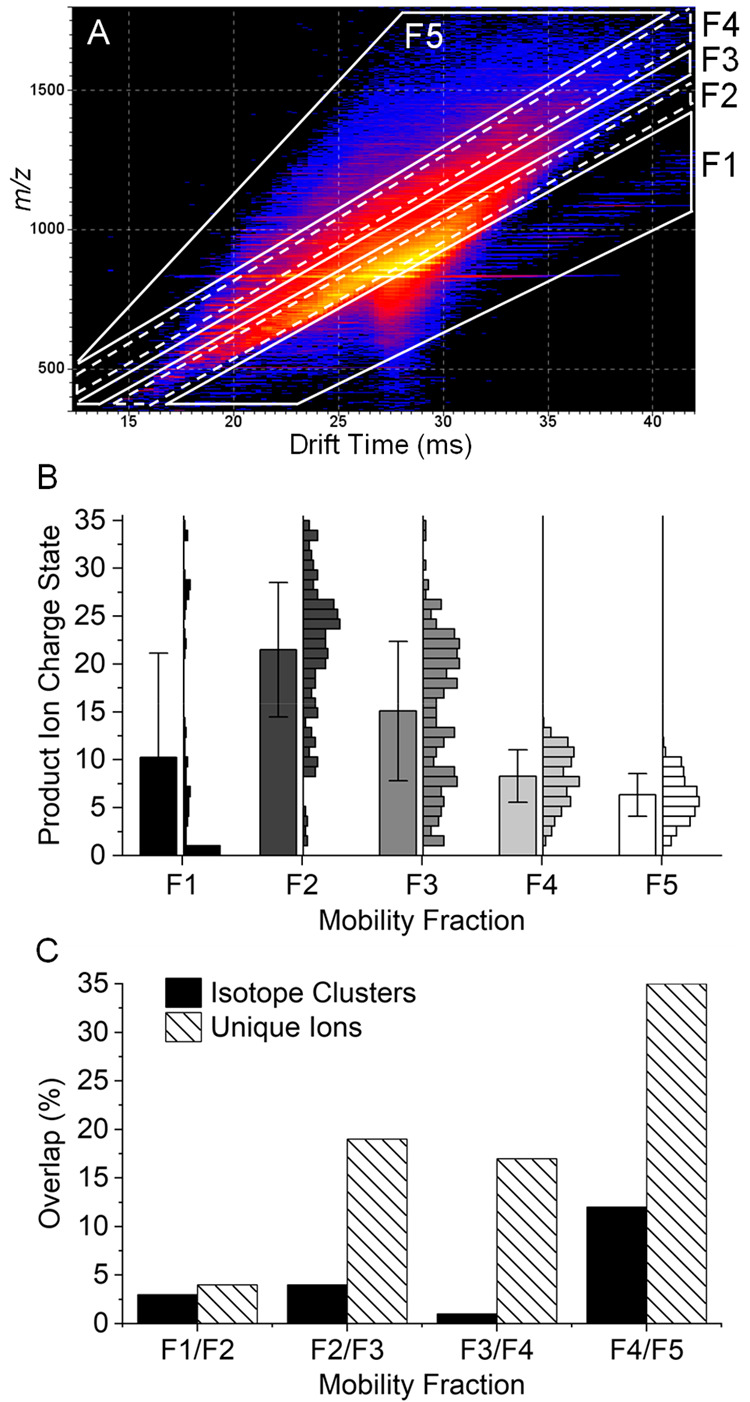
2D mobiligram (m/z vs drift time) for pre-cIMS ECD of the +35 charge state of bovine carbonic anhydrase II (A) with outlined mobility fractions. Product ions charge state distributions for each mobility fraction with 1 standard deviation error bars (B), and the percent overlap in unique isotope clusters and unique ions observed between adjacent mobility fractions (C).
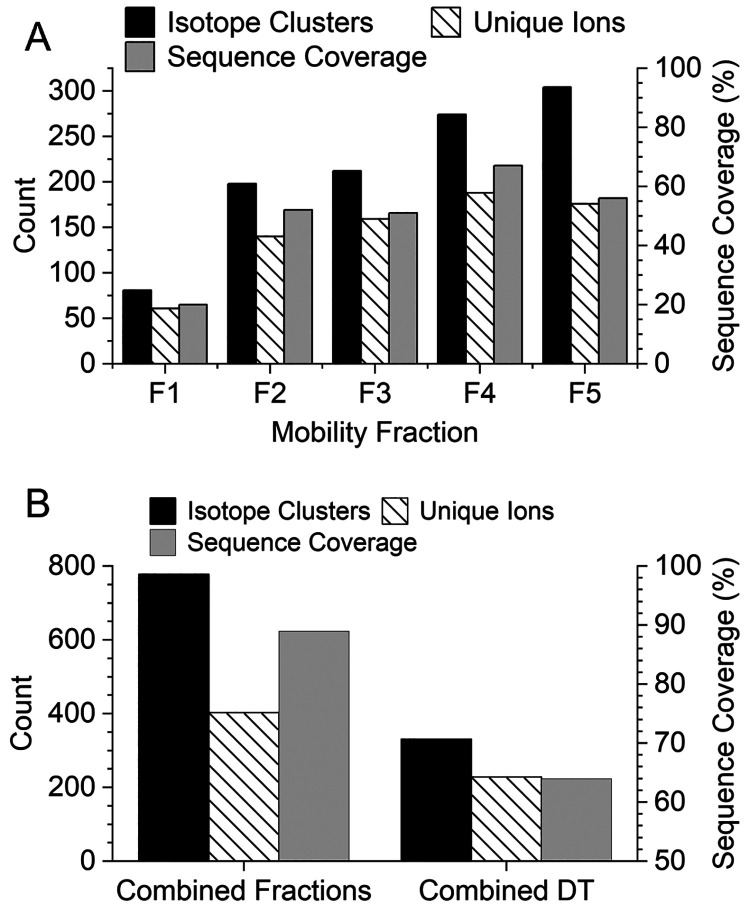
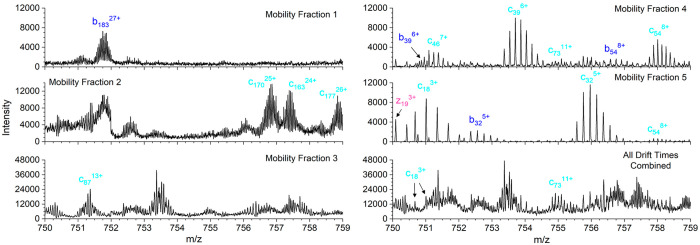
A closer look at the number of annotated isotope clusters, unique ions, and sequence coverage for each mobility fraction is shown in Figure 5A. The very similar number of isotope clusters and unique ions observed in fractions 1–4 indicates most of the identified product ions were only observed in a single-charge state per mobility fraction. Mobility fraction 5 covered a broad region of the 2D mobiligram and yielded nearly twice as many isotope clusters as unique ions. Fractions 1–5 yielded 20%, 52%, 51%, 67%, and 54% sequence coverage, respectively, and the product ion maps for each mobility fraction are shown in Figure S3. The extracted mass spectra for each mobility fraction are shown in Figure S4, and a zoomed-in region of the spectrum, m/z 750–759, for each mobility fraction and the combined drift time spectrum are shown in Figure 6. The zoomed-in region contains many highly charged and overlapping product ion isotopic distributions. Insufficient mass resolving power yielded an elevated baseline and highly distorted isotopic distributions that yielded only two identified product ions in the combined drift time spectrum (bottom right panel of Figure 6). Although the use of mobility fractions did not completely eliminate the elevated baseline and overlap of isotopic distributions, mobility fractions enabled the detection of many product ions that were completely masked by more abundant, high mass product ions. Zoomed-in regions of the mass spectra of the mobility fractions yielded 15 identified product ions. The number of isotope clusters, unique ions, and sequence coverage for the five mobility fractions combined and the combined drift time mass spectrum are compared in Figure 5B. The five mobility fractions yielded a total of 778 unique isotope clusters and 403 unique ions compared to 331 isotopic clusters and 229 unique ions from the combined drift time mass spectrum. Mobility fractions yielded a 135% increase in annotated isotope clusters and 76% increase in unique ions. The increase in product ion identifications yielded 89% sequence coverage for the combined mobility fractions compared to only 64% for the combined drift time mass spectrum.
Figure 5.
Number of annotated isotope clusters, unique ions, and sequence coverage observed for each mobility fraction for pre-cIMS ECD of +35 bovine carbonic anhydrase II (A). Comparison of the number of isotope clusters (unique isotope cluster for combined fractions), unique ions, and sequence coverage observed from a single mass spectrum from all drift times (DT) combined and the combined results of the five mobility fractions (B).
Figure 6.
Zoomed-in region for the five mobility fractions and combined drift time mass spectra for pre-cIMS ECD of +35 bovine carbonic anhydrase II.
The analysis of native-like charge states of proteins offers the benefit of spectral decongestion as lower charge state precursor ions yield low charge state product ions spread over a broad m/z range. However, native-like charge states of proteins are often difficult to fragment extensively. The development of hybrid ion activation methods combining UV photons or electron-based ion activation methods with low levels of vibrational activation via infrared photons or collisions with inert neutrals has enabled efficient dissociation and characterization of native-like protein structures. In the data above, collisional activation was minimized throughout the experiment to avoid threshold fragmentation pathways. However, efficient dissociation and characterization of native-like protein structures requires unfolding of higher order structure maintained by noncovalent interaction prior to and after ECD. Results are shown in Figure S6 for pre-IMS ECD with collisional activation in-source and during transfer of ions to the cIMS for the +11 charge state of bovine carbonic anhydrase II. The 2D mobiligram was again segmented into five mobility fractions, and the extracted mass spectra were processed independently, results combined, and results compared to a single mass spectrum produced by combining the entire drift time range of the 1D mobiligram. Product ion maps for the five mobility fractions are shown in Figure S7. Fractions 1–5 yielded 10%, 52%, 51%, 57%, and 55% sequence coverage, respectively. The five mobility fractions combined to yield 80% sequence coverage (Figure 7), whereas the combined drift time spectrum yielded 75% sequence coverage (Figure S8). The major gap in sequence coverage corresponded to the region responsible for zinc binding, specifically His94 through His119, and the precursor analyzed contained a single zinc cation bound.
Figure 7.
Product ion map for pre-cIMS ECD of the +11 charge state of native bovine carbonic anhydrase II generated from the combined results of five mobility fractions.
Although the use of mobility fractions provided only a 5% increase in sequence coverage for the +11 charge state of carbonic anhydrase, a 20% increase in isotope cluster and 11% increase in unique ions were observed. These results are like those observed for the +10 charge state of ubiquitin, with regards to mass resolving power not being the limiting factor for the detection of product ions and ultimate sequence coverage. This is interesting because carbonic anhydrase is roughly 4 times the mass of ubiquitin, yet similar results were achieved. These results provide justification for recent trends in the community to characterize larger proteins from lower, native-like charge states to take advantage of the natural spectral decongestion afforded by lower charge states precursor ions.
Conclusions
The pre- and post-cIMS placement of the ExD cell in combination with the ability to perform collisional activation pre- and post-cIMS creates a high degree of flexibility for ion activation and dissociation in the Q-cIMS-TOF platform. Here, we focused on pre-cIMS ECD with or without supplemental collisional activation for the characterization of denatured intact proteins and native intact proteins. We demonstrated the utility of ECD in combination with cIMS to significantly enhance top-down characterization of denatured proteins and laid the groundwork for future native top-down studies of large proteins and protein complexes. The Q-cIMS-TOF platform with pre-cIMS ECD greatly increased the number of identifiable product ion isotope clusters by simplifying the complexity of product ion populations arriving at the TOF analyzer. This in combination with the extraction of mass spectra from selected regions of the 2D mobiligram, that is, mobility fractions, yielded sequence coverage comparable to or better than that demonstrated with ultra-high-resolution Orbitrap and FTICR-MS platforms. Significantly, this study illustrated the potential of IMS as an alternative approach for unraveling the true complexity of product ion populations generated in top-down and native top-down mass spectrometry experiments.
Acknowledgments
Financial support for this work was in part provided by the National Institutes of Health (SBIR awards 2R44GM134792 and GM123855).
Supporting Information Available
The Supporting Information is available free of charge at https://pubs.acs.org/doi/10.1021/acs.analchem.1c04870.
Product ion maps, ECD mass spectra, ECD product ion mobiligram, and product ion analyses (PDF)
Author Contributions
The manuscript was written through contributions of all authors.
The authors declare the following competing financial interest(s): J.B.S., J.S.B., and V.G.V. are employed by e-MSion, Inc. who manufactures ExD devices for sale; D.A.C.-S., D.H., J.L.W., and J.I.L. are employed by Waters Corporation who manufactures the SELECT SERIES Cyclic IMS instrumentation for sale.
Supplementary Material
References
- Kellie J. F.; Tran J. C.; Lee J. E.; Ahlf D. R.; Thomas H. M.; Ntai I.; Catherman A. D.; Durbin K. R.; Zamdborg L.; Vellaichamy A.; Thomas P. M.; Kelleher N. L. Mol. Biosyst. 2010, 6, 1532–1539. 10.1039/c000896f. [DOI] [PMC free article] [PubMed] [Google Scholar]
- Zhou H.; Ning Z.; Starr A.; Abu-Farha M.; Figeys D. Anal. Chem. 2012, 84, 720–734. 10.1021/ac202882y. [DOI] [PubMed] [Google Scholar]
- Gregorich Z. R.; Ge Y. PROTEOMICS 2014, 14, 1195–1210. 10.1002/pmic.201300432. [DOI] [PMC free article] [PubMed] [Google Scholar]
- Meier F.; Beck S.; Grassl N.; Lubeck M.; Park M. A.; Raether O.; Mann M. J. Proteome Res. 2015, 14, 5378–5387. 10.1021/acs.jproteome.5b00932. [DOI] [PubMed] [Google Scholar]
- Macias L. A.; Santos I. C.; Brodbelt J. S. Anal. Chem. 2020, 92, 227–251. 10.1021/acs.analchem.9b04859. [DOI] [PMC free article] [PubMed] [Google Scholar]
- Zubarev R. A.; Kelleher N. L.; McLafferty F. W. A Nonergodic Process. J. Am. Chem. Soc. 1998, 120, 3265–3266. 10.1021/ja973478k. [DOI] [Google Scholar]
- Horn D. M.; Ge Y.; McLafferty F. W. Anal. Chem. 2000, 72, 4778–4784. 10.1021/ac000494i. [DOI] [PubMed] [Google Scholar]
- Syka J. E. P.; Coon J. J.; Schroeder M. J.; Shabanowitz J.; Hunt D. F. Proc. Natl. Acad. Sci. U. S. A. 2004, 101, 9528–9533. 10.1073/pnas.0402700101. [DOI] [PMC free article] [PubMed] [Google Scholar]
- Shaw J. B.; Li W.; Holden D. D.; Zhang Y.; Griep-Raming J.; Fellers R. T.; Early B. P.; Thomas P. M.; Kelleher N. L.; Brodbelt J. S. J. Am. Chem. Soc. 2013, 135, 12646–12651. 10.1021/ja4029654. [DOI] [PMC free article] [PubMed] [Google Scholar]
- Smith L. M.; Kelleher N. L. Nat. Methods 2013, 10, 186–187. 10.1038/nmeth.2369. [DOI] [PMC free article] [PubMed] [Google Scholar]
- Compton P. D.; Zamdborg L.; Thomas P. M.; Kelleher N. L. Anal. Chem. 2011, 83, 6868–6874. 10.1021/ac2010795. [DOI] [PMC free article] [PubMed] [Google Scholar]
- Makarov A.; Denisov E.; Lange O. J. Am. Soc. Mass Spectrom. 2009, 20, 1391–1396. 10.1016/j.jasms.2009.01.005. [DOI] [PubMed] [Google Scholar]
- Nikolaev E. N.; Boldin I. A.; Jertz R.; Baykut G. J. Am. Soc. Mass Spectrom. 2011, 22, 1125–1133. 10.1007/s13361-011-0125-9. [DOI] [PubMed] [Google Scholar]
- Tolmachev A. V.; Robinson E. W.; Smith R. D.; Leach F. E.; Futrell J. H.; Paša-Tolić L. Int. J. Mass Spectrom. 2012, 325–327, 45–50. 10.1016/j.ijms.2012.06.027. [DOI] [Google Scholar]
- Nagornov K. O.; Gorshkov M. V.; Kozhinov A. N.; Tsybin Y. O. Anal. Chem. 2014, 86, 9020–9028. 10.1021/ac501579h. [DOI] [PubMed] [Google Scholar]
- Shaw J. B.; Gorshkov M. V.; Wu Q.; Paša-Tolić L. Anal. Chem. 2018, 90, 5557–5562. 10.1021/acs.analchem.7b04606. [DOI] [PubMed] [Google Scholar]
- Comisarow M. B. J. Chem. Phys. 1971, 55, 205–217. 10.1063/1.1675510. [DOI] [Google Scholar]
- Marshall A. G. J. Chem. Phys. 1971, 55, 1343–1354. 10.1063/1.1676226. [DOI] [Google Scholar]
- Kilgour D. P. A.; Wills R.; Qi Y.; O’Connor P. B. Anal. Chem. 2013, 85, 3903–3911. 10.1021/ac303289c. [DOI] [PMC free article] [PubMed] [Google Scholar]
- Lange O.; Damoc E.; Wieghaus A.; Makarov A.. Proceedings of the 59th ASMS Conference on Mass Spectrometry and Allied Topics; Denver, CO, 2011. [Google Scholar]
- Stephenson J. L.; McLuckey S. A. J. Am. Chem. Soc. 1996, 118, 7390–7397. 10.1021/ja9611755. [DOI] [Google Scholar]
- Huguet R.; Mullen C.; Srzentić K.; Greer J. B.; Fellers R. T.; Zabrouskov V.; Syka J. E. P.; Kelleher N. L.; Fornelli L. Anal. Chem. 2019, 91, 15732–15739. 10.1021/acs.analchem.9b03925. [DOI] [PMC free article] [PubMed] [Google Scholar]
- Kline J. T.; Mullen C.; Durbin K. R.; Oates R. N.; Huguet R.; Syka J. E. P.; Fornelli L. J. Am. Soc. Mass Spectrom. 2021, 32, 2334. 10.1021/jasms.1c00062. [DOI] [PubMed] [Google Scholar]
- Weisbrod C. R.; Anderson L. C.; Hendrickson C. L.; Schaffer L. V.; Shortreed M. R.; Smith L. M.; Shabanowitz J.; Hunt D. F. Anal. Chem. 2021, 93, 9119–9128. 10.1021/acs.analchem.1c00847. [DOI] [PMC free article] [PubMed] [Google Scholar]
- May J. C.; McLean J. A. Anal. Chem. 2015, 87, 1422–1436. 10.1021/ac504720m. [DOI] [PMC free article] [PubMed] [Google Scholar]
- Clemmer D. E.; Jarrold M. F. J. Mass Spectrom. 1997, 32, 577–592. . [DOI] [Google Scholar]
- Campuzano I. D. G.; Giles K. TrAC Trends Anal. Chem. 2019, 120, 115620. 10.1016/j.trac.2019.115620. [DOI] [Google Scholar]
- Silveira J. A.; Ridgeway M. E.; Park M. A. Anal. Chem. 2014, 86, 5624. 10.1021/ac501261h. [DOI] [PubMed] [Google Scholar]
- Kolakowski B. M.; Mester Z. Analyst 2007, 132, 842–864. 10.1039/b706039d. [DOI] [PubMed] [Google Scholar]
- Pringle S. D.; Giles K.; Wildgoose J. L.; Williams J. P.; Slade S. E.; Thalassinos K.; Bateman R. H.; Bowers M. T.; Scrivens J. H. Int. J. Mass Spectrom. 2007, 261, 1–12. 10.1016/j.ijms.2006.07.021. [DOI] [Google Scholar]
- Giles K.; Ujma J.; Wildgoose J.; Pringle S.; Richardson K.; Langridge D.; Green M. Anal. Chem. 2019, 91, 8564–8573. 10.1021/acs.analchem.9b01838. [DOI] [PubMed] [Google Scholar]
- Merenbloom S. I.; Glaskin R. S.; Henson Z. B.; Clemmer D. E. Anal. Chem. 2009, 81, 1482–1487. 10.1021/ac801880a. [DOI] [PMC free article] [PubMed] [Google Scholar]
- Glaskin R. S.; Valentine S. J.; Clemmer D. E. Anal. Chem. 2010, 82, 8266–8271. 10.1021/ac1017474. [DOI] [PubMed] [Google Scholar]
- Kenderdine T.; Nemati R.; Baker A.; Palmer M.; Ujma J.; FitzGibbon M.; Deng L.; Royzen M.; Langridge J.; Fabris D. J. Mass Spectrom. 2020, 55, e4465 10.1002/jms.4465. [DOI] [PMC free article] [PubMed] [Google Scholar]
- Ropartz D.; Fanuel M.; Ujma J.; Palmer M.; Giles K.; Rogniaux H. Anal. Chem. 2019, 91, 12030–12037. 10.1021/acs.analchem.9b03036. [DOI] [PubMed] [Google Scholar]
- Sastre Toraño J.; Gagarinov I. A.; Vos G. M.; Broszeit F.; Srivastava A. D.; Palmer M.; Langridge J. I.; Aizpurua-Olaizola O.; Somovilla V. J.; Boons G. Angew. Chem., Int. Ed. 2019, 58, 17616–17620. 10.1002/anie.201909623. [DOI] [PubMed] [Google Scholar]
- McKenna K. R.; Li L.; Baker A. G.; Ujma J.; Krishnamurthy R.; Liotta C. L.; Fernández F. M. Analyst 2019, 144, 7220–7226. 10.1039/C9AN01584A. [DOI] [PubMed] [Google Scholar]
- Ujma J.; Ropartz D.; Giles K.; Richardson K.; Langridge D.; Wildgoose J.; Green M.; Pringle S. J. Am. Soc. Mass Spectrom. 2019, 30, 1028–1037. 10.1007/s13361-019-02168-9. [DOI] [PMC free article] [PubMed] [Google Scholar]
- Ollivier S.; Tarquis L.; Fanuel M.; Li A.; Durand J.; Laville E.; Potocki-Veronese G.; Ropartz D.; Rogniaux H. Anal. Chem. 2021, 93, 6254–6261. 10.1021/acs.analchem.1c00673. [DOI] [PubMed] [Google Scholar]
- Peterson T. L.; Nagy G. Anal. Chem. 2021, 93, 9397–9407. 10.1021/acs.analchem.1c00942. [DOI] [PubMed] [Google Scholar]
- Eldrid C.; Ujma J.; Kalfas S.; Tomczyk N.; Giles K.; Morris M.; Thalassinos K. Anal. Chem. 2019, 91, 7554–7561. 10.1021/acs.analchem.8b05641. [DOI] [PMC free article] [PubMed] [Google Scholar]
- Eldrid C.; Ben-Younis A.; Ujma J.; Britt H.; Cragnolini T.; Kalfas S.; Cooper-Shepherd D.; Tomczyk N.; Giles K.; Morris M.; Akter R.; Raleigh D.; Thalassinos K. J. Am. Soc. Mass Spectrom. 2021, 32, 1545–1552. 10.1021/jasms.1c00018. [DOI] [PMC free article] [PubMed] [Google Scholar]
- Sisley E. K.; Ujma J.; Palmer M.; Giles K.; Fernandez-Lima F. A.; Cooper H. J. Anal. Chem. 2020, 92, 6321–6326. 10.1021/acs.analchem.9b05169. [DOI] [PMC free article] [PubMed] [Google Scholar]
- Cho E.; Riches E.; Palmer M.; Giles K.; Ujma J.; Kim S. Anal. Chem. 2019, 91, 14268–14274. 10.1021/acs.analchem.9b02255. [DOI] [PubMed] [Google Scholar]
- Haler J. R. N.; Far J.; Aqil A.; Claereboudt J.; Tomczyk N.; Giles K.; Jérôme C.; De Pauw E. J. Am. Soc. Mass Spectrom. 2017, 28, 2492–2499. 10.1007/s13361-017-1769-x. [DOI] [PubMed] [Google Scholar]
- Riches E.; Palmer M. E. Rapid Commun. Mass Spectrom. 2020, 34, e8710 10.1002/rcm.8710. [DOI] [PubMed] [Google Scholar]
- Deng L.; Garimella S. V. B.; Hamid A. M.; Webb I. K.; Attah I. K.; Norheim R. V.; Prost S. A.; Zheng X.; Sandoval J. A.; Baker E. S.; Ibrahim Y. M.; Smith R. D. Anal. Chem. 2017, 89, 6432–6439. 10.1021/acs.analchem.7b00189. [DOI] [PMC free article] [PubMed] [Google Scholar]
- Deng L.; Webb I. K.; Garimella S. V. B.; Hamid A. M.; Zheng X.; Norheim R. V.; Prost S. A.; Anderson G. A.; Sandoval J. A.; Baker E. S.; Ibrahim Y. M.; Smith R. D. Anal. Chem. 2017, 89, 4628–4634. 10.1021/acs.analchem.7b00185. [DOI] [PMC free article] [PubMed] [Google Scholar]
- Allen S. J.; Eaton R. M.; Bush M. F. Anal. Chem. 2017, 89, 7527–7534. 10.1021/acs.analchem.7b01234. [DOI] [PubMed] [Google Scholar]
- Chouinard C. D.; Nagy G.; Webb I. K.; Shi T.; Baker E. S.; Prost S. A.; Liu T.; Ibrahim Y. M.; Smith R. D. Anal. Chem. 2018, 90, 10889–10896. 10.1021/acs.analchem.8b02397. [DOI] [PMC free article] [PubMed] [Google Scholar]
- Nagy G.; Attah I. K.; Garimella S. V. B.; Tang K.; Ibrahim Y. M.; Baker E. S.; Smith R. D. Chem. Commun. 2018, 54, 11701–11704. 10.1039/C8CC06966B. [DOI] [PMC free article] [PubMed] [Google Scholar]
- Nagy G.; Kedia K.; Attah I. K.; Garimella S. V. B.; Ibrahim Y. M.; Petyuk V. A.; Smith R. D. Anal. Chem. 2019, 91, 4374–4380. 10.1021/acs.analchem.8b04696. [DOI] [PMC free article] [PubMed] [Google Scholar]
- Warnke S.; Faleh A. B.; Pellegrinelli R. P.; Yalovenko N.; Rizzo T. R. Faraday Discuss. 2019, 217, 114–125. 10.1039/C8FD00180D. [DOI] [PMC free article] [PubMed] [Google Scholar]
- Nagy G.; Attah I. K.; Conant C. R.; Liu W.; Garimella S. V. B.; Gunawardena H. P.; Shaw J. B.; Smith R. D.; Ibrahim Y. M. Anal. Chem. 2020, 92, 5004–5012. 10.1021/acs.analchem.9b05209. [DOI] [PMC free article] [PubMed] [Google Scholar]
- Zinnel N. F.; Pai P.-J.; Russell D. H. Anal. Chem. 2012, 84, 3390–3397. 10.1021/ac300193s. [DOI] [PubMed] [Google Scholar]
- Zhou M.; Jones C. M.; Wysocki V. H. Anal. Chem. 2013, 85, 8262–8267. 10.1021/ac401497c. [DOI] [PubMed] [Google Scholar]
- Williams J. P.; Morrison L. J.; Brown J. M.; Beckman J. S.; Voinov V. G.; Lermyte F. Anal. Chem. 2020, 92, 3674–3681. 10.1021/acs.analchem.9b04763. [DOI] [PMC free article] [PubMed] [Google Scholar]
- Lermyte F.; Verschueren T.; Brown J. M.; Williams J. P.; Valkenborg D.; Sobott F. Methods 2015, 89, 22–29. 10.1016/j.ymeth.2015.05.019. [DOI] [PubMed] [Google Scholar]
- Voinov V. G.; Deinzer M. L.; Barofsky D. F. Rapid Commun. Mass Spectrom. 2008, 22, 3087–3088. 10.1002/rcm.3709. [DOI] [PMC free article] [PubMed] [Google Scholar]
- Voinov V. G.; Deinzer M. L.; Barofsky D. F. Anal. Chem. 2009, 81, 1238–1243. 10.1021/ac802084w. [DOI] [PMC free article] [PubMed] [Google Scholar]
- Shaw J. B.; Malhan N.; Vasil’ev Y. V.; Lopez N. I.; Makarov A.; Beckman J. S.; Voinov V. G. Anal. Chem. 2018, 90, 10819–10827. 10.1021/acs.analchem.8b01901. [DOI] [PMC free article] [PubMed] [Google Scholar]
- Shaw J. B.; Liu W.; Vasil'ev Y. V.; Bracken C. C.; Malhan N.; Guthals A.; Beckman J. S.; Voinov V. G. Anal. Chem. 2020, 92, 766–773. 10.1021/acs.analchem.9b03129. [DOI] [PMC free article] [PubMed] [Google Scholar]
- Zhou M.; Liu W.; Shaw J. B. Anal. Chem. 2020, 92, 1788–1795. 10.1021/acs.analchem.9b03469. [DOI] [PubMed] [Google Scholar]
- Mukherjee S.; Kapp E. A.; Lothian A.; Roberts A. M.; Vasil’ev Y. V.; Boughton B. A.; Barnham K. J.; Kok W. M.; Hutton C. A.; Masters C. L.; Bush A. I.; Beckman J. S.; Dey S. G.; Roberts B. R. Anal. Chem. 2017, 89, 6136–6145. 10.1021/acs.analchem.7b00941. [DOI] [PubMed] [Google Scholar]
- Voinov V. G.; Bennett S. E.; Beckman J. S.; Barofsky D. F. J. Am. Soc. Mass Spectrom. 2014, 25, 1730–1738. 10.1007/s13361-014-0956-2. [DOI] [PMC free article] [PubMed] [Google Scholar]
- Walsh G.; Jefferis R. Nat. Biotechnol. 2006, 24, 1241–1252. 10.1038/nbt1252. [DOI] [PubMed] [Google Scholar]
- Sargaeva N. P.; Lin C.; O’Connor P. B. Anal. Chem. 2009, 81, 9778–9786. 10.1021/ac901677t. [DOI] [PMC free article] [PubMed] [Google Scholar]
- Han L.; Hyung S.-J.; Ruotolo B. T. Angew. Chem., Int. Ed. Engl. 2012, 51, 5692–5695. 10.1002/anie.201109127. [DOI] [PMC free article] [PubMed] [Google Scholar]
- Haynes S. E.; Polasky D. A.; Dixit S. M.; Majmudar J. D.; Neeson K.; Ruotolo B. T.; Martin B. R. Anal. Chem. 2017, 89, 5669–5672. 10.1021/acs.analchem.7b00112. [DOI] [PMC free article] [PubMed] [Google Scholar]
- Weisbrod C. R.; Kaiser N. K.; Syka J. E. P.; Early L.; Mullen C.; Dunyach J.-J.; English A. M.; Anderson L. C.; Blakney G. T.; Shabanowitz J.; Hendrickson C. L.; Marshall A. G.; Hunt D. F. J. Am. Soc. Mass Spectrom. 2017, 28, 1787–1795. 10.1007/s13361-017-1702-3. [DOI] [PMC free article] [PubMed] [Google Scholar]
- Riley N. M.; Westphall M. S.; Coon J. J. J. Am. Soc. Mass Spectrom. 2018, 29, 140–149. 10.1007/s13361-017-1808-7. [DOI] [PMC free article] [PubMed] [Google Scholar]
Associated Data
This section collects any data citations, data availability statements, or supplementary materials included in this article.


