Abstract
Green synthesis of nanoparticles plays an important role in their efficient therapeutic effects in various biomedical applications. Here, we prepared gold nano bioconjugates (GNBCs) from the ethyl acetate fraction of onion peels and investigated their anti-inflammatory activity in lipopolysaccharide-stimulated RAW 264.7 macrophages. The GNBCs were characterized by UV–visible spectroscopy, dynamic light scattering, and transmission electron microscopy. Comparative studies have been conducted among GNBCs, fractionate alone [onion peel drug (OPD)], and the standard drug dexamethasone in various anti-inflammatory assays. It was observed that GNBCs showed comparatively good therapeutic efficacy than the fractionate alone. At the lowest 10 μg/mL concentration, the GNBC and OPD exhibited 70.86 and 91.98% of reactive oxygen species production, 10.88 and 20.97 ng/μL of nitrite production, 337 and 378 pg/mL of TNF-α production, 27.1 and 30.64 pg/mL of IL-6 production, respectively, by maintaining a satisfactory cell viability. Moreover, to understand the mechanistic pathway of GNBCs in their entry into the macrophages, their localization, and duration, uptake studies have been performed where a caveolar-mediated endocytosis pathway is found to be prominent. Hence, this study will lead to the development of cheap, green synthesis of nano bioconjugates and their role in inflammation.
Introduction
Inflammation is a complex defense mechanism of a living organism against invading pathogens, insect bites, or irritants that encompass various immune cells such as macrophages, dendritic cells, mast cells, blood vessels, and molecular mediators.1 Primarily, inflammation is a body’s protective response that eliminates necrotic cells and damaged tissues from the inflamed site and facilitates tissue repair.2 However, prolonged and repeated chronic inflammation can eventually lead to the damage of healthy cells, tissues, and organs which ultimately leads to the development of various diseases such as cancer, rheumatoid arthritis, obesity, cardiovascular diseases, type 2 diabetes, asthma, and so forth.3,4 Among various immune cells, macrophages are more commonly used in understanding the immune pathways and investigation of various anti-inflammatory agents. Lipopolysaccharide (LPS), a vital component found in the outer cell membranes of Gram-negative bacteria plays a major role in the activation of macrophages. Consequently, leading to the generation of copious pro-inflammatory cytokines and mediators such as tumor necrosis factor (TNF)-α, IL-1β, and IL-6, nitric oxide (NO).5
In nature, there are several plant secondary metabolites such as flavonoids, terpenoids, and alkaloids that play an important role in preventing various diseases. Quercetin, one of the major flavonoids found in onion peels 20 times higher when compared to the edible part of the onion,6−9 takes part in the regulation of scavenging free radicals, inhibition of lipid peroxidation, and inhibition of proinflammatory cytokines and mediators via modulating various cell signaling pathways.10,11 The outer layer, that is, the peel of red onions contains elevated antioxidant properties when compared to other varieties.12 Due to such good antioxidant properties, onion peels can be used in the treatment of cancer, stress, and so forth.13,14
Preparation of metal nanoparticles by conventional approaches often employed toxic reducing agents and organic solvents, which ultimately led to the release of noxious environmental waste.15 Green synthesis of nanoparticles nowadays is a major attraction in the field of bionanotechnology. Because the biosynthesized nanoparticle utilizes natural resources, this approach can be considered as eco-friendly, cost-effective, energy-efficient, and biocompatible that can overcome the limitations of physiochemical synthesis by avoiding the use of toxic chemicals, and by reducing side effects.16,17
The onion peel, although a waste, it contains many-fold quercetin as compared to onion flesh.18 Instead of using commercially available quercetin as a capping agent for gold nanoparticle (gold NP) synthesis,19 in our earlier report,20 the onion peel was used as a cheap source of quercetin which can act as a strong reducing agent and capping agent that also checked the synergistic antioxidant and anti-inflammatory activities in L6 skeletal muscle cell line. The whole onion peel crude extract was purified into four fractionates which are as follows ethyl acetate (EA), butanol, methanol, and water. Different types of antioxidant assays were carried out from the prepared fractionate. Among them, EA fractionate exhibited the highest antioxidant activity.
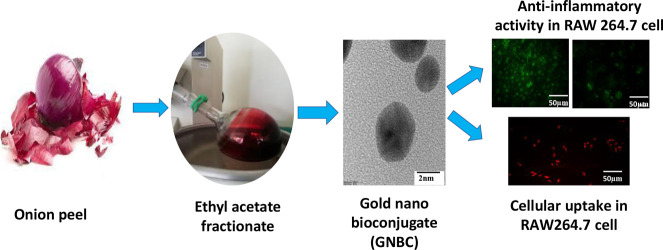
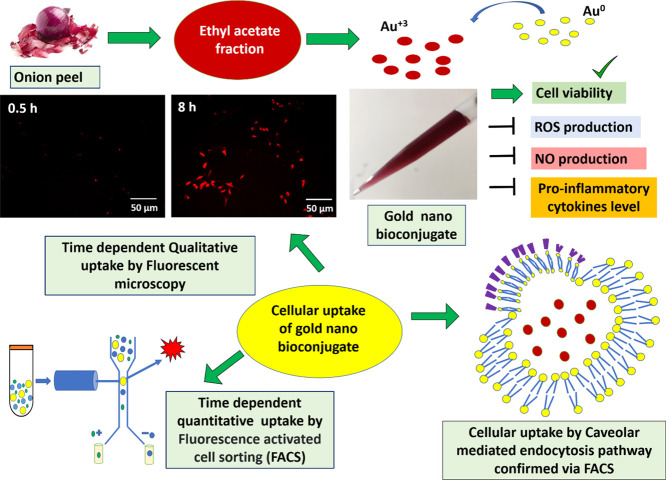
Therefore, in this current work, the anti-inflammatory activity of onion peel-derived gold nano bioconjugates (B) labeled as GNBCs was further evaluated in in vitro macrophage RAW 264.7 cells and also investigated their cellular uptake by qualitative and quantitative measurement via fluorescent microscopy and flow cytometry analysis. Furthermore, various inhibitors have been used to explore the actual mechanism of cellular internalization to better understand the interaction between the cell and nanoparticle for future effective biomedical applications. Scheme 1 shows the schematic representation of the protocol adopted to study the use of the GNBC as a potential anti-inflammatory drug along with their underlying cellular uptake mechanism and hence, such study will lead to the development of nano bio-conjugates as a therapeutic agent.
Scheme 1. Schematic Representation of GNBC Synthesis from EA Fractionate of the Onion Peel Extract and Its Subsequent Inhibitory Effect on Inflammation in RAW 264.7 Macrophage And Cellular Uptake of GNBC with Different Time Intervals has Been Evaluated by Both Qualitative (Fluorescent Microscopy) and Quantitative (FACS) Method.
Results and Discussions
Characterization of GNBCs
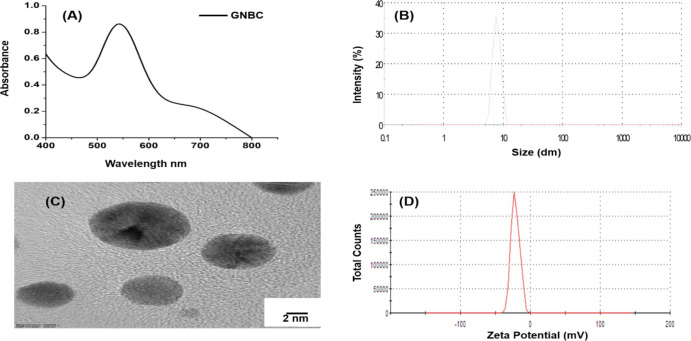
The GNBCs which has been prepared from EA fraction of onion peels adopted from earlier protocol20 were characterized by UV–visible absorption spectroscopy, zeta potential analyzer, dynamic light scattering (DLS) technique, and transmission electron microscopy (TEM). The prepared GNBC exhibits a ruby red color, characteristic of Au nanoparticles which is due to surface plasmon resonance at 540 nm.20 As shown in the UV–vis spectra Figure 1D a distinct surface plasmon peak at 540 nm has been observed. The zeta potential of GNBC was found to be ζ = −21.2 mV. The negative surface charge of GNBC indicates a negative charge on the nanoparticles. The size of the GNBC was determined to be 7.8 nm from the DLS measurement. Furthermore, the characteristic morphology was analyzed by TEM, and Figure 1C shows that the synthesized GNBC is spherical and sizes are below 20 nm. The synthesized GNBC is stable for months without agglomeration. Figure S2 in Supporting Information shows the representative TEM images of GNBC taken after 30 days, 60 days, and 120 days. The TEM images clearly show that the particles are below 10 nm. Similarly, particle size analysis (Figure S3 in Supporting Information) and zeta potential analysis (Figure S4 in Supporting Information) of GNBC measured after 30 days, 60 days, and 120 days show that the size remains almost same (below 10 nm) and zeta potential is almost same. This further confirms that the synthesized GNBCs are stable for long period of time.
Figure 1.
(A) UV–visible spectrophotometer of GNBC, (B) particle size distribution by DLS measurement, (C) representative TEM image of GNBC, (D) zeta potential measurement of GNBC.
Effects of the GNBC and Onion Peel Drug in the Cell Viability Assay of RAW 264.7 Macrophages
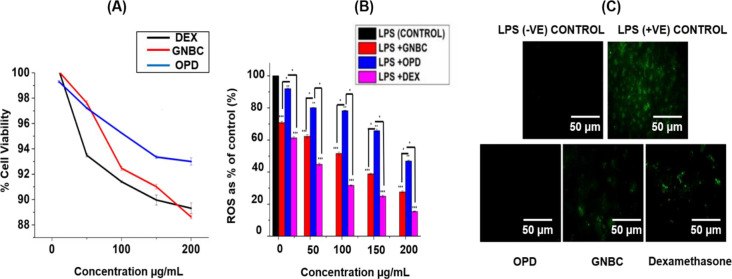
It is first important to check the cell viability of GNBC and onion peel drug (OPD) in the RAW 264.7 cell line. The cell viability assay has been performed along with the standard drug dexamethasone with 10, 50, 100, 150, and 200 μg/mL concentration for 24 h of the incubation period. Cell viability assays are essentially used for screening the response of the cells against a developed drug. The results showed that (Figure 2A) both OPD and GNBC exhibited good cell viability such as 99 and 100% at the lowest concentration (10 μg/mL) and 93 and 88.62% at the highest concentration (200 μg/mL), respectively. However, the standard drug dexamethasone showed 89% at 200 μg/mL. (Figure 2A). The superior cell viability of GNBC and OPD showed its biocompatible nature and safest therapeutic application in in vitro living organisms.
Figure 2.
(A) Cell viability of GNBC in RAW 264.7 cell line in comparison with standard dexamethasone drug and OPD (onion peel fractionate) (B) reactive oxygen species (ROS) scavenging assay in RAW 264.7 cells in bar diagram, (C) fluorescent images of ROS scavenging assay. Data represent the results of experiments conducted in triplicates, n = 3. Values are the mean ± standard deviation of three independent experiments. The statistical significance of the difference between treated and control groups was analyzed using one-way ANOVA followed by all pairwise multiple comparison procedures (Student–Newman–Keuls method). An asterisk (*) represents a significant difference when compared to control values at *p < 0.05 (*p < 0.05; **p < 0.01; ***p < 0.001).
Effects of GNBC and OPD in the Production of ROS in LPS Induced RAW 264.7 Macrophages
ROS generation is an indication of oxidative stress and progression of various inflammatory diseases and plays an important role in signaling molecules and a mediator of inflammation.21Figure 2B showed the gradual reduction of ROS generation with an increase in the concentration of GNBCs. The result showed that at the lowest concentration of10 μg/mL, GNBC and OPD showed 70.86% and 91.98% ROS generation, respectively. While at the highest concentration of 200 μg/mL, GNBC and OPD showed 27.57 and 46.88%, respectively, when compared with untreated control. However, the standard dexamethasone showed 61.26 and 15.36% ROS generation at 10 and 200 μg/mL concentrations, respectively. The reduction of ROS generation was also confirmed by fluorescent microscopy. Figure 2C shows the fluorescent microscope images of ROS production and subsequent visual decrease in ROS production in GNBC, OPD, and dexamethasone-treated cells as compared to control (untreated). It is clear from the fluorescent microscopic images that the GNBC is quite effective in decreasing ROS.
Cellular Uptake of GNBC by RAW 264.7 Cell
To establish an effective therapeutic efficacy, it is important to understand the interaction between the macrophages and GNBCs. Cellular uptake of the GNBC has been performed by both qualitative via fluorescent microscopy and quantitative measurement via flow cytometry. The GNBC was fluorescently labeled with rhodamine B (RhB) for quantifying the cellular uptake because an undraped metal nanoparticle does not possess fluorescent properties. The investigation has been carried out by considering different time intervals such as 0.5, 2, 4, 6, and 8 h under the serum-free medium conditions. Because the serum protein of media efficiently takes part in the “protein corona” formation. A group of proteins that binds to the surface of the nanoparticle is known as the protein corona, thereby causing changes in particle size and leading to some sort of magnificent inhibitory effect on the uptake of gold NPs by phagocytic cells.22 The time-dependent study is essential to examine how much time is required for saturation of RAW 264.7 cells by GNBCs.
Figure 3A,B shows fluorescent microscopy images of cells that have been stained with RhB labeled GNBC and with nuclear staining dye DAPI. It is evident from the images that cells showing their localization and merged images (Figure 3C) reveal that GNBCs are localized inside the cell reside nearby the nucleus where internalization of GNBCs occurrs gradually and it increases correspondingly when the incubation time increases from 0.5 to 8 h.
Figure 3.
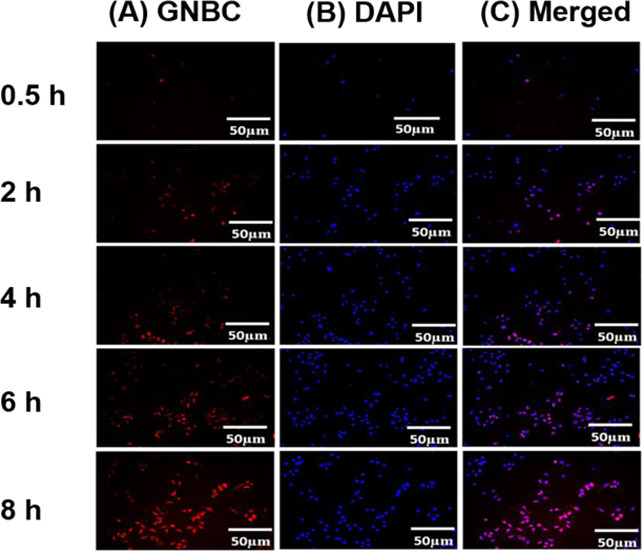
(A) Fluorescent microscopic images of RhB loaded GNBC (50 μg/mL) (red) in macrophages with different time intervals (0.5, 2, 4, 6 and 8 h). (B) Cells were stained with nuclear staining dye 4′,6-diamidino-2-phenylindole (DAPI) (blue) (C) merged images of GNBC and DAPI.
Although the side scattering channel (SSC) of flow cytometry has been used in the application of nanoparticle uptake because SSC indicates cellular granularity or cell’s internal complexity, however, Choi et al.(23) investigated some different aspects in SSC intensities regarding nanoparticle uptake. The SSC intensity enhancement depends on the surface charge of the nanoparticle. They showed that measuring side scattering for negatively charged nanoparticle uptake allowed a negligible change in SSC because the cell membrane exhibited a negative charge. Furthermore, an important observation was noticed where SSC intensities depend on the diameter of the particle size; the larger the particle size the more the intensities of SSC. However, the increase in intensities of SSC is due to the light scattering it depends on the size of the nanoparticle rather than the cumulation of nanoparticles inside the cell.
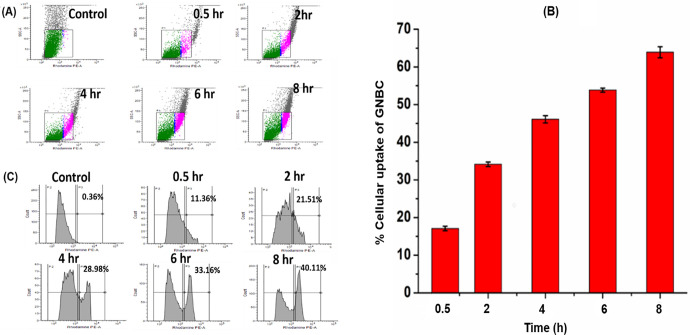
In this study, the side scattering of RAW 264.7 cells did not alter after the incorporation of GNBCs(Figure 4A), maybe because of negative surface charges and small size particles as shown by the zeta potential of GNBC Figure 1A,B and DLS measurement, respectively. On the other hand, the fluorescence intensities of GNBC-treated cells increase gradually with a longer incubation period from 0.5 to 8 h (Figure 3A). Therefore in this case, a fluorescence channel has been used to quantify the nanoparticle uptake instead of a side scatter channel.24
Figure 4.
(A) Side scatter plots of flow cytometry in RAW 264.7 macrophages incubated with 50 μg/mL RhB loaded GNBC for different hours (0.5, 2, 4, 6 and 8 h) (B) quantitative analysis of percentage cellular uptake in different hours (0.5, 2, 4, 6 and 8 h) (C) kinetics uptake of GNBCs via measuring of fluorescence intensity analyzed by flow cytometry.
Here, the uptake has been elucidated by quantifying the RhB-GNBC containing a percentage of cells compared with the control (untreated) cells. A significant change has been found in the fluorescent intensities which are significantly higher as compared to the control. Figure 4C indicates that during the uptake of the 0.5 h period, fluorescent hikes quickly 11.36% as compared to the control group (containing only bare RhB without GNBC/untreated). Likewise, the percentage increased gradually by 21.51, 28.98, 33.16, and 40.11% for 2, 4, 6, and 8 h, respectively. Figure 4B shows the percentage of cellular uptake that occurs gradually when increasing the incubation period which is maximum at 8 h 63.89 and 17% minimum uptake at 0.5 h. Hence, fluorescence intensity from the PE-A channel showed a shift to larger intensities in a time-dependent manner demonstrating RhB-GNBC cell uptake.
Effects of GNBC and OPD in the Production of Nitrite in LPS Induced RAW 264.7 Macrophages
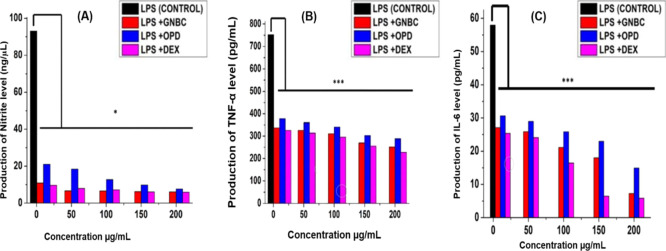
Next, we examined the efficacy of the GNBC and OPD against the production of nitrite. LPS is a well-known potent activator of inflammation by triggering the release of various cytokines from macrophages. It is a major component of Gram-negative bacteria which is found to be a common practice among researchers for checking anti-inflammatory drug analysis in RAW 264.7 macrophage cells as an in vitro model system. To examine the nitrite production level by the GNBC and OPD, cells were pre-incubated with 100 ng/mL LPS for 2 h before the incorporation of various concentrations (10, 50, 100, 150, and 200 μg/mL) of drug treatment. However, the result (Figure 5A) showed that GNBCs significantly reduced the nitrite production level up to 6.11 ng/μL at its highest concentration 200 μg/mL and is almost comparable with the standard drug dexamethasone which is 5.93 ng/μL at the same concentration. Similarly, the EA fraction of OPD showed a 7.63 ng/μL production at the respective concentration. Nevertheless, at a lower concentration, 10 μg/mL GNBC exhibited 10.88 ng/μL and dexamethasone possessed 9.59 ng/μL production whereas the OPD showed 20.97 ng/μL nitrite production in comparison with the control (without treatment contains only LPS) in a dose-dependent manner. Hence, it can be concluded that GNBCs showed significant nitrite reduction by producing very less nitrite level which can be compared with the standard drug dexamethasone even at the lowest concentration.
Figure 5.
(A) Nitrite production assay in LPS treated RAW cells (B,C) Effects of GNBC and OPD in the production of TNF-α and IL-6 in RAW 264.7 cells respectively. Cells were pretreated with LPS (100 ng/mL) for 4 h and then subjected to various concentrations (10, 50, 100, 150, and 200 μg/mL) of GNBC, OPD (EA onion peel fractionate), and a standard Dexamethasone drug. For 24 h. Control was kept untreated only stimulated with LPS alone. Data represent the results of experiments done in triplicates, n = 3. Values are the mean ± standard deviation of three independent experiments. The statistical significance of the difference between treated and control groups was analyzed using one-way ANOVA followed by all pairwise multiple comparison procedures (Student–Newman–Keuls method). An asterisk (*) represents a significant difference when compared to control values *p < 0.05, ***p < 0.001 vs the control group (LPS alone) (untreated group).
To ascertain the role of GNBCs in significant nitrite reduction, we examined the efficacy of gold NPs prepared from sodium borohydrate against the production of nitrite (Figure S1 in Supporting Information). It was observed that in same concentration range of LPS, it was not able to reduce nitrite, demonstrating the role of GNBCs.
Effects of GNBC and OPD on LPS-Induced Pro-Inflammatory Cytokine Production
To evaluate the pro-inflammatory cytokine production of GNBC and OPD, cell lysates were collected and ELISA was performed. It is evident from Figure 5B that at 10 μg/mL, GNBC and OPD showed 337 and 378 pg/mL TNF-α production, respectively, and has been markedly decreased at its high concentration (200 μg/mL) such as 251 and 288 pg/mL by GNBC and OPD, respectively.
Similarly, in IL-6 generation assay, the GNBC reduced the level production by 27.1 and 7.29 pg/mL at 10 and 200 μg/mL concentration, respectively, which is quite significant than OPD (30.64 pg/mL in 10 μg/mL and 14.92 pg/mL in 200 μg/mL doses) (Figure 5C).
However, at 200 μg/mL concentration, standard drug dexamethasone showed 228 and 5.84 pg/mL TNF-α and IL-6 production, respectively. The data clearly explain that the level of TNF-α and IL-6 were significantly low in all treated cells (GNBC, OPD, dexamethasone incubated with LPS) when compared to control (LPS alone).
Investigation of Internalization Pathway of GNBC
To attain an excellent therapeutic efficacy, the successful route of entry into the cells is very important for the nanoparticle to magnify the effect. The route of entry of nanoparticles often occurs via endocytosis which divides into four main pathways. Clathrin-dependent endocytosis, caveolae-dependent endocytosis, macropinocytosis, and phagocytosis.25 During endocytosis, nanoparticles may get absorbed and consumption by lysosomes often occurred which involved a complicated process.26 Internalization of a ligand is also a kind of endocytosis; and therefore, blocking pathways by using different endocytic inhibitors is thought to be the most feasible and straightforward method for checking the uptaking pathway.
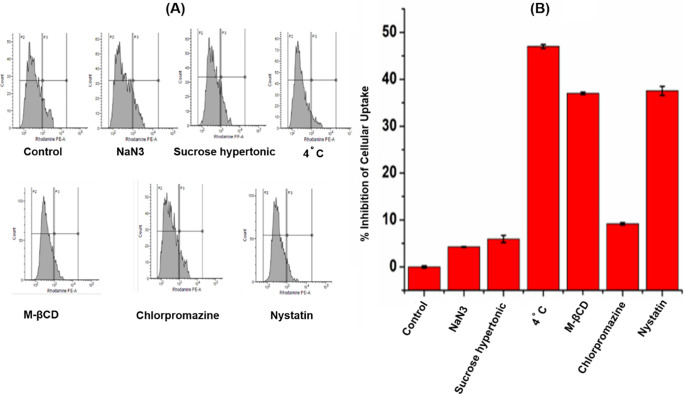
In general, almost entire endocytic pathways are involved in energy-dependent mechanisms and can be easily inhibited by applying various endocytic inhibitors and low-temperature treatments. To check whether the GNBC possessed active or passive uptake, here, RAW cells were first treated with 4 °C and then treated with various inhibitors each for specific pathways. Some conventional endocytic pathway inhibitors such as sodium azide (inhibits phagocytic pathway), hypertonic sucrose solution (inhibits the clathrin-dependent pathway), methyl-β-cyclodextrin (MβCD) (inhibits the caveolae-dependent pathway), Nystatin (inhibits the caveolae-dependent pathway), and chlorpromazine (inhibits the clathrin-dependent pathway) have been used to evaluate the uptake pathway. As shown in Figure 6A,B, cellular uptake is inhibited by 47% at 4 °C, which indicates the energy-dependent internalization process involved in the GNBC uptake. However, chlorpromazine and hypertonic sucrose solution showed insignificant inhibition by 9.19 and 5.94% which indicates the clathrin-mediated endocytosis pathway is not responsible for GNBC uptake. Likewise, sodium azide showed 4.25% inhibition that indicates that it is not completely responsible for a phagocytic pathway. On the other hand, among various inhibitors, MβCD and nystatin (inhibits the caveolin-dependent pathway) markedly reduced the uptake by showing 37 and 37.53% inhibition during the period; which can be recognized as a major internalization pathway. Therefore, the data indicate that the caveolin-dependent pathway significantly inhibits the GNBC uptake among the other pathways.
Figure 6.
(A) Histogram representation of cellular uptake mechanism in presence of different inhibitors (B) percentage inhibition of cellular uptake of GNBC.
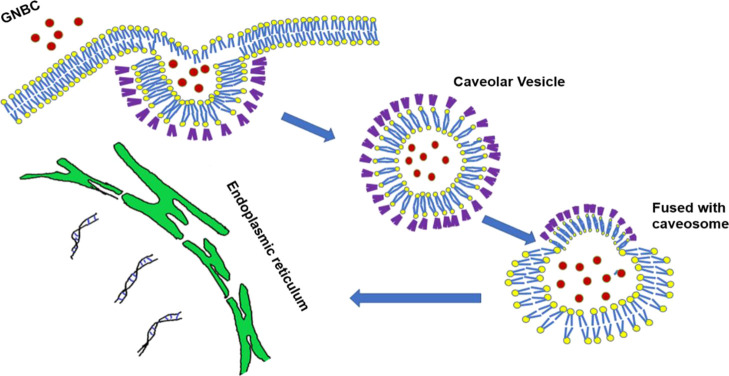
During the internalization via caveolae-dependent endocytosis, the plasma membrane fused with the caveosomes that occupied neutral pH27 and relatively takes longer time than the clathrin-mediated endocytosis and can directly transport the proteins or genes or bioactive molecules to the Golgi or endoplasmic reticulum bypassing the endosomal entrapment and preventing the lysosomal degradation which is followed by clathrin-mediated endocytosis.28 Nanomaterials in the endoplasmic reticulum can penetrate the cytosol and then enter the nucleus through nuclear pre complex. Thereby, the nanoparticle follows the caveolin-mediated endocytosis that can deliver the substances by escaping the lysosomal degradation and plays an important role in therapeutic delivery. The proposed mechanism of cellular internalization of GNBC through caveolar mediated endocytosis is shown in Figure 7.
Figure 7.
Mechanism of cellular internalization of GNBC through caveolar-mediated endocytosis by escaping the lysosomal encapsulation.
Moreover, the size and charge of the nanoparticle also influence the uptake mechanism. Because GNBCs exhibited 7.8 nm size and generally smaller size (60–80 nm) nanoparticles are more likely to be utilized by caveolin-mediated endocytosis.29 Previous studies have shown that gold NPs with (5, 20 nm) exhibited caveolin-dependent pathways.22
Among several factors, the surface charge of nanoparticles plays a significant role in the process of cellular uptake. The zeta potential showed that the uptake may be due to GNBC exhibiting a negative surface charge (−21.2 mV); thereby, they can interact with the cationic sites in the membrane via electrostatic interaction and lead to the formation of nanoparticle clusters.30 The electrostatic interaction further causes a localized neutralization of nanoparticle and lead to the curving of the cell membrane for utilization of endocytic cellular uptake.31 The substantial negative charge of the cell membrane domains and their interaction with the negative charge nanoparticle generates a repulsion force and may provide the fuel for the rapid internalization of the nanoparticle by the cells.32 Thereby, surface properties may influence the cellular uptake of nanoparticles and their intracellular distribution.33,34
Conclusions
In summary, in this work, facile synthesis of GNBC from EA fraction of onion peels was successfully demonstrated which played an important role by implementing the anti-inflammatory effect in RAW 264.7 cells. The GNBC has successfully reduced the pro-inflammatory cytokine production such as TNF- and IL-6, nitrite production level, and ROS generation by maintaining the good viability of RAW macrophage. Additionally, the cellular uptake mechanism of GNBC by fluorescent microscopy and flow cytometry reveals that nanoparticles can efficiently go into the cell and their accumulation inside the cell increases with an increasing incubation period and reside near the nucleus. Furthermore, inhibitors pathway blocking studies showed that GNBC utilized active or energy involving endocytosis pathway; where a caveolar-mediated endocytosis pathway takes place as a major route of nanoparticle uptake. However, extensive studies are required to investigate the behavior and interactions of nanoparticles inside the cell with different organelles for their commercial and efficient biomedical applications.
Materials and Methods
Reagents
The RAW 264.7 macrophage cell line was purchased from NCCS Pune, India. LPS was purchased from Sigma-Aldrich. Prolong gold antifade mountant with DAPI from Thermofisher Scientific, and paraformaldehyde was purchased from Merck. Gold(III) chloride trihydrate (HAuCl4·3H2O) was obtained from Himedia, Dulbecco’s modified Eagle’s medium (DMEM), antibiotic-antimycotic, fetal bovine serum (FBS), 3-(4,5-dimethylthiazol-2-yl)-2,5-diphenyltetrazolium bromide (MTT), dimethyl sulfoxide (DMSO), and Griess reagent were all purchased from Sigma-Aldrich. The mouse TNF-α and IL-6 ELISA kits were both purchased from Invitrogen. The other reagents for the experiments were of analytical grade and utilized as received. Ultrapure water produced from a Millipore-Q water purification system.
Instrumentations
The size and surface charge or zeta potential were measured by the Malvern Zetasizer Nano series, Nano-ZS90. Measurement of UV–vis spectrum was performed by using a Shimadzu UV 2600, UV–vis spectrophotometer. Detailed morphology was analyzed by a TEM JEOL 2100 plus instrument. Flow cytometry analyses were performed by BD FACS Melody. Cell imaging experiments were conducted by using fluorescent microscopy LEICA DMI3000 B.
Synthesis of GNBC
The preparation of GNBC was following by our earlier method20 where 2 mL (1 mg/mL) EA fraction of the onion peel extract was added in 10 mL of 1 mM concentration of gold chloride solution (gold chloride dissolved in sterile Milli-Q-water) for 10 min. During the period, the solution was placed at 33 °C on a magnetic stir and stirred vigorously until any color change appears. Finally, a ruby red-colored solution was obtained. Furthermore, the GNBC was found to be stable for several months and was preserved at 4 °C for various biological assays.
Synthesis of Gold NPs
Gold NPs have been prepared by adding 500 μL of 1 mM concentration of sodium borohydride dropwise in 4 mL of 1 mM concentration of gold chloride solution in a water medium. 2 mL of 2 mM trisodium citrate was added to the mixture as a stabilizing agent under vigorous stirring on a magnetic stir plate at room temperature. A fine pink color solution was obtained.
Cell Culture
RAW 264.7 cell line (macrophage) was obtained from National Centre for Cell Sciences (NCCS), Pune, India. Cells were cultured and maintained in DMEM (4.5 g/L) with 10% heat-inactivated FBS, 1% antibiotic–antimycotic, cultured in a T-75 cm2 flask, and kept at 37 °C in an incubator with 5% atmospheric CO2 and observed daily at an inverted microscope Leica DMi1.
Cell Viability Assay (MTT Assay)
2 × 10⁴ per well-seeding density were maintained for RAW 264.7 cells in a growth medium of 200 μL for 24 h incubation period. After the incubation period cells were treated with GNBCs, OPD, and the standard drug dexamethasone with varying concentrations (10, 50, 100, 150, and 200 μg/mL). The treated cells were then washed with phosphate buffer saline (PBS) and replaced the old media with fresh media and MTT was added to the cells for checking cell viability. Cells were kept in dark at 37 °C for a 4 h incubation period. After that, 100 μL of DMSO was added and immediately kept in dark for 2 h. An insoluble formazan product was formed and measurement of absorbance was conducted at 570 nm using a microplate reader. Untreated cells were considered as the control. The experiment was performed in triplicates. The percentage of cell viability was calculated by the following formula
Measurement of NO
RAW 264.7 cells were seeded with a density of 1 × 10⁵ per well and cultured in 6-well plates by maintaining 2 mL of total cell culture media. After 24 h of incubation at 37 °C, the cells were treated with the GNBC, OPD, gold NPs, and dexamethasone drug at various concentrations (10, 50, 100, 150, and 200 μg/mL) for 24 h in a serum-free medium, and subsequently 100 ng/mL LPS was added. After 2 h, cells were washed with PBS and the cell lysates were collected for the measurement of NO production using a nitrite assay kit (Sigma-Aldrich). Generation of NO was measured as the cumulation of nitrite metabolite and analyzed spectrophotometrically at an optical density of 540 nm absorbance using Griess reagent. The amount of nitrite production was calculated as follows
where ANO2– = amount of nitrite in the sample well (nmole) from nitrite standard curve. VNO2– = sample volume (μL) added into the well. CNO2– = concentration of nitrite in sample.
ROS Scavenging Assay
A ROS scavenging assay was performed by using 2′7′-dichlorodihydrofluorescein (DCF-DA) a cell-permeable fluorogenic probe that is deacetylated by the cellular esterases after their diffusion into the cells into a non-fluorescent compound; and later, in presence of oxidative compound such as intracellular ROS, it is oxidized to a bright fluorescent 2′,7′-dichlorofluorescein (DCF). RAW 264.7 cells were seeded with a density of 1 × 10⁵ cells per well in 96 well plates for 24 h. Then, the cells were treated with various concentrations (10, 50, 100, 150, and 200 μg/mL) of GNBC, OPD, and dexamethasone for another 24 h 100 ng/mL LPS was incorporated in the cells for 2 h. Untreated cells with 100 ng/mL LPS were remain kept as a positive control. Cells were washed two times with 1× PBS and 100 μM DCF-DA was added and incubated for 30 min at 37 °C CO2 incubators. The production of ROS was observed by an increase in the fluorescence intensity of DCF dye at 485 nm excitation and 535 nm emission by using a fluorescent plate reader. The amount of ROS production was calculated by the following formula % of ROS control = (Treatment-blank/control) ×100, treatment = drug-treated cells, blank = cells with PBS solution only, control = cells with DCFDA without drug or treated compounds.
Measurement of Pro-Inflammatory Cytokine Expression
Macrophages (RAW 264.7) were seeded at a density of 1 × 10⁵ cells/well in 6 well plates. Cells were pretreated with different concentrations of GNBC, OPD, and dexamethasone for 24 h, after being washed with PBS cells were introduced with 100 ng/mL LPS for 4 h. Afterward, the cell lysates were collected carefully from the plate and measured the production of mouse TNF-α, and IL-6 using an ELISA kit according to the manufacturer’s (Sigma-Aldrich) protocol. The amount of TNF-α and IL-6 production was obtained from standards by plotting a standard curve.
Cellular Uptake of GNBCs by a Flow Cytometer
To know the localization and detail internalization, nanoparticles were analyzed via both quantitative and qualitative methods by flow cytometry and fluorescent microscopy, respectively. For the fluorescent detection of nanoparticles, 100 μL of RhB (1 mg/mL) solution in PBS was dropwise mixed with 5 mL of GNBC solution under the ambient temperature and kept in magnetic stirring at 400 rpm for 24 h in dark for preventing photobleaching.35 The loaded RhB-GNBC were then separated from unloaded RhB by performing centrifugation at 6000 rpm for 30 min, and several times of washing steps have been performed for the release of excessive dyes. The RhB loading was investigated by both UV–visible spectra and fluorometry analysis. The cells were then seeded in a 6-well plate at a density of 1 × 10⁵ cells/well and cultured for 24 h. Then, cells were treated with 50 μg/mL RhB loaded GNBC B solution for different time intervals such as 0.5, 2, 4, 6, and 8 h. After each time interval, cells were washed twice with 1× PBS to remove unbound nanoparticles that may remain in the cell surface and culture media. Then, cell lysates were collected with scrappers and kept at 4 °C until flow cytometry analysis. GNBC uptake was analyzed by using BD FACS melody. Untreated cells were used as the control.
Mechanism of Cellular Uptake Pathway Studies
To investigate the internalization pathway of GNBC; cells were preincubated with different types of specific endocytic inhibitors.36 Inhibitors are, namely, 3 mg/mL of sodium azide (NaN3), 0.5 M hypertonic sucrose solution, 10 μg/mL of chlorpromazine (CPZ), 5 mg/mL of methyl β-cyclodextrin (MβCD) 50 μg/mL nystatin, and 4 °C temperature effect was also analyzed. Then, cells were washed thoroughly to remove the inhibitor effect and treated with GNBC (50 μg/mL) for 3 h in serum-free DMEM media. After the incubation period, cells were washed repeatedly for two times and quantified by FACS melody.
Qualitative Analysis by Fluorescent Microscopy
RAW 264.7 cells were seeded at 1 × 10⁵ cells/well over the sterile coverslips in 6 well plates and incubated for 24 h. Cells were then washed with sterile 1× PBS and treated with GNBC (50 μg/mL) for different time intervals including 0.5, 2, 4, 6, and 8 h kept at 37 °C of 5% CO2 incubator. Cells were then fixed with 4% paraformaldehyde for 10 min and stained with a prolong DAPI antifade mounting stain (Invitrogen) for mounting the coverslips. The cells were then imaged and visualized with a LEICA DMI3000 B fluorescent microscope.
Statistical Analysis
Data of all results were presented as mean ± standard deviation of three independent experiments statistical analysis was analyzed by using Sigma Plot 12. Software. In the graphical data, standard deviations were presented as error bars. One way ANOVA test was performed followed by all pairwise multiple comparison procedures (Student–Newman–Keuls method). Statistical significant difference was indicated as (*) and shown when treated group compared to control and values at *p < 0.05 (*p < 0.05; **p < 0.01; ***p < 0.001).
Acknowledgments
K.P. wants to thank the Council of Scientific and Industrial Research (CSIR), New Delhi for the fellowship. The authors thank IASST for the in-house project and SAIF, IASST for the instrumentation facility.
Supporting Information Available
The Supporting Information is available free of charge at https://pubs.acs.org/doi/10.1021/acsomega.1c06131.
Comparison of nitrite production assay in LPS-treated RAW cells by GNBC and gold NPs, TEM analysis, DLS analysis of GNBC during different periods of interval, and particle size and zeta potential of GNBC at different time intervals up to 120 days (PDF)
Author Contributions
The manuscript was written through the contributions of all authors. All authors have approved the final version of the manuscript.
The authors declare no competing financial interest.
Supplementary Material
References
- Wellen K. E.; Hotamisligil G. S. Inflammation, stress, and diabetes. J. Clin. Invest. 2005, 115, 1111–1119. 10.1172/jci25102. [DOI] [PMC free article] [PubMed] [Google Scholar]
- Galli S. J.; Grimbaldeston M.; Tsai M. Immunomodulatory mast cells: negative, as well as positive, regulators of immunity. Nat. Rev. Immunol. 2008, 8, 478–486. 10.1038/nri2327. [DOI] [PMC free article] [PubMed] [Google Scholar]
- Hofseth L. J.; Ying L. Identifying and defusing weapons of mass inflammation in carcinogenesis. Biochim. Biophys. Acta 2006, 1765, 74–84. 10.1016/j.bbcan.2005.08.005. [DOI] [PubMed] [Google Scholar]
- Leung D. Atopic dermatitis: the skin as a window into the pathogenesis of chronic allergic diseases. J. Allergy Clin. Immunol. 1995, 96, 302–319. 10.1016/s0091-6749(95)70049-8. [DOI] [PubMed] [Google Scholar]
- Förstermann U.; Sessa W. C. Nitric oxide synthases: regulation and function. Eur. Heart J. 2011, 33, 829–837. 10.1093/eurheartj/ehr304. [DOI] [PMC free article] [PubMed] [Google Scholar]
- Rushworth S. A.; Chen X.-L.; Mackman N.; Ogborne R. M.; O’Connell M. A. Lipopolysaccharide-induced heme oxygenase-1 expression in human monocytic cells is mediated via Nrf2 and protein kinase C. J. Immunol. 2005, 175, 4408–4415. 10.4049/jimmunol.175.7.4408. [DOI] [PubMed] [Google Scholar]
- Hewett J. A.; Roth R. A. Hepatic and extrahepatic pathobiology of bacterial lipopolysaccharides. Pharmacol. Rev. 1993, 45, 382–411. [PubMed] [Google Scholar]
- Gülşen A.; Makris D. P.; Kefalas P. Biomimetic oxidation of quercetin: isolation of a naturally occurring quercetin heterodimer and evaluation of its in vitro antioxidant properties. Food Res. Int. 2007, 40, 7–14. 10.1016/j.foodres.2006.07.009. [DOI] [Google Scholar]
- Prakash D.; Upadhyay G.; Singh B. N.; Singh H. B. Antioxidant and free radical-scavenging activities of seeds and agri-wastes of some varieties of soybean (Glycine max). Food Chem. 2007c, 104, 783–790. 10.1016/j.foodchem.2006.12.029. [DOI] [Google Scholar]
- Teixeira S.; Siquet C.; Alves C.; Boal I.; Marques M. P.; Borges F.; Lima J. L. F. C.; Reis S. Structure-property studies on the antioxidant activity of flavonoids present in diet. Free Radical Biol. Med. 2005, 39, 1099–1108. 10.1016/j.freeradbiomed.2005.05.028. [DOI] [PubMed] [Google Scholar]
- Verri W. A.; Vicentini F. T. M. C.; Baracat M. M.; Georgetti S. R.; Cardoso R. D. R.; Cunha T. M.; Ferreira S. H.; Cunha F. Q.; Fonseca M. J. V.; Casagrande R. Flavonoids as Anti-Inflammatory and Analgesic Drugs: Mechanisms of Action and Perspectives in the Development of Pharmaceutical Forms. Stud. Nat. Prod. Chem. 2012, 36, 297–330. 10.1016/b978-0-444-53836-9.00026-8. [DOI] [Google Scholar]
- Prakash D.; Singh B. N.; Upadhyay G. Antioxidant and free radical scavenging activities of phenols from onion (Allium cepa). Food Chem. 2007a, 102, 1389–1393. 10.1016/j.foodchem.2006.06.063. [DOI] [Google Scholar]
- Balasenthil S.; Arivazhagan S.; Ramachandran C. R.; Ramachandran V.; Nagini S. Chemopreventive potential of neem (Azadirachta indica) on 7,12-dimethylbenz[a]anthracene (DMBA) induced hamster buccal pouch carcinogenesis. J. Ethnopharmacol. 1999, 67, 189–195. 10.1016/s0378-8741(99)00015-x. [DOI] [PubMed] [Google Scholar]
- Valko M.; Leibfritz D.; Moncol J.; Cronin M. T. D.; Mazur M.; Telser J. Free radicals and antioxidants in normal physiological functions and human disease. Int. J. Biochem. Cell Biol. 2007, 39, 44–84. 10.1016/j.biocel.2006.07.001. [DOI] [PubMed] [Google Scholar]
- Singh P.; Kim Y. J.; Singh H.; Wang C.; Hwang K. H.; Farh M.; Yang D. C. Biosynthesis, characterization, and antimicrobial applications of silver nanoparticles. Int. J. Nanomed. 2015, 10, 2567–2577. 10.2147/IJN.S72313. [DOI] [PMC free article] [PubMed] [Google Scholar]
- Singh P.; Kim Y. J.; Yang D. C. A strategic approach for rapid synthesis of gold and silver nanoparticles byPanax ginsengleaves. Artif. Cells, Nanomed., Biotechnol. 2015, 44, 1949–1957. 10.3109/21691401.2015.1115410. [DOI] [PubMed] [Google Scholar]
- Singh P.; Kim Y. J.; Singh H.; Mathiyalagan R.; Wang C.; Yang D. C. Biosynthesis of Anisotropic Silver Nanoparticles byBhargavaea indicaand Their Synergistic Effect with Antibiotics against Pathogenic Microorganisms. J. Nanomater. 2015, 2015, 234741. 10.1155/2015/234741. [DOI] [Google Scholar]
- Kwak J.-H.; Seo J. M.; Kim N.-H.; Arasu M. V.; Kim S.; Yoon M. K.; Kim S.-J. Variation of quercetin glycoside derivatives in three onion (Allium cepa L.) varieties. Saudi J. Biol. Sci. 2017, 24, 1387–1391. 10.1016/j.sjbs.2016.05.014. [DOI] [PMC free article] [PubMed] [Google Scholar]
- Rawat K. A.; Kailasa S. K. Visual detection of arginine, histidine and lysine using quercetin-functionalized gold nanoparticles. Microchim. Acta 2014, 181, 1917–1929. 10.1007/s00604-014-1294-6. [DOI] [Google Scholar]
- Phukan K.; Devi R.; Chowdhury D. Green Synthesis of Gold Nano-bioconjugates from Onion Peel Extract and Evaluation of Their Antioxidant, Anti-inflammatory, and Cytotoxic Studies. ACS Omega 2021, 6, 17811–17823. 10.1021/acsomega.1c00861. [DOI] [PMC free article] [PubMed] [Google Scholar]
- Mittal M.; Siddiqui M. R.; Tran K.; Reddy S. P.; Malik A. B. Reactive oxygen species in inflammation and tissue injury. Antioxid. Redox Signaling 2014, 20, 1126–1167. 10.1089/ars.2012.5149. [DOI] [PMC free article] [PubMed] [Google Scholar]
- Cheng X.; Tian X.; Wu A.; Li J.; Tian J.; Chong Y.; Chai Z.; Zhao Y.; Chen C.; Ge C. Protein Corona Influences Cellular Uptake of Gold Nanoparticles by Phagocytic and Nonphagocytic Cells in a Size-Dependent Manner. ACS Appl. Mater. Interfaces 2015, 7, 20568–20575. 10.1021/acsami.5b04290. [DOI] [PubMed] [Google Scholar]
- Choi S. Y.; Yang N.; Jeon S. K.; Yoon T. H. Semi-quantitative estimation of cellular SiO2 nanoparticles using flow cytometry combined with X-ray fluorescence measurements. Cytometry, Part A 2014, 85, 771–780. 10.1002/cyto.a.22481. [DOI] [PubMed] [Google Scholar]
- Shin H.; Kwak M.; Lee T. G.; Lee J. Y. Quantifying the level of nanoparticle uptake in mammalian cells using flow cytometry. Nanoscale 2020, 12, 15743–15751. 10.1039/d0nr01627f. [DOI] [PubMed] [Google Scholar]
- Zhao J.; Stenzel M. H. Entry of nanoparticles into cells: the importance of nanoparticle properties. Polym. Chem. 2018, 9, 259–272. 10.1039/c7py01603d. [DOI] [Google Scholar]
- Sharma S.; Sinha V. R. Current pharmaceutical strategies for efficient site specific delivery in inflamed distal intestinal mucosa. J. Controlled Release 2018, 272, 97–106. 10.1016/j.jconrel.2018.01.003. [DOI] [PubMed] [Google Scholar]
- Parton R. G.; Simons K. The multiple faces of caveolae. Nat. Rev. Mol. Cell Biol. 2007, 8, 185–194. 10.1038/nrm2122. [DOI] [PubMed] [Google Scholar]
- Khalil I. A.; Kogure K.; Akita H.; Harashima H. Uptake pathways and subsequent intracellular trafficking in nonviral gene delivery. Pharmacol. Rev. 2006, 58, 32–45. 10.1124/pr.58.1.8. [DOI] [PubMed] [Google Scholar]
- Yamada E. The fine structure of the gall bladder epithelium of the mouse. J. Biophys. Biochem. Cytol. 1955, 1, 445–458. 10.1083/jcb.1.5.445. [DOI] [PMC free article] [PubMed] [Google Scholar]
- Patil S.; Sandberg A.; Heckert E.; Self W.; Seal S. Protein adsorption and cellular uptake of cerium oxide nanoparticles as a function of zeta potential. Biomaterials 2007, 28, 4600–4607. 10.1016/j.biomaterials.2007.07.029. [DOI] [PMC free article] [PubMed] [Google Scholar]
- Win K. Y.; Feng S.-S. Effects of particle size and surface coating on cellular uptake of polymeric nanoparticles for oral delivery of anticancer drugs. Biomaterials 2005, 26, 2713–2722. 10.1016/j.biomaterials.2004.07.050. [DOI] [PubMed] [Google Scholar]
- Limbach L. K.; Li Y.; Grass R. N.; Brunner T. J.; Hintermann M. A.; Muller M.; Gunther D.; Stark W. J. Oxide nanoparticle uptake in human lung fibroblasts: effects of particle size, agglomeration, and diffusion at low concentrations. Environ. Sci. Technol. 2005, 39, 9370–9376. 10.1021/es051043o. [DOI] [PubMed] [Google Scholar]
- Nam H. Y.; Kwon S. M.; Chung H.; Lee S.-Y.; Kwon S.-H.; Jeon H.; Kim Y.; Park J. H.; Kim J.; Her S.; Oh Y.-K.; Kwon I. C.; Kim K.; Jeong S. Y. Cellular uptake mechanism and intracellular fate of hydrophobically modified glycol chitosan nanoparticles. J. Controlled Release 2009, 135, 259–267. 10.1016/j.jconrel.2009.01.018. [DOI] [PubMed] [Google Scholar]
- Cheng H.; Zhu J.-L.; Zeng X.; Jing Y.; Zhang X.-Z.; Zhuo R.-X. Targeted Gene Delivery Mediated by Folate-polyethylenimine-block-poly(ethylene glycol) with Receptor Selectivity. Bioconjugate Chem. 2009, 20, 481–487. 10.1021/bc8004057. [DOI] [PubMed] [Google Scholar]
- Jaworska A.; Wojcik T.; Malek K.; Kwolek U.; Kepczynski M.; Ansary A. A.; Chlopicki S.; Baranska M. Rhodamine 6G conjugated to gold nanoparticles as labels for both SERS and fluorescence studies on live endothelial cells. Microchim. Acta 2015, 182, 119–127. 10.1007/s00604-014-1307-5. [DOI] [PMC free article] [PubMed] [Google Scholar]
- Singh R. P.; Ramarao P. Cellular uptake, intracellular trafficking and cytotoxicity of silver nanoparticles. Toxicol. Lett. 2012, 213, 249–259. 10.1016/j.toxlet.2012.07.009. [DOI] [PubMed] [Google Scholar]
Associated Data
This section collects any data citations, data availability statements, or supplementary materials included in this article.


