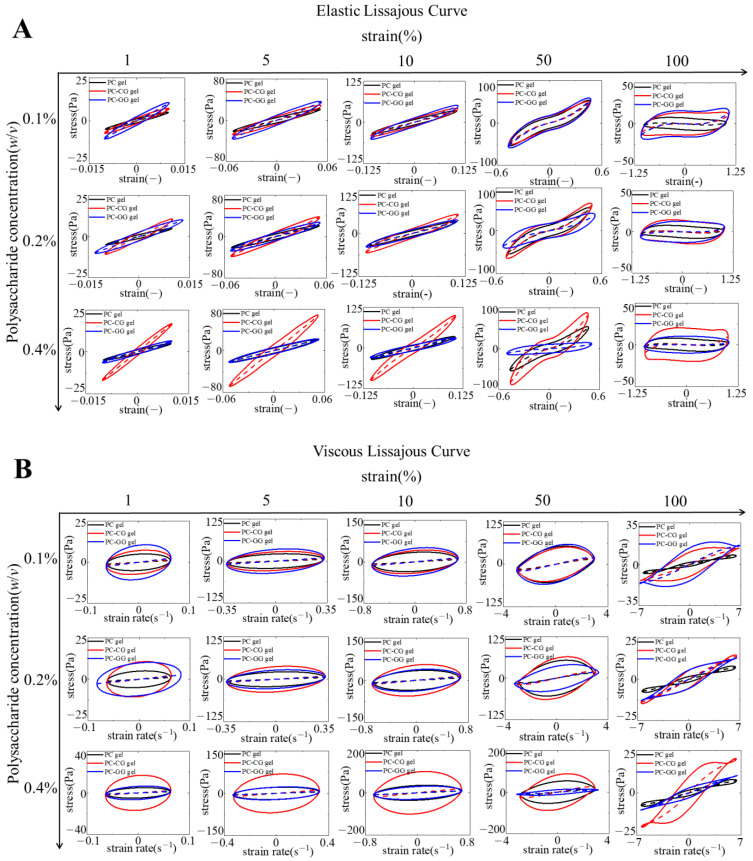
Figure 2.
When the strain amplitudes are 1%, 5%, 10%, 50%, and 100%, the elastic Lissajous curve (A) and the viscous Lissajous curve (B) of 16% PC thermal gels, PC-CG gels, and PC-GG gels, where the black line represents 16% PC thermal gels, the red line represents PC-CG gels, and the blue line represents PC-GG gels. The solid lines represent the total stress, and the dashed lines represent the elastic stress component (A) and the viscous stress component (B).

