Abstract
Objective
Delineating swallowing and chewing structures aids in radiotherapy (RT) treatment planning to limit dysphagia, trismus, and speech dysfunction. We aim to develop an accurate and efficient method to automate this process.
Approach:
CT scans of 242 head and neck (H&N) cancer patients acquired from 2004–2009 at our institution were used to develop auto-segmentation models for the masseters, medial pterygoids, larynx, and pharyngeal constrictor muscle using DeepLabV3+. A cascaded architecture was used, wherein models were trained sequentially to spatially constrain each structure group based on prior segmentations. Additionally, an ensemble of models, combining contextual information from axial, coronal, and sagittal views was used to improve segmentation accuracy. Prospective evaluation was conducted by measuring the amount of manual editing required in 91 H&N CT scans acquired February-May 2021.
Main results
Medians and inter-quartile ranges of Dice Similarity Coefficients (DSC) computed on the retrospective testing set (N=24) were 0.87 (0.85–0.89) for the masseters, 0.80 (0.79– 0.81) for the medial pterygoids, 0.81 (0.79–0.84) for the larynx, and 0.69 (0.67–0.71) for the constrictor. Auto-segmentations, when compared to inter-observer variability in 10 randomly selected scans, showed better agreement (DSC) with each observer as compared to inter-observer DSC. Prospective analysis showed most manual modifications needed for clinical use were minor, suggesting auto-contouring could increase clinical efficiency. Trained segmentation models are available for research use upon request via https://github.com/cerr/CERR/wiki/Auto-Segmentation-models.
Significance
We developed deep learning-based auto-segmentation models for swallowing and chewing structures in CT and demonstrated its potential for use in treatment planning to limit complications post-RT. To the best of our knowledge, this is the only prospectively-validated deep learning-based model for segmenting chewing and swallowing structures in CT. Additionally, the segmentation models have been made open-source to facilitate reproducibility and multi-institutional research.
Keywords: Deep learning, auto-segmentation, swallowing and chewing structures, dysphagia, trismus
1. INTRODUCTION
Delineating organs at risk (OAR) is central in radiotherapy (RT) treatment planning to limit subsequent normal tissue complications. Manual delineation is time-consuming, subjective, and error-prone due to organ complexity and level of experience [1]. Introducing new OARs would also encumber an already busy clinic. Automation to generate accurate and reproducible segmentations is, therefore, of utmost importance.
In head and neck (H&N) cancer treatment, isolating the larynx and pharyngeal constrictor muscle is of particular interest to curtail speech dysfunction and dysphagia following RT [2] [3]. The masseters and medial pterygoids have further been identified as critical structures in limiting radiation-induced trismus [4]. But delineating these structures is challenging due to their complex morphology and low soft-tissue contrast in CT images.
Few semi-automatic and automatic methods have been developed to segment OARs in the H&N. Conventional multi-atlas-based auto-segmentation (MABAS) methods involve propagating and combining manual segmentations from a curated library of CT scans through image registration as in [5] and [6]. Refinement strategies include using organ-specific intensity [7], texture [8], or shape representation models [9]. However, MABAS is sensitive to inter-subject anatomical variations and image artifacts, and registration is computationally intensive even with efficient implementations [10]. In H&N CT scans, commonly-used similarity metrics (mean squares, correlation coefficient, mutual information etc.) for registration are susceptible to intensity distortion due to dental artifacts.
Convolutional neural networks (CNNs) have recently emerged as effective tools for medical image segmentation. Ibragimov et al. [11] trained 13 CNNs, applied in sliding-window fashion to segment H&N OARs including the larynx and pharynx. In [12], Ward van Rooij et al. employed the popular 3D U-net [13] architecture to segment H&N OARs including the constrictor. Zhu et al. [10] extended the U-Net using squeeze-and excitation residual blocks and a modified loss function to improve segmentation of smaller OARs. In [14], Tong et al. trained a fully convolutional neural net, incorporating prior information to regularize shape characteristics of H&N OARs. The FocusNet [15] developed by Gao et al. uses multiple CNNs to segment OARs including the larynx, first segmenting large structures, then applying specially-designed sub-networks for smaller structures. In this work, we introduce a fully automatic CNN-based method to segment swallowing and chewing OARs and investigate its clinical applicability. To the best of our knowledge, this is the first [16] deep learning-based segmentation method to target chewing structures in CT. A cascaded architecture is proposed, wherein DeepLabV3+ models are trained sequentially to localize morphologically-complex structures based on boundaries of more easily identifiable structures. We also investigate the advantages of model ensembles using three orthogonal views over single-view models.
2. MATERIALS AND METHODS
2.1. Dataset
CT scans of 242 oropharyngeal cancer patients with retrievable dose plans, acquired retrospectively (2004–2009) for treatment planning, were accessed under internal review board-approved studies (IRB#16–1488 and #17–017). This included images acquired on GE (30%) and Philips (70%) scanners with a kilovoltage peak (kVp) range of 120–140. Patients were randomly partitioned into training (N=194), validation (N=24), and testing (N=24) sets. Manual segmentations of the masseters, medial pterygoids, larynx, and constrictor were generated using a legacy in-house treatment planning system (Figure 1). This occasionally resulted in jagged contours, particularly for the larynx. Contours of the larynx were available in all scans, masseters and medial pterygoids in 60% of scans, and constrictor in 97% of the scans. Representative CT images showing considerable variation in head pose, shape, and appearance around the structures of interest, including slices with artifacts due to dental implants, were included in the dataset. Additional patient characteristics are provided in [17,18].
Figure 1.
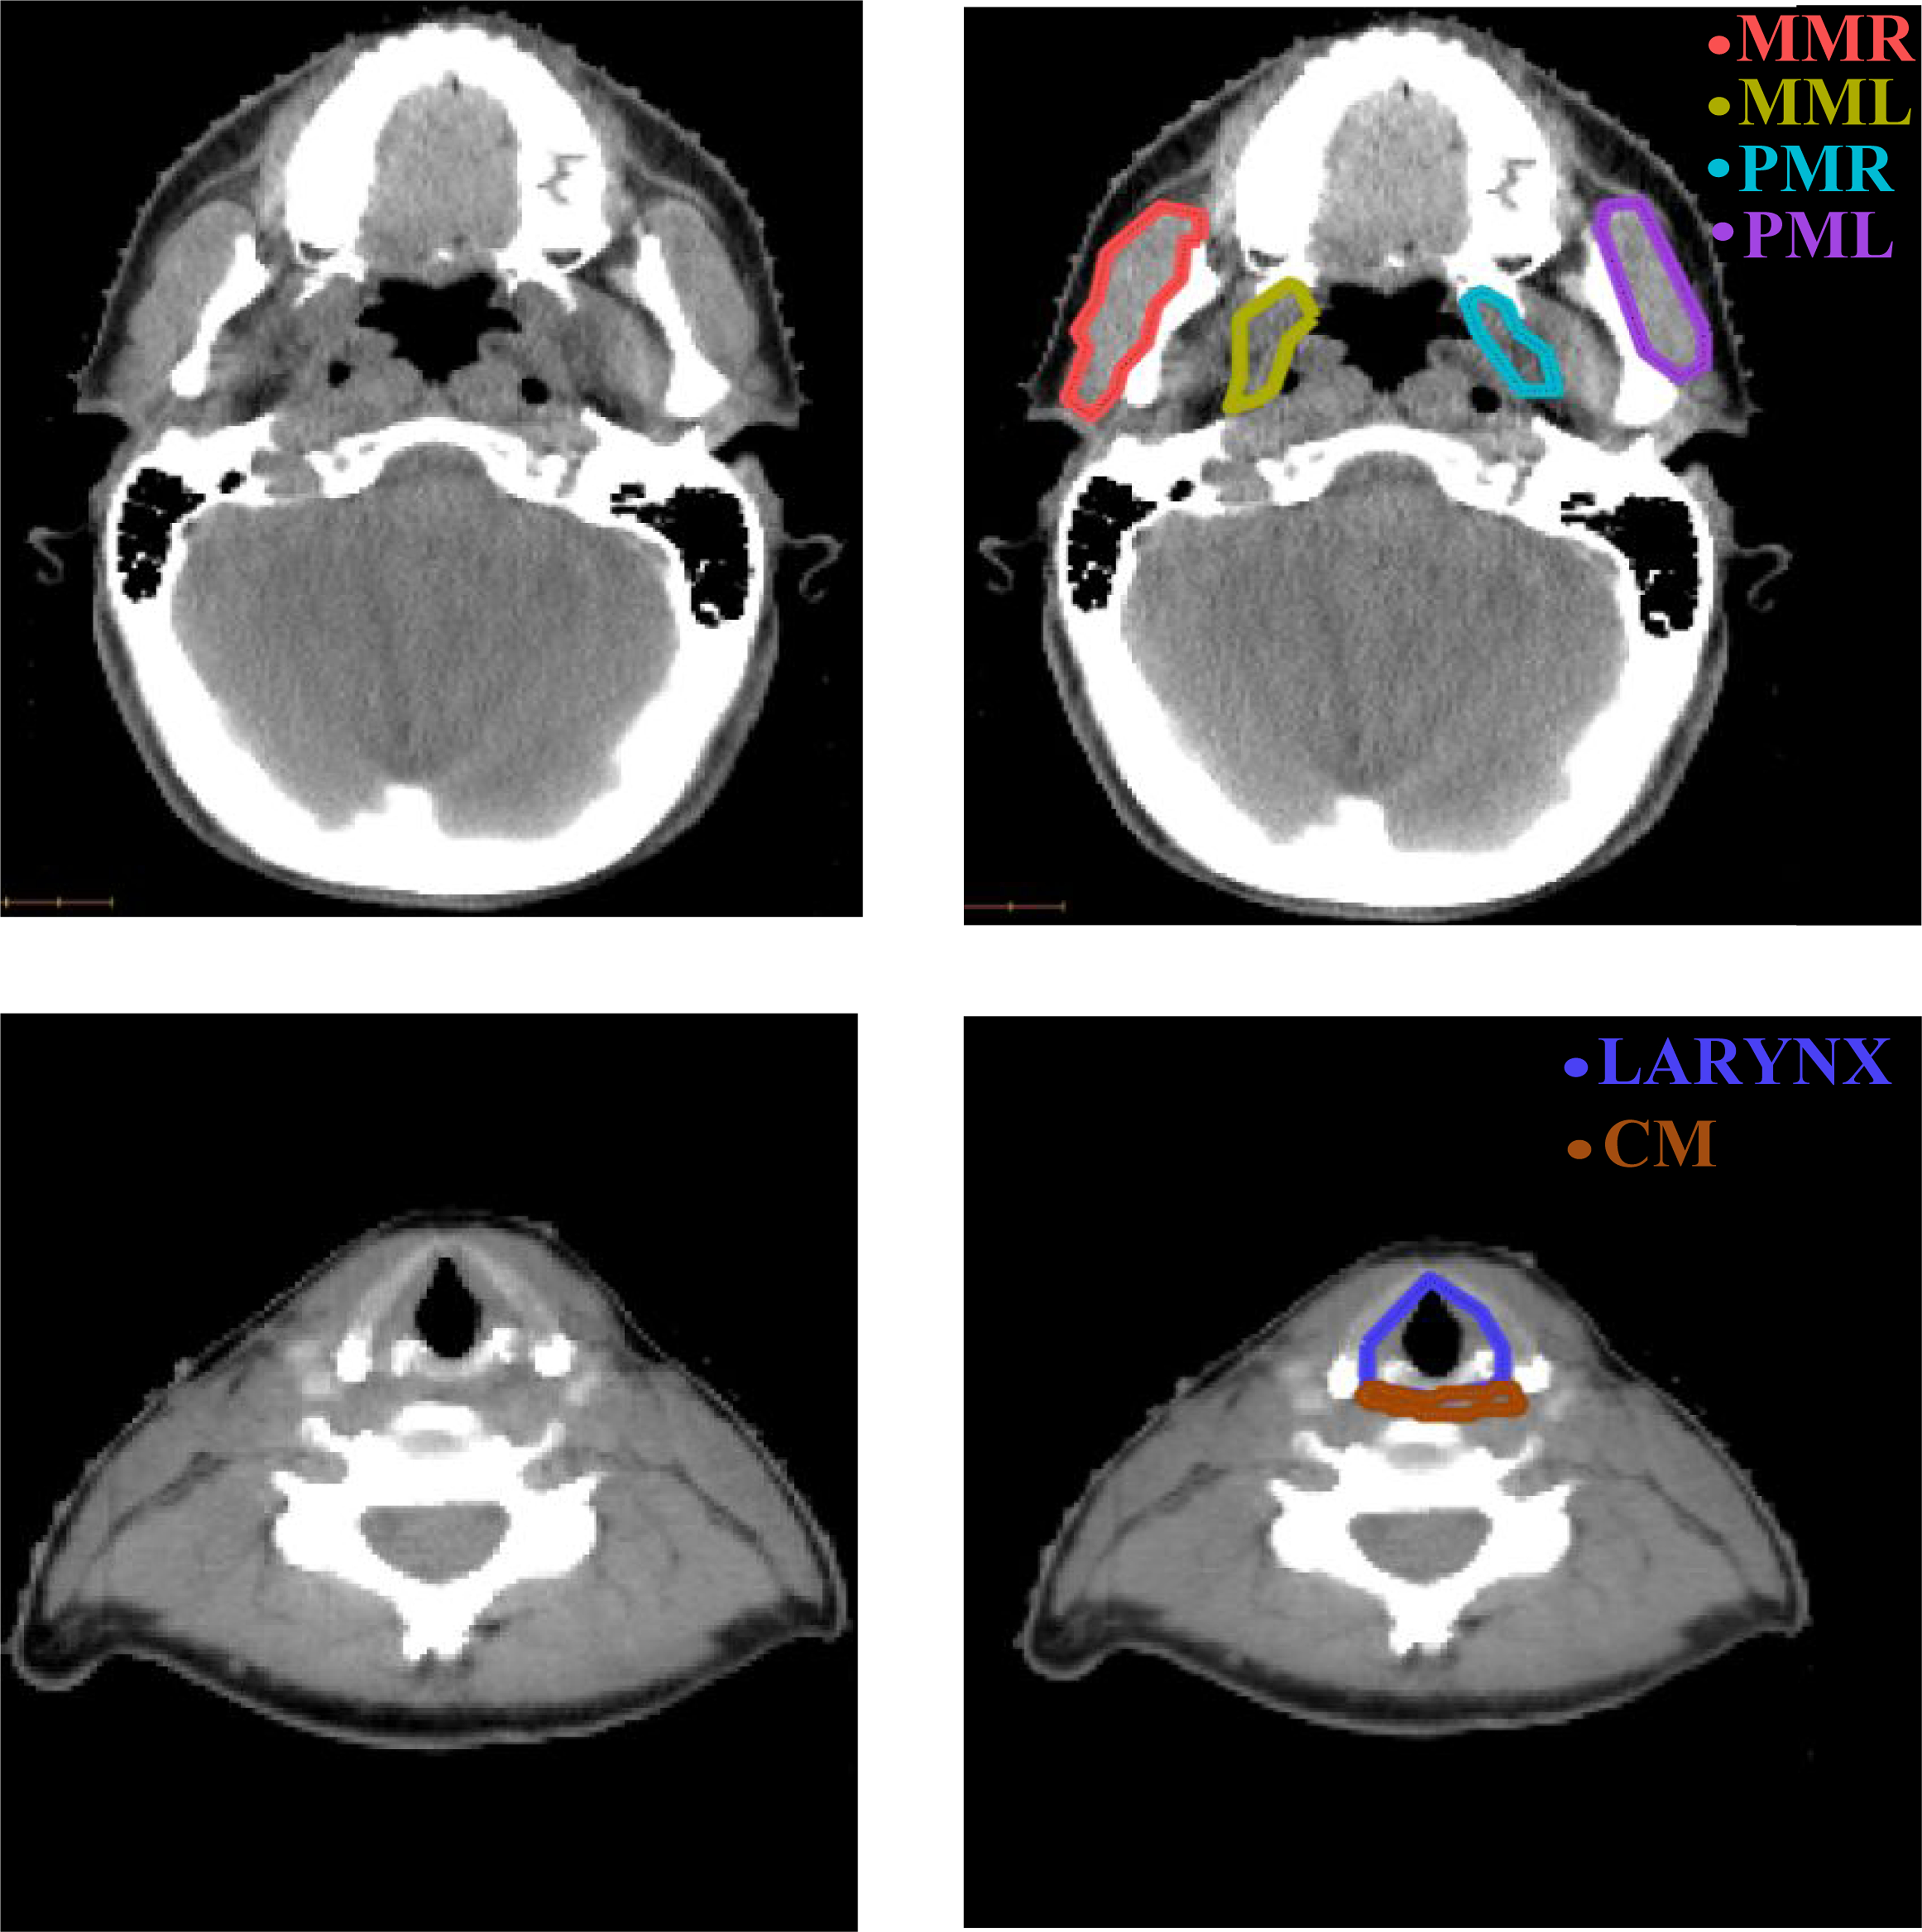
Sample axial slices of H&N CT scans (left) and manual segmentations of the chewing and swallowing structures (right) used for training. MML, MMR: masseters (left and right), PML, PMR: medial pterygoids (left and left and right), CM: constrictor muscle.
Prospective evaluation was conducted on a dataset of 91 scans acquired on GE (41%) and Philips (59%) scanners with kVp=120 from February-May 2021 at our institution. This included contrast-enhanced (16%) and non-enhanced (84%) scans, acquired using standard (41%) and bone (59%) convolution kernels respectively. Convolution kernels and contrast enhancement were not retrievable for retrospective data. Auto-segmentation performance was evaluated under IRB#16–1488 and #17–017 by measuring the amount of manual editing required for RT treatment planning. Edited contours of the masseters were available on 70 scans, medial pterygoids on 64 (left) and 66 (right) scans, and constrictor on 27 scans. Scan resolution characteristics for retrospective and prospective datasets are summarized in supplementary table A1.
2.2. Pre-processing
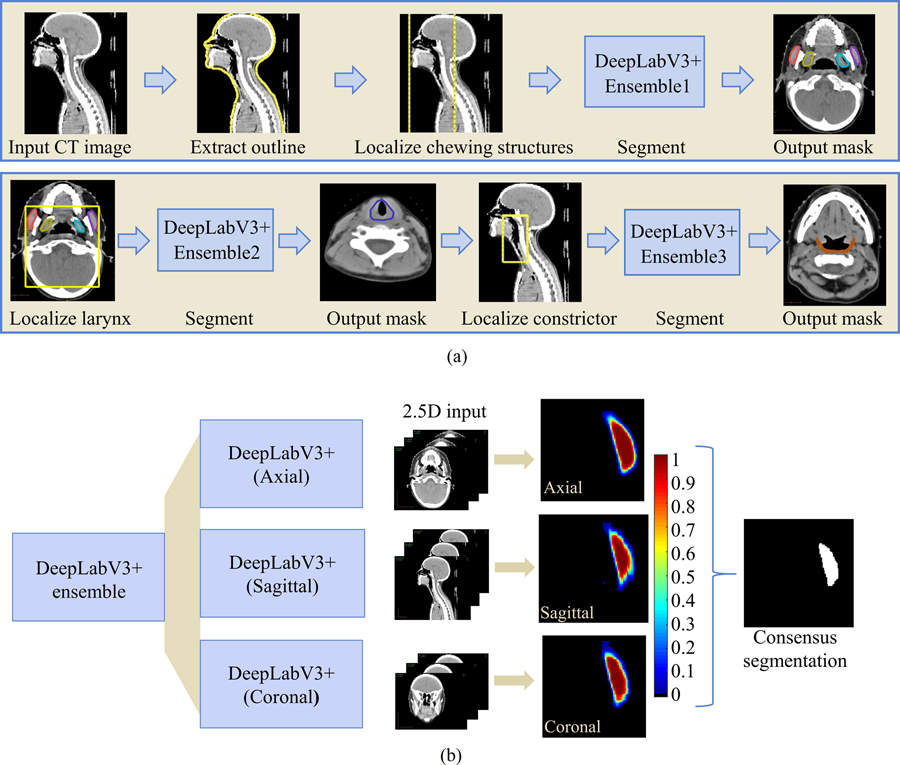
A multi-label model was trained to segment the chewing structures. CT scans were automatically cropped by generating a bounding box around the patient’s outline (Figure 2a) and limiting its posterior extent by 25% (Figure 2b). Axial, sagittal, and coronal images and masks of the chewing structures were extracted within these extents. To localize the larynx, anterior, left, right, and superior limits were determined based on the extents of the previously-detected chewing structures. (Figure 2c). The constrictor was localized using anterior, left, right, and superior limits of the chewing structures. Its posterior and inferior limits were defined by corresponding extents of the larynx, with sufficient padding (Figure 2d). Data preprocessing was performed using the Computational Environment for Radiological Research (CERR) [19]).
Figure 2.
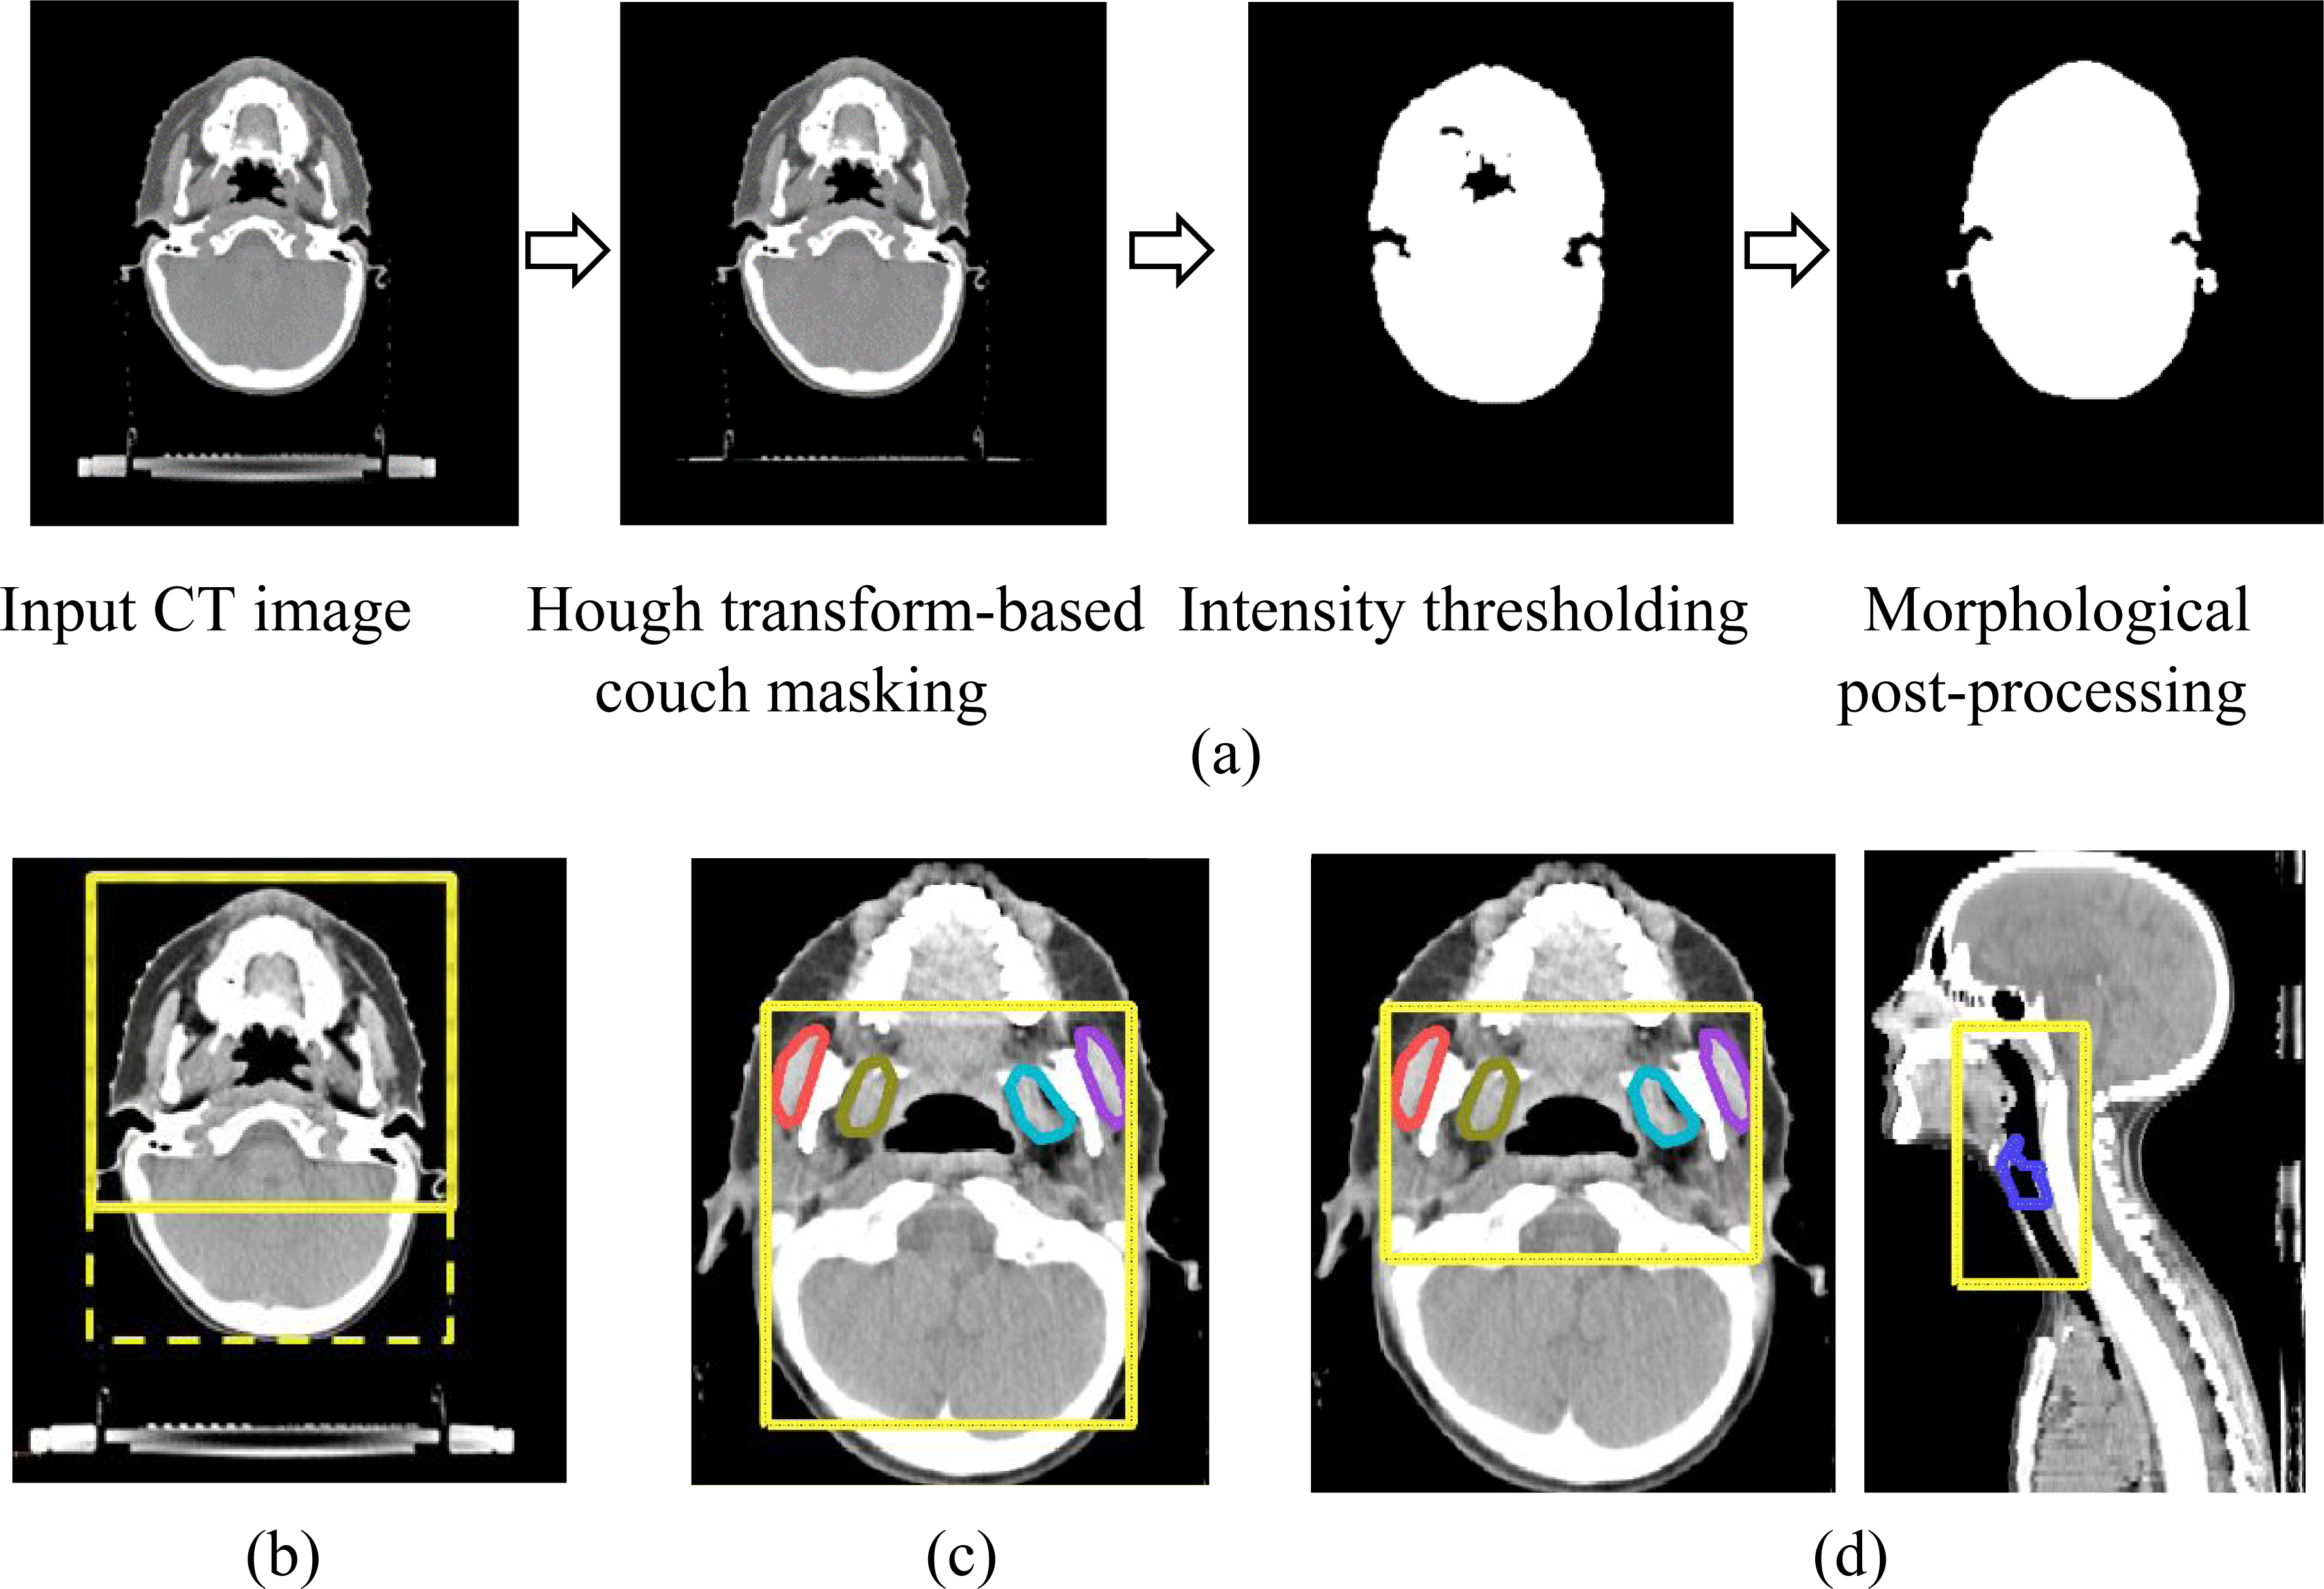
(a) Illustration of automatic method to extract patient outline in axial H&N CT scans and bounding boxes (yellow) generated sequentially to localize (b) chewing structures based on cropped patient outline (c) larynx based on previously-identified chewing structures and (d) constrictor based on previously-identified chewing structures and larynx.
2.3. CNN Architecture and Implementation
DeepLabV3+ [20] was selected for its competitive performance on the PASCAL VOC 2012 and Cityscapes datasets, and training was performed using the ResNet-101 [21] encoder backbone. This architecture combines an encoder network that captures information at different scales, using multiple dilated convolution layers applied in parallel at different rates, with a decoder network capable of effectively extracting object boundaries. Moreover, it has been applied successfully to medical image segmentation, e.g., by Elguindi et al. [22] to segment the prostate in MRI and by Haq et al. [23] to segment cardio-pulmonary substructures in CT.
To address the imbalance in class labels due to differing OAR sizes, three models were developed— a multi-label model with four distinct classes for each of the chewing structures, and one binary segmentation model each for the swallowing structures. Additionally, a sequential auto-segmentation strategy (Figure 3) was used wherein each segmented OAR was used to constrain the location of subsequently segmented OARs. Auto-segmentation order was determined by ease of identification based on size and soft tissue contrast. The chewing structures were first segmented, followed by the larynx, and finally, the constrictor. Additionally, an ensemble of models was developed for each OAR group, comprising three DeepLabV3+ networks trained independently on axial, sagittal, and coronal slices respectively. Each of the axial, sagittal, and coronal models was trained on 2.5D data, i.e., for a given scan, the ith training instance comprised slices i−1, i, and i+1 as the three channels. This resulted in 9 models in total (3 OAR groups times 3 orthogonal views). For each OAR group, probability maps were averaged across the models from three orthogonal views, and voxels were assigned to the class with the highest combined probability. For the binary segmentation models (larynx and constrictor), this amounted to a threshold of 0.5.
Figure 3.
(a) Sequential framework for segmenting chewing and swallowing structures in which each segmented OAR group is used to constrain the location of subsequently segmented OARs. (b) Example showing consensus segmentation of left masseter using ensemble of models trained on 3 orthogonal views (axial, sagittal, and coronal).
Compared to 3D CNNs which are highly memory-intensive, training in 2.5D allowed us to employ a more complex CNN while benefiting from increased context and redundancy from three image orientations. Supplementary information from adjacent slices aided the segmentation of axial images with dental artifacts. Additionally, sagittal and coronal models were presented with less noisy data as distortion from dental artifacts was highly localized compared to axial images. Sample auto-segmentation results on distorted slices are provided in supplementary figure A1. Using a multi-view ensemble provided robustness to the occasional failures of the single-view models.
A high-performance cluster of four NVIDIA GeForce GTX 1080Ti GPUs, each with 11GB memory was used for training. Batch-normalization was applied using mini-batches of 8 images, resized to 320 × 320 voxels for all 3 views. Data augmentation was performed through randomized scaling, cropping, and rotation, and the cross-entropy loss was used. The hyperparameters and optimization methods used are presented in Table 1.
Table 1.
Summary of hyperparameters for training.
| Model | Structure(s) | Learning rate | Optimizer | Momentum | Weight Decay |
|---|---|---|---|---|---|
| 1. | Masseters and medial pterygoids | Axial: 0.002 | SGD | 0.9 | 0.0001 |
| Sagittal: 0.003 | |||||
| Coronal: 0.002 | |||||
| 2. | Larynx | Axial: 0.0003 | SGD | 0.9 | 0.0002 |
| Sagittal: 0.0003 | |||||
| Coronal: 0.0003 | |||||
| 3. | Constrictor | Axial: 1x10⁻⁶ | Adam [24] | 0.9 | 0.0001 |
| Sagittal: 8x10⁻⁷ | |||||
| Coronal : 2x10⁻⁶ |
2.4. Model evaluation
The validation dataset was used to estimate performance during hyperparameter tuning, and an unseen testing dataset was used for unbiased evaluation of the final model.
2.4.1. Geometric measures
The degree of overlap between manual (A) and automated (B) segmentations was measured using the Dice Similarity Coefficient (DSC) as:
The 95th percentile of the Hausdorff distance (HD95), i.e., maximum distance between boundary points of A and B, was computed to capture the impact of rare but sizable errors on overall quality.
2.4.2. Variability of reference segmentations
Sources of manual reference segmentations were various: the larynx was delineated by observers with differing levels of expertise for treatment planning; constrictors and chewing structures were delineated post-treatment by either of two radiation oncology residents to study dysphagia [17] and trismus [18]. Regardless of origin, these sources are referred to as observer-1. Interobserver variability (IOV) was measured between observer-1 and a Medical Physicist (observer-2) on 10 randomly-selected scans from the testing set.
Due to its small size and morphological complexity, auto-segmentations of the constrictor were additionally evaluated based on the extent of editing required by an Anatomist (observer-3) using MIM (MIM Software, Inc., Cleveland, OH). Consistent guidelines were applied: the superior extent of the constrictor was defined around the caudal tip of the pterygoid plate or the occipital condyles and the inferior limit either by the caudal border of the lower edge of the cricoid cartilage or by the esophagus.
2.4.3. Clinical suitability
Mean doses to the OARs, previously identified to determine risk of radiation-induced complications [17,18] were compared between automated and manual contours. The two-sided, paired Wilcoxon signed-rank test was applied to investigate potential statistical disparities at the 5% significance level.
On the prospective dataset, fraction of cases requiring corrections was measured. Further, surface DSC [25] and added path length (APL) [26], which have been shown to correlate with time saved through automation [26], were computed between original and expert-edited auto-segmentations.
3. RESULTS
3.1. Geometric measures
Representative auto-segmentations generated from our algorithm are presented in Figure 4 for qualitative assessment.
Figure 4.
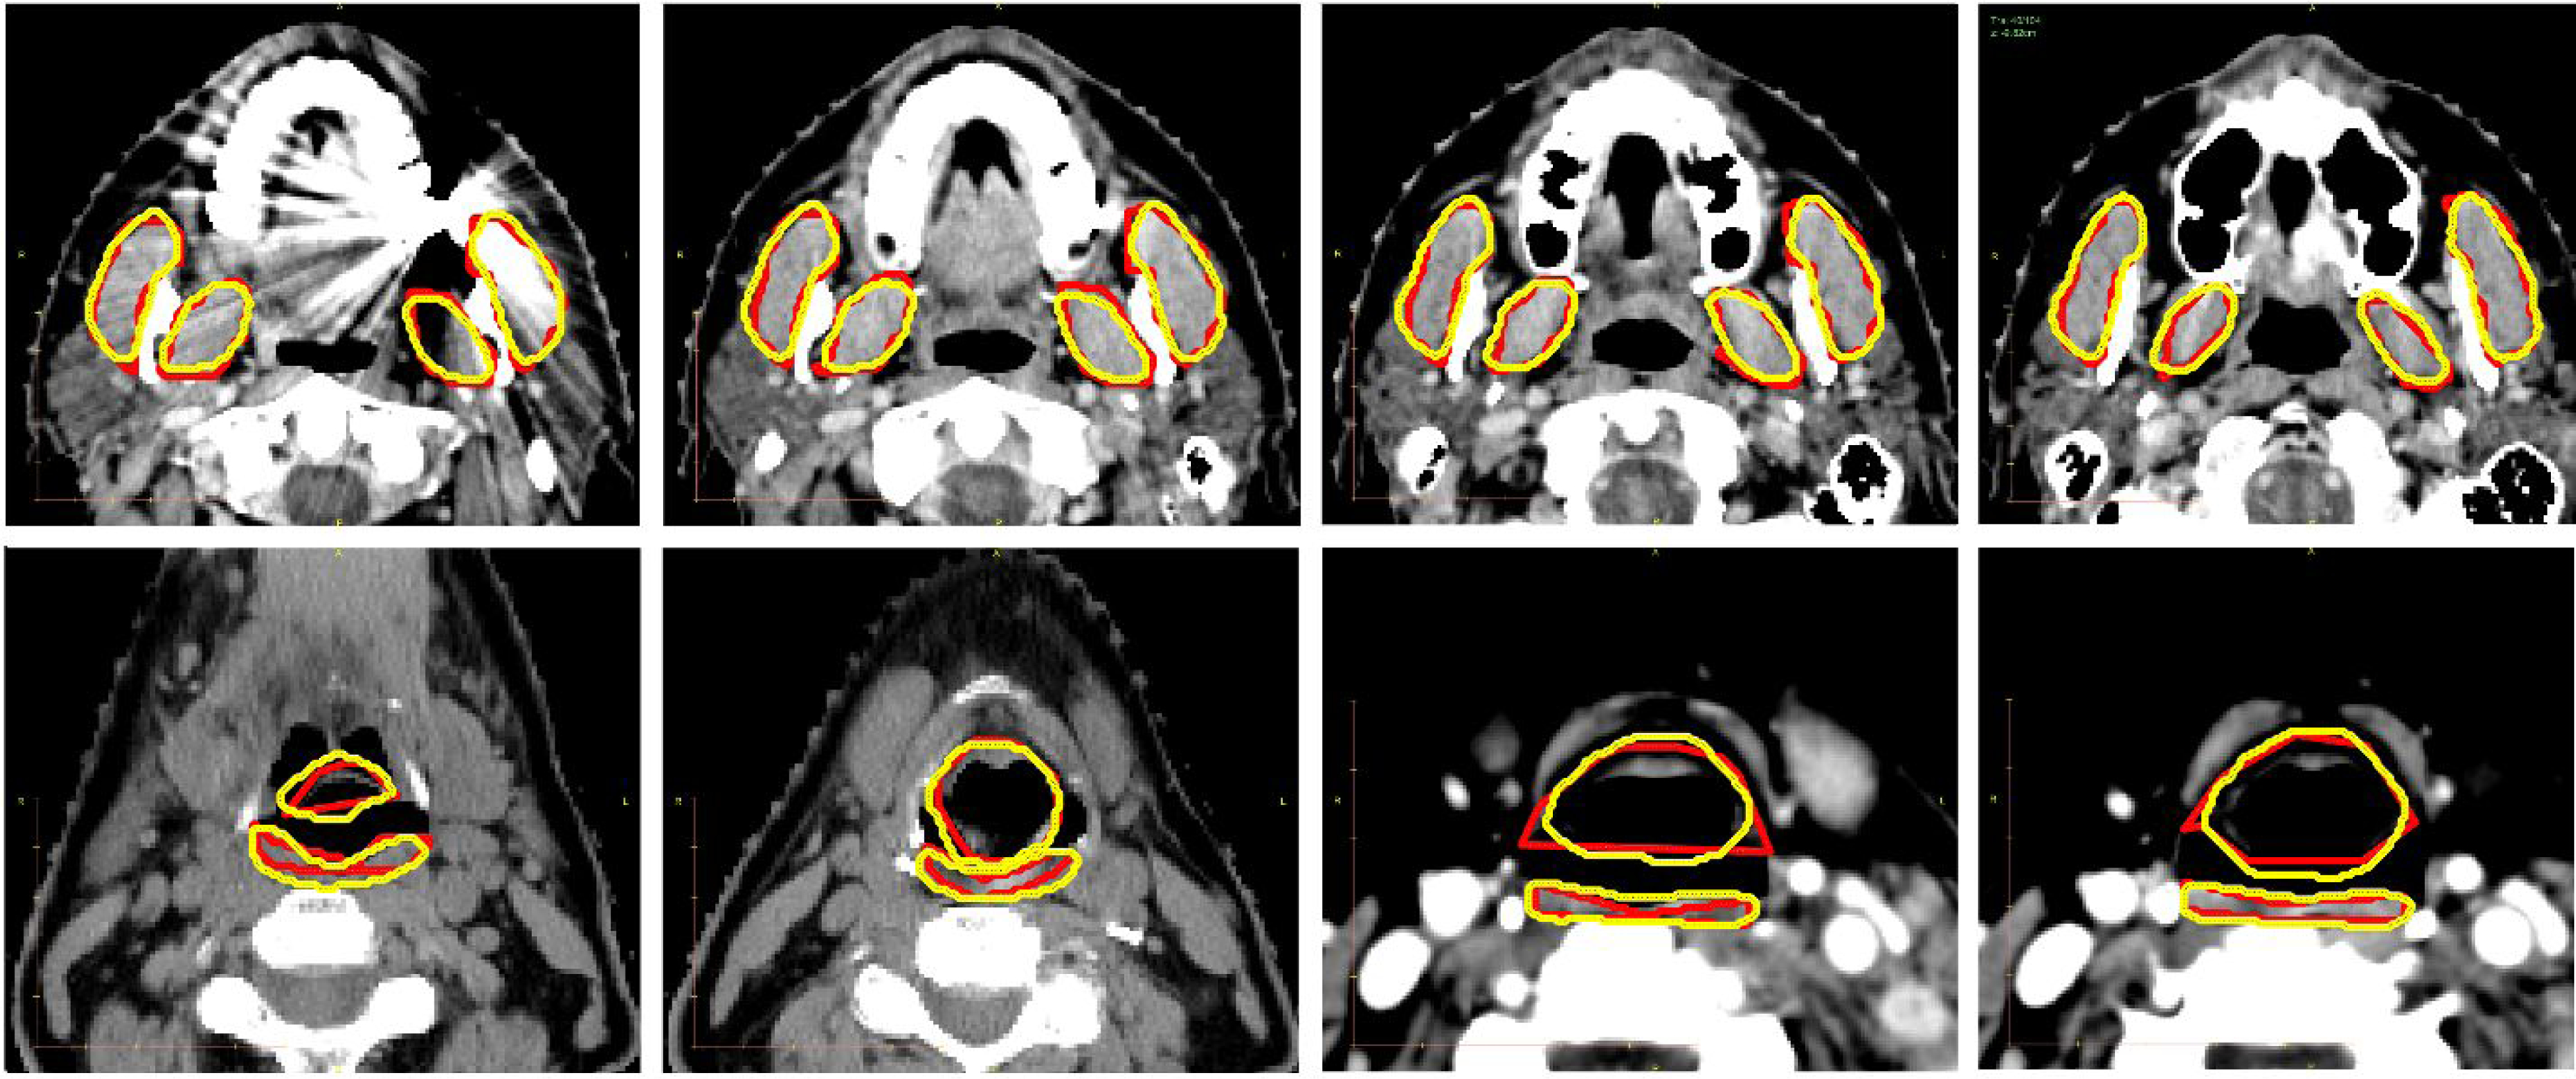
Auto-segmentation results for chewing structures (row-1) and swallowing structures (row-2), shown in four axial cross-sections. Manual reference segmentations are depicted in red and deep-learning-based auto-segmentations in yellow.
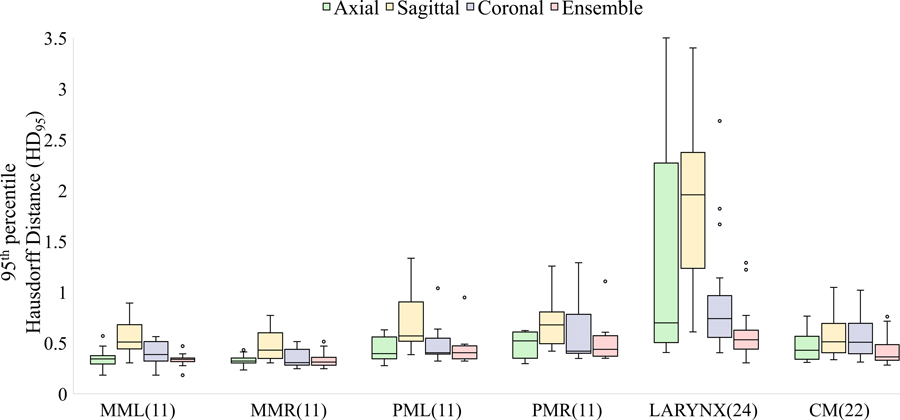
Based on quantitative comparisons (Figure 5), auto-segmented masseters showed the highest median overlap (DSC) and auto-segmented constrictors the smallest DSC with manual segmentations on the retrospective test set. HD95 was largest corresponding to the larynx, possibly owing to inconsistent training contours generated by multiple observers with different levels of experience, in addition to its low soft-tissue contrast and relatively small volume. The auto-segmented larynx was also associated with the lowest surface dice similarity coefficient (supplementary figure A2).
Figure 5.
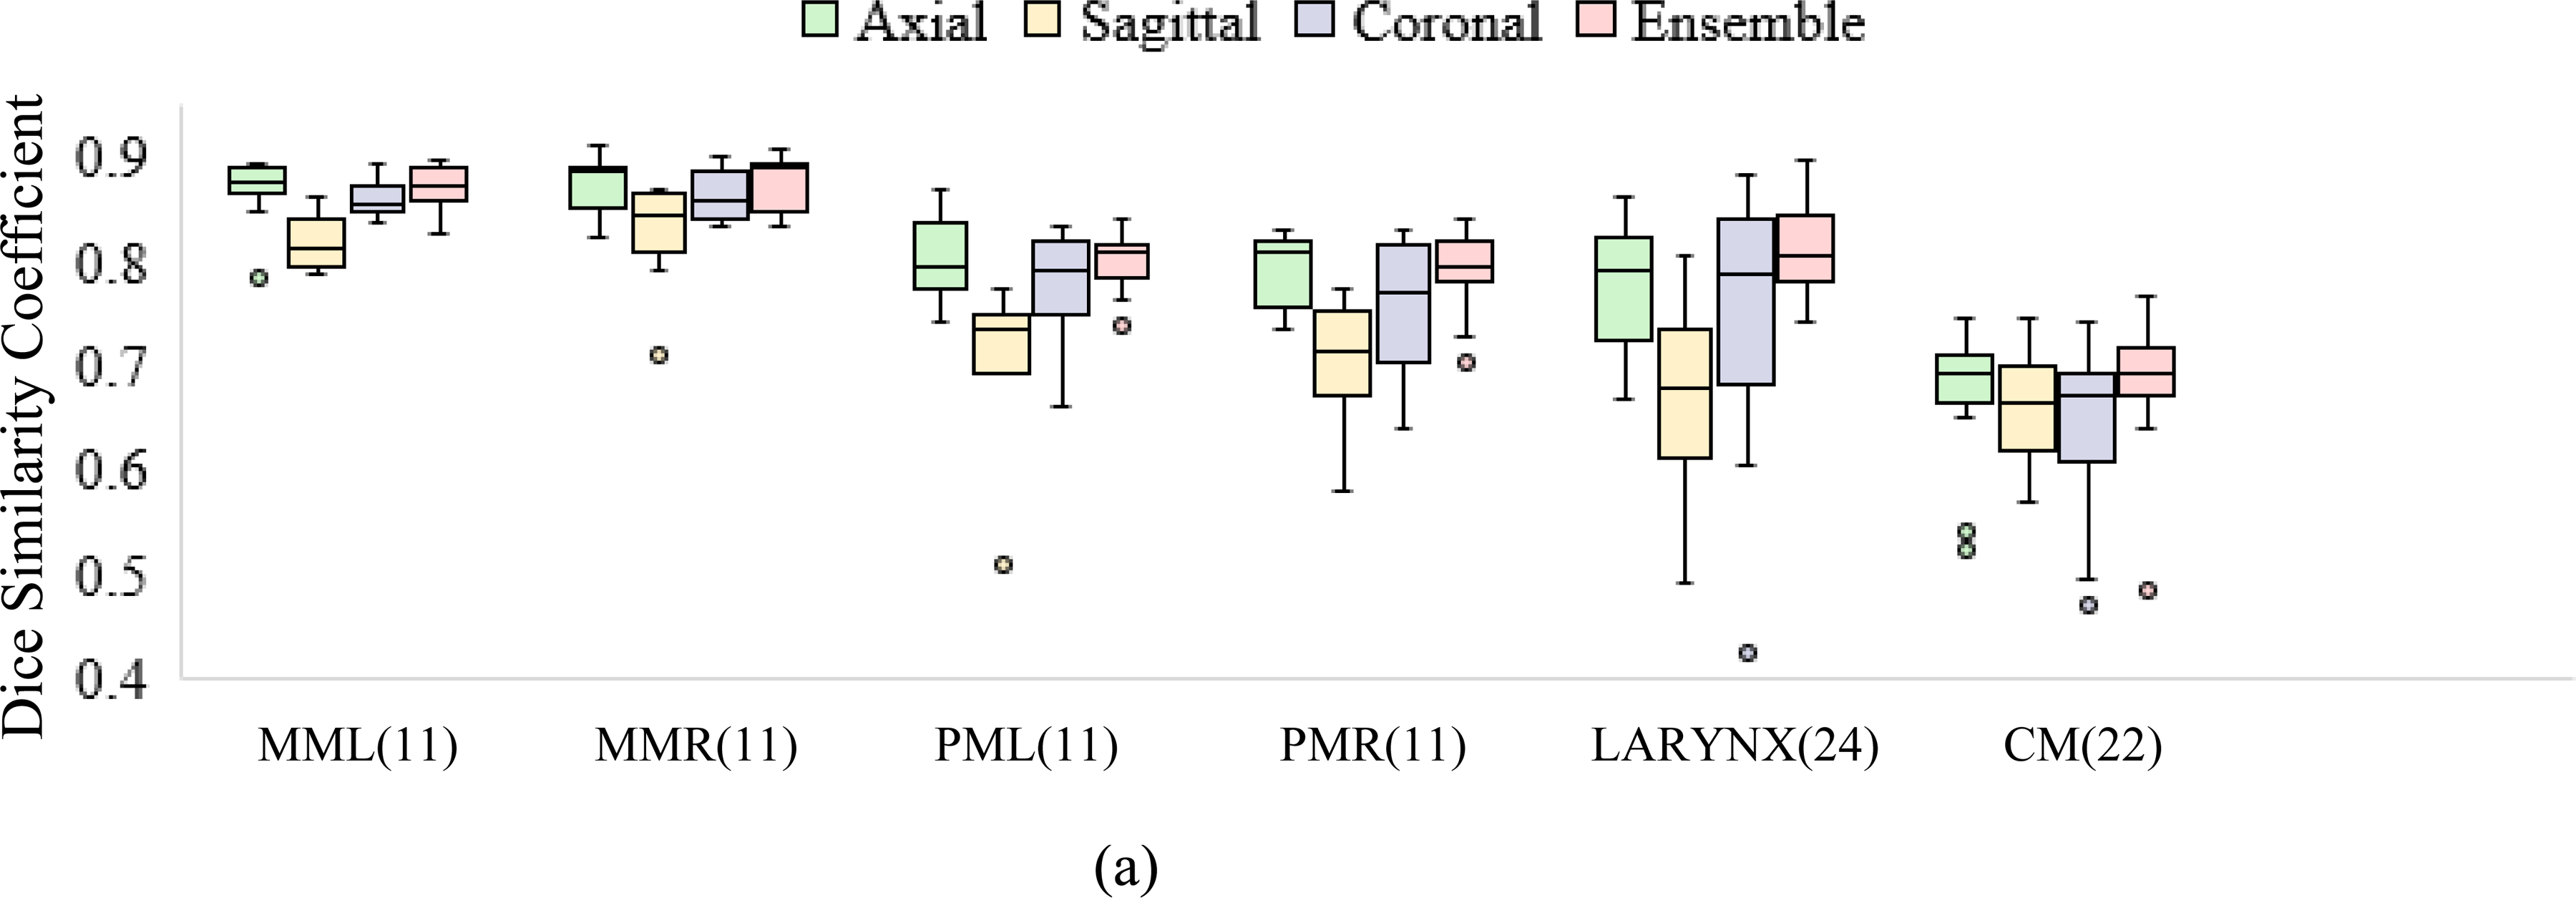
Performance of deep learning models (axial, sagittal, coronal, and ensemble) compared to manual reference segmentations in terms of (a) DSC and (b) HD95. Figure 5(b) shows tighter bounds on the box plots for the ensemble, suggesting multi-view consensus improves worst-case segmentation errors over single-view models. Of the 24 test scans, the number with manual segmentations available for comparison is noted in parentheses. MML, MMR: masseters (left and right), PML, PMR: medial pterygoids (left and right), CM : constrictor muscle.
Multi-view consensus segmentations either closely matched or out-performed their single-view counterparts in terms of median HD95 and reduced interquartile ranges, as evidenced by tighter bounds on the box plots (Figure 5b). The reduction in HD95 was statistically significant (p<0.05) per the left-tailed, paired Wilcoxon signed-rank test for the larynx and constrictor when compared to results from each individual view, and for the chewing structures, when compared to models trained on sagittal or coronal views. An example showing erroneous detections of the larynx using single-view models is presented in Figure 6. This was mitigated by generating a consensus segmentation using information from all 3 views.
Figure 6.

Sagittal cross-sections showing auto-segmentations of the larynx using (a) axial only (b) sagittal only (c) coronal only and (d) ensemble models. Erroneous detections resulting from single-view models were rejected by ensemble consensus.
3.2. Inter-observer variation
Inter-observer DSCs were compared to those between the deep learning-based contours and each of observer-1 and observer-2. Automated segmentations showed greater agreement with observer-1 across all structures and with observer-2 except for the larynx, as compared to inter-observer agreement (Figure 7). High IOV for the constrictor was consistent with previously-published results [27]. Auto-segmentations of the constrictor were additionally edited by observer-3 and the DSC was used to measure the extent of modification required. The median DSC measured between edited and unedited auto-segmentations was 0.92 (inter-quartile range: 0.91–0.93).
Figure 7.
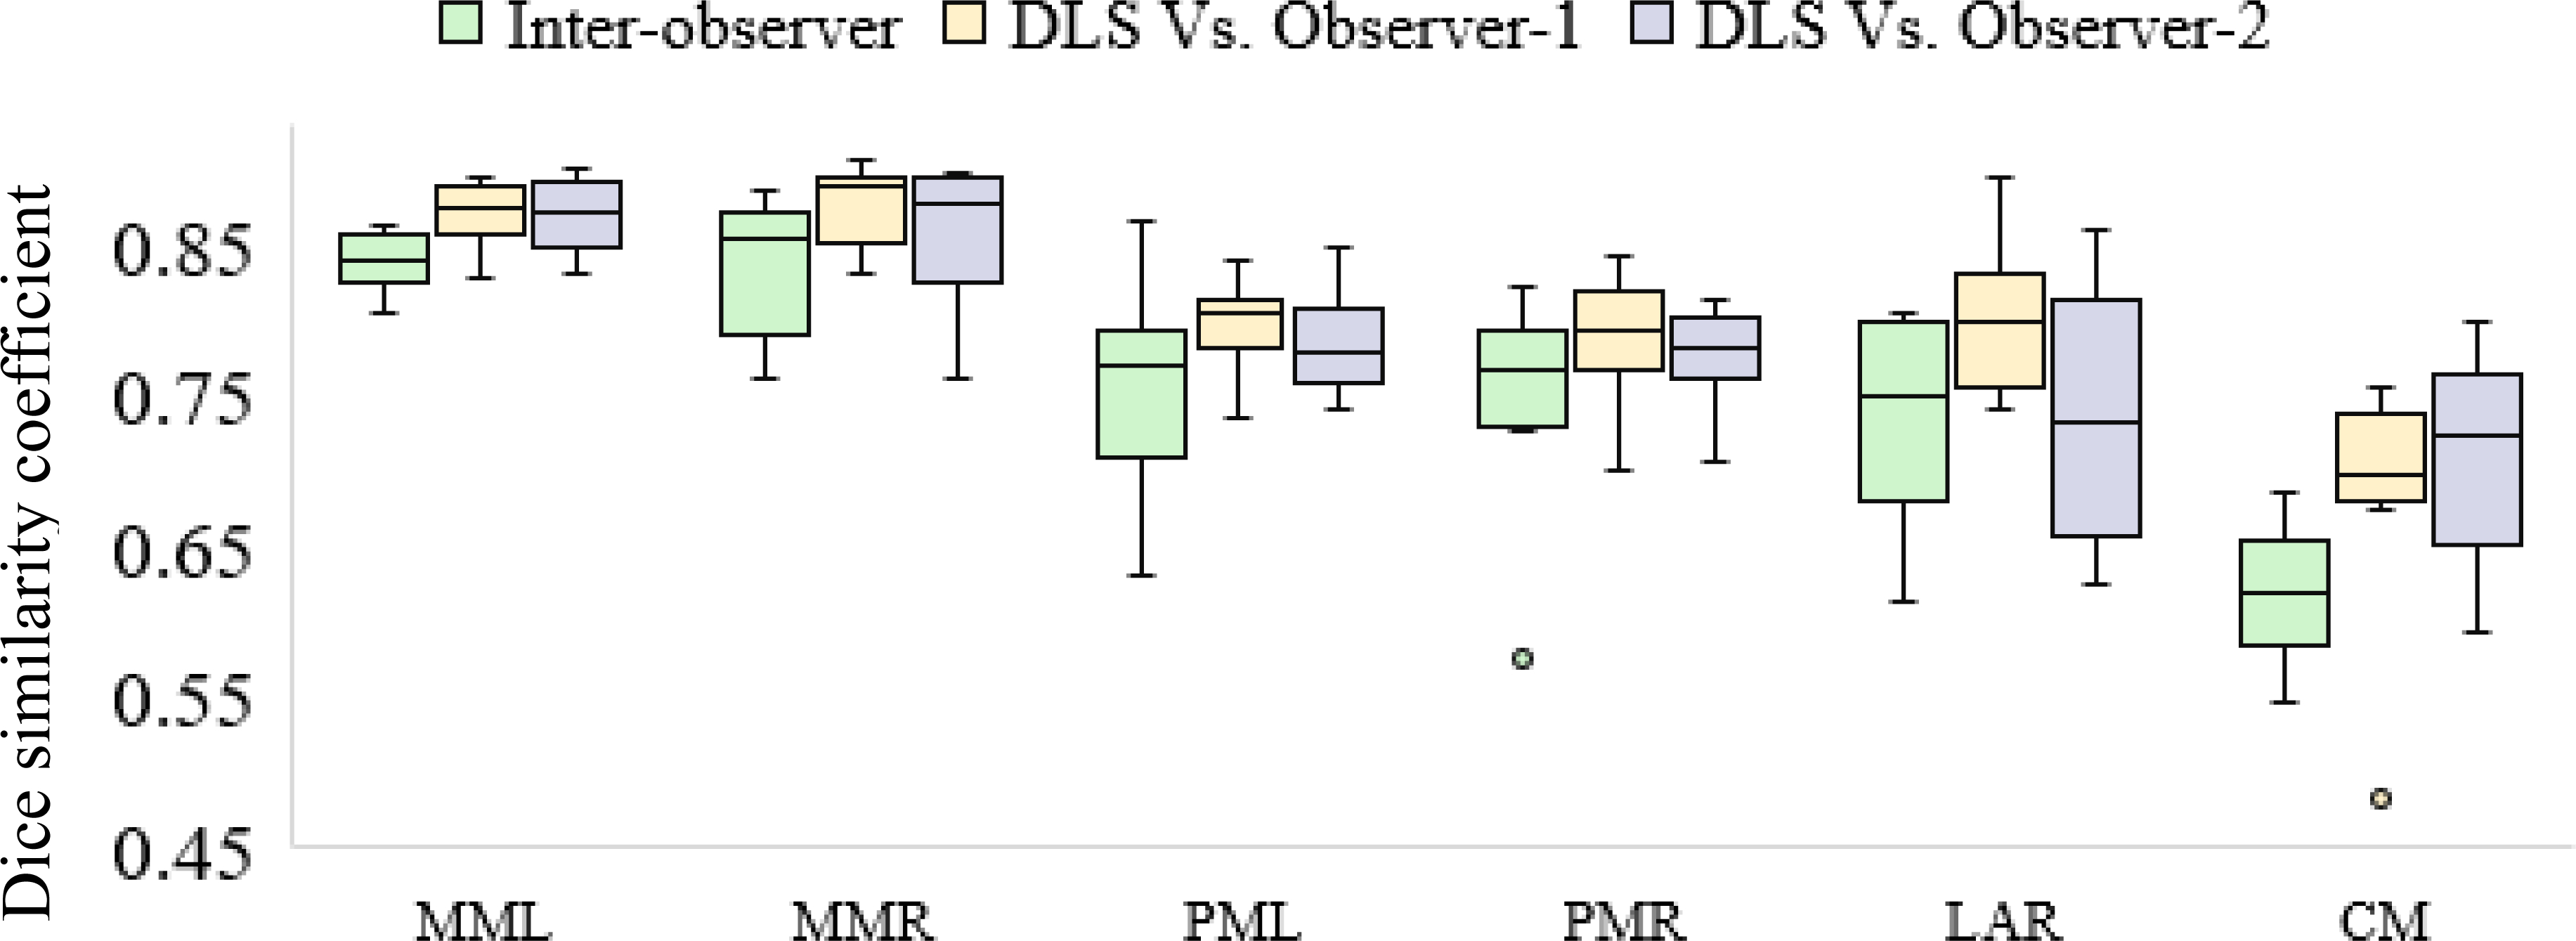
Comparing agreement of deep learning-based segmentations with each of two independent observers to the inter-observer agreement. MML, MMR: Masseters (left and right), PML, PMR: medial pterygoids (left and right), CM (constrictor muscle), DLS: deep learning-based segmentation.
3.3. Clinical suitability
Mean doses to the OARs were compared between manual and automated segmentations on the retrospective test dataset. Differences were not found to be statistically significant for all tested structures at significance level 5% (Table 2) per the two-sided, paired Wilcoxon signed-rank test.
Table 2.
Comparison of mean doses extracted using manual and auto-generated contours. Median, first and third quartiles of percentage differences are presented.
| Structure | Metric | Difference (%) | p-value | No. test patients |
|---|---|---|---|---|
| Masseters | Ipsilaterala mean dose | −0.01 (−1.20, 1.32) | 1.00 | 11 |
| Medial pterygoids | Ipsilaterala mean dose | 0.53 (−0.77, 1.11) | 0.70 | 11 |
| Larynx | Mean dose | 0.38 (−2.02, 6.59) | 0.33 | 24 |
| Constrictor | Mean dose | 0.15 (−0.49, 1.28) | 0.29 | 22 |
Ipsilaterality for paired structures was decided based upon the side with the highest dose.
Prospective evaluation was conducted by measuring the amount of manual editing required for treatment planning. Segmentation models were deployed through MIM workflows using EVA (in-house deep-learning based segmentation deployment pipeline). Each masseter was edited in 23% of scans, the left pterygoid in 25% of scans, and the right pterygoid in 26% of scans. The remaining auto-segmented chewing structures were accepted as-is. All auto-segmentations of the constrictor required editing. Examples of manual edits to the auto-segmented chewing structures and constrictor are provided in supplementary figure A2. The amount of manual editing required was quantified in terms of APL and surface DSC between unedited and expert-edited auto-segmentations. Auto-segmentation performance on the prospective dataset is summarized in Table 3. Retrospective larynx definitions used in training deviated from current (updated) clinical guidelines and were therefore excluded from prospective analysis.
Table 3.
Quantifying manual modifications to auto-segmentations for clinical suitability in prospectively-collected data.
| Structure | Cases edited (%) | APLa (cm) | Surface DSCb | ||||||
|---|---|---|---|---|---|---|---|---|---|
| Mean | Q1 | Q2 | Q3 | Mean | Q1c | Q2 c | Q3 c | ||
| Left masseter | 22.86 | 2.66 | 0 | 0 | 0 | 0.99 | 1 | 1 | 1 |
| Right masseter | 22.86 | 8.9 | 0 | 0 | 0 | 0.97 | 1 | 1 | 1 |
| Left medial pterygoid | 25 | 8.47 | 0 | 0 | 0 | 0.94 | 1 | 1 | 1 |
| Right medial pterygoid | 25.76 | 9.8 | 0 | 0 | 0 | 0.93 | 1 | 1 | 1 |
| Constrictor | 100 | 187.36 | 137.92 | 180.39 | 232.57 | 0.57 | 0.51 | 0.57 | 0.63 |
APL: Added path length
DSC: Dice similarity coefficient
Q1,Q2,Q3 – first, second and third quartiles, respectively.
3.4. Comparison to previously-reported methods
Table 4 summarizes the performance (mean DSCs) of state-of-the-art H&N OAR segmentation models including 3D Unet [12], FocusNet [15] a H&N OAR-focused CNN [11], atlas-based unedited [28,29] and radiologist-adjusted [5] segmentations. The performance of our segmentation models matched or exceeded previously published methods. However, it should be noted that these results were reported on different datasets and do not represent a direct comparison on our test dataset. Additionally, we compared our performance in segmenting the constrictor with Cross-Modality Educed Deep Learning [30], which combines CT and pseudo-MR information to enhance segmentation accuracy. A 2D U-Net model with nested self-attention blocks [31], trained on axial T1-MR scans of 39 H&N cancer patients in addition to our CT training database and pre-processed identically, was evaluated. Our method yielded a higher median DSC on the test dataset (Table 4). However, performance of the cross-modality approach using MR sequences with superior soft-tissue contrast around the constrictor, such as mDIXON, should be investigated.
Table 4.
DSC (mean ± std. deviation) for swallowing and chewing structures using the proposed method (column-1) and results from previously published methods.
| Structure | Proposed (retrospective) | Proposed (prospective) | Jue et al. [30] (2019)1 | van Rooij et al. [12] (2019)1 | Gao et al. [15] (2019)1 | Ibragimov et al. [11] (2017)1 | Tao et al. [5] (2015)2 | Thomson et al. [28] (2015)2 | Han et al. [29] (2008)2 |
|---|---|---|---|---|---|---|---|---|---|
| Model/method | DeepLabV3+ | DeepLabV3+ | 2D U-Net with self-attention [31] | 3D U-Net | FocusNet | Custom CNN | ABAS (v2.01.00, Elekta AB) | ABAS SPICE [35] | MABAS |
| Masseters | 0.87 ± 0.02 | 0.99 ± 0.04 | - | - | - | - | - | 0.83 | |
| Pterygoids | 0.80 ± 0.03 | 0.96 ± 0.1 | - | - | - | - | - | 0.83 | |
| Larynx | 0.81 ± 0.04 | - | 0.78 ± 0.05 | 0.66 ± 0.29 | 0.86 ± 0.04 | 0.73 ± 0.04 | 0.58 | - | |
| Constrictor | 0.68 ± 0.07 | 0.7 ± 0.07 | 0.67 ± 0.08 | 0.68 ± 0.09 | - | 0.69 ± 0.06 | 0.65 ± 0.06 | 0.50 | - |
Deep learning-based
Atlas-based segmentation methods
3.5. Distribution of trained models
CPU and GPU implementations of the models were packaged along with dependencies to facilitate deployment across different operating systems (Singularity containers [32] for Linux; Conda environment archives for Linux, Windows, and macOS) and can be requested for research use following the instructions at https://github.com/cerr/CERR/wiki/Auto-Segmentation-models. Packaged models are deployed using CERR’s deep learning pipeline [19], compatible with MATLAB, as well as Octave and Python (via the Oct2Py bridge) for license-free use. Additionally, a JupyterLab notebook demonstrating the models developed in this work is available at https://github.com/cerr/CT_SwallowingAndChewing_DeepLabV3/blob/master/demo_DLseg_swallowing_and_chewing_structures.ipynb. Integration with CERR’s radiomics toolbox [33] and dosimetric models [34] further facilitates outcomes analysis. These models are distributed strictly for research use; clinical or commercial use is prohibited. CERR and containerized model implementations have not been approved by the U.S. Food and Drug Administration (FDA).
4. DISCUSSION
We trained three model ensembles to segment structures of varying sizes, while constraining the location of each structure group based on the extents of previously identified structures. This sequential localization and segmentation framework was able to handle the imbalance in class labels arising from variation in OAR sizes. Additionally, using a multi-view ensemble improved the worst-case segmentation errors compared to single-view models. This, along with training in 2.5D also enabled accurate segmentation despite the presence of dental artifacts. The reduction in HD95 using the ensemble approach was statistically significant (p<0.05) for the larynx and constrictor compared to single-view models, and for the chewing structures compared to models trained on sagittal or coronal views, per the left-tailed, paired Wilcoxon signed rank test.
Model ensembles were found to generalize well for all structures, as auto-generated results showed adequate agreement with delineations by a new (unseen) observer (observer-2). Of the structures considered, the constrictor was most challenging to segment due to its morphological complexity, high anatomical variability, and low soft tissue contrast. These challenges were reflected in our analysis of manual segmentations by different observers as the IOV was highest for the constrictor, which is consistent with previously-reported findings. To evaluate clinical suitability, the extent of manual editing required was quantified. Median DSC>0.92 between expert-edited and unedited auto-segmentations of the constrictor suggests that most manual modifications were minor and use of deep learning-based contours could increase clinical efficiency.
In prospectively-collected scans, auto-segmentations of the chewing structures were accepted as-is in 76% cases. Compared to median DSCs of 0.80–0.87 on the retrospective test dataset, the performance on the prospective dataset was much higher (median DSC=1, median surface DSC=1, median APL=0 cm). This suggests that minor edits were sufficient for clinical use. All auto-segmentations of the constrictor required correction (median DSC=0.72, median surface DSC=0.55, median APL =180.4 cm). Manual edits focused on refining the superior and inferior extents, and in a few cases, the anterior limit. In four of the 27 scans, segmentation performance was observed to degrade due to tumor infiltration and tumors had to be manually segmented out. Tumors completely obscured a substantial portion of the region of interest across several contiguous slices and were not represented in the training set unlike dental artifacts, which partially obscured the region of interest across a few slices and were represented in both training and test sets. Including sufficient training images with tumor infiltration could help reduce the manual intervention needed. For the larynx, guidelines used in the retrospective dataset differed considerably from current clinical standards. The primary discrepancy was at the superior border, located at the top of the epiglottis in the (retrospective) training set vs. top of arytenoids in current clinical practice. The use of a legacy contouring tool further resulted in jagged training contours of the larynx, with additional variation stemming from multiple observers with different levels of experience. Although the auto-segmentation model for the larynx is not clinically usable as-is, performance on the retrospective dataset suggests it could be tuned with updated contours for this purpose. It currently aids in localizing the constrictor.
We note that all auto-segmentation models were trained and evaluated on CT scans acquired for planning purposes, and performance on CT scans acquired for diagnosis (using different reconstruction kernels, scan resolutions, contrast agents, etc.) is untested.
5. CONCLUSIONS
We developed a fully-automatic, accurate, and time-efficient method to segment swallowing and chewing structures in CT images and demonstrated its suitability for clinical use. Sequential localization aided in segmenting structures with complex morphology and low soft-tissue contrast. Multi-view ensemble models were found to improve the worst-case segmentation errors and could potentially be applied to improve segmentation quality in other sites as well. The trained models, along with a Jupyter notebook demonstrating usage, are publicly distributed for research use through the open-source platform CERR (https://www.github.com/cerr/CERR).
Supplementary Material
ACKNOWLEDGEMENTS
This work was partially funded by NIH grant 1R01CA198121 and NIH/NCI Cancer Center Support grant P30 CA008748.
REFERENCES
- 1.Harari PM, Song S, Tomé WA. Emphasizing conformal avoidance versus target definition for IMRT planning in head-and-neck cancer. International Journal of Radiation Oncology* Biology* Physics. 2010. Jul 1;77(3):950–8. doi: 10.1016/j.ijrobp.2009.09.062 [DOI] [PMC free article] [PubMed] [Google Scholar]
- 2.Choi M, Refaat T, Lester MS, Bacchus I, Rademaker AW, Mittal BB. Development of a standardized method for contouring the larynx and its substructures. Radiation Oncology 9. 2014; 285. 10.1186/s13014-014-0285-4 [DOI] [PMC free article] [PubMed] [Google Scholar]
- 3.Levendag PC, Teguh DN, Voet P, van der Est H, Noever I, de Kruijf WJ, Kolkman-Deurloo IK, Prevost JB, Poll J, Schmitz PI, Heijmen BJ. Dysphagia disorders in patients with cancer of the oropharynx are significantly affected by the radiation therapy dose to the superior and middle constrictor muscle: a dose-effect relationship. Radiotherapy and Oncology. 2007. Oct;85(1):64–73. doi: 10.1016/j.radonc.2007.07.009 [DOI] [PubMed] [Google Scholar]
- 4.Kraaijenga SA, Hamming-Vrieze O, Verheijen S, Lamers E, van der Molen L, Hilgers FJ, van den Brekel MW, Heemsbergen WD. Radiation dose to the masseter and medial pterygoid muscle in relation to trismus after chemoradiotherapy for advanced head and neck cancer. Head & Neck. 2019. May;41(5):1387–1394. doi: 10.1002/hed.25573 [DOI] [PubMed] [Google Scholar]
- 5.Tao CJ, Yi JL, Chen NY, Ren W, Cheng J, Tung S, Kong L, Lin SJ, Pan JJ, Zhang GS, Hu J, Qi ZY, Ma J, Lu JD, Yan D, Sun Y. Multi-subject atlas-based auto-segmentation reduces interobserver variation and improves dosimetric parameter consistency for organs at risk in nasopharyngeal carcinoma: A multi-institution clinical study. Radiotherapy and Oncology. 2015. Jun;115(3):407–11. doi: 10.1016/j.radonc.2015.05.012 [DOI] [PubMed] [Google Scholar]
- 6.Levendag PC, Hoogeman M, Teguh D, Wolf T, Hibbard L, Wijers O, Heijmen B, Nowak P, Vasquez-Osorio E, and Han X. Atlas based auto-segmentation of CT images: Clinical evaluation of using auto-contouring in high-dose, high-precision radiotherapy of cancer in the head and neck. International Journal of Radiation Oncology* Biology* Physics. 2008;72 (1), p. S40. doi: 10.1016/j.ijrobp.2008.06.1285 [DOI] [Google Scholar]
- 7.Fortunati V, Verhaart RF, van der Lijn F, Niessen WJ, Veenland JF, Paulides MM, van Walsum T. Tissue segmentation of head and neck CT images for treatment planning: a multiatlas approach combined with intensity modeling. Medical Physics. 2013. Jul;40(7):071905. doi: 10.1118/1.4810971 [DOI] [PubMed] [Google Scholar]
- 8.Qazi AA, Pekar V, Kim J, Xie J, Breen SL, Jaffray DA. Auto-segmentation of normal and target structures in head and neck CT images: A feature-driven model-based approach. Medical Physics. 2011;38(11):6160–6170. doi: 10.1118/1.3654160 [DOI] [PubMed] [Google Scholar]
- 9.Fritscher KD, Peroni M, Zaffino P, Spadea MF, Schubert R, Sharp G. Automatic segmentation of head and neck CT images for radiotherapy treatment planning using multiple atlases, statistical appearance models, and geodesic active contours. Medical Physics. 2014;41(5):051910. doi: 10.1118/1.4871623 [DOI] [PMC free article] [PubMed] [Google Scholar]
- 10.Zhu W, Huang Y, Zeng L, Chen X, Liu Y, Qian Z, Du N, Fan W, Xie X. AnatomyNet: Deep learning for fast and fully automated whole-volume segmentation of head and neck anatomy. Medical Physics. 2019. Feb;46(2):576–89. doi: 10.1002/mp.13300 [DOI] [PubMed] [Google Scholar]
- 11.Ibragimov B, Xing L. Segmentation of organs-at-risks in head and neck CT images using convolutional neural networks. Medical Physics. 2017;44(2):547–557. doi: 10.1002/mp.12045 [DOI] [PMC free article] [PubMed] [Google Scholar]
- 12.Rooij WV, Dahele M, Brandao HR, Delaney AR, Slotman BJ, Verbakel WF. Deep Learning-Based Delineation of Head and Neck Organs at Risk: Geometric and Dosimetric Evaluation. International Journal of Radiation Oncology*Biology*Physics. 2019;104(3):677–684. doi: 10.1016/j.ijrobp.2019.02.040 [DOI] [PubMed] [Google Scholar]
- 13.Ronneberger O, Fischer P, Brox T. U-net: Convolutional networks for biomedical image segmentation. International Conference on Medical image computing and computer-assisted intervention 2015. Oct 5; pp. 234–241. doi:10.1007/978–3-319–24574-4_28 [Google Scholar]
- 14.Tong N, Gou S, Yang S, Ruan D, Sheng K. Fully automatic multi-organ segmentation for head and neck cancer radiotherapy using shape representation model constrained fully convolutional neural networks. Medical Physics. 2018;45(10):4558–4567. doi: 10.1002/mp.13147 [DOI] [PMC free article] [PubMed] [Google Scholar]
- 15.Gao Y, Huang R, Chen M, Wang Z, Deng J, Chen Y, Yang Y, Zhang J, Tao C, Li H. Focusnet: Imbalanced large and small organ segmentation with an end-to-end deep neural network for head and neck ct images. International Conference on Medical Image Computing and Computer-Assisted Intervention 2019. Oct 13; pp. 829–838. doi:10.1007/978–3-030–32248-9_92 [Google Scholar]
- 16.Iyer A, Thor M, Haq R, Deasy JO, Apte AP. Deep learning-based auto-segmentation of swallowing and chewing structures in CT. bioRxiv. 10.1101/772178v1. Published September 18, 2019. Accessed April 27, 2021. [DOI]
- 17.Tsai CJ, Jackson A, Setton J, Riaz N, McBride S, Leeman J, Kowalski A, Happersett L and Lee NY Modeling dose response for late dysphagia in patients with head and neck cancer in the modern era of definitive chemoradiation. JCO Clinical Cancer Informatics. 2017;(1):1–7. doi: 10.1200/cci.17.00070 [DOI] [PMC free article] [PubMed] [Google Scholar]
- 18.Rao SD, Saleh ZH, Setton J, Tam M, McBride SM, Riaz N, Deasy JO and Lee NY Dose-volume factors correlating with trismus following chemoradiation for head and neck cancer. Acta Oncologica. 2015;55(1):99–104. doi: 10.3109/0284186x.2015.1037864 [DOI] [PMC free article] [PubMed] [Google Scholar]
- 19.Iyer A, LoCastro E, Apte AP, Veeraraghavan H, & Deasy JO Portable framework to deploy deep learning segmentation models for medical images. bioRxiv. 10.1101/2021.03.17.435903v1. Published March 19, 2021. Accessed April 27, 2021. [DOI]
- 20.Chen LC, Zhu Y, Papandreou G, Schroff F, Adam H. Encoder-decoder with atrous separable convolution for semantic image segmentation. In proceedings of the European conference on computer vision (ECCV) 2018; pp. 801–818. doi:10.1007/978–3-030–01234-2_49 [Google Scholar]
- 21.He K, Zhang X, Ren S, Sun J. Deep residual learning for image recognition. In Proceedings of the IEEE conference on computer vision and pattern recognition 2016; pp. 770–778. doi:10.1109/cvpr.2016.90 [Google Scholar]
- 22.Elguindi S, Zelefsky MJ, Jiang J, Veeraraghavan H, Deasy JO, Hunt MA and Tyagi N Deep learning-based auto-segmentation of targets and organs-at-risk for magnetic resonance imaging only planning of prostate radiotherapy. Physics and Imaging in Radiation Oncology. 2019;12:80–86. doi: 10.1016/j.phro.2019.11.006 [DOI] [PMC free article] [PubMed] [Google Scholar]
- 23.Haq R, Hotca A, Apte A, Rimner A, Deasy JO, Thor M. Cardio-pulmonary substructure segmentation of radiotherapy computed tomography images using convolutional neural networks for clinical outcomes analysis. Physics and Imaging in Radiation Oncology. https://www.sciencedirect.com/science/article/abs/pii/S2405631620300221 [DOI] [PMC free article] [PubMed]
- 24.Kingma DP, Ba J. Adam: A method for stochastic optimization. arXiv preprint arXiv:1412.6980. Published 22 Dec 2014. Accessed 27 April 2021. [Google Scholar]
- 25.Nikolov S, Blackwell S, Mendes R, De Fauw J, Meyer C, Hughes C, Askham H, Romera-Paredes B, Karthikesalingam A, Chu C and Carnell D Deep learning to achieve clinically applicable segmentation of head and neck anatomy for radiotherapy. arXiv preprint arXiv:1809.04430. Published Accessed 12 September 2018. Accessed 27 April 2021. [Google Scholar]
- 26.Vaassen F, Hazelaar C, Vaniqui A, Gooding M, van der Heyden B, Canters R and van Elmpt W Evaluation of measures for assessing time-saving of automatic organ-at-risk segmentation in radiotherapy. Physics and Imaging in Radiation Oncology, 13. 2020; pp.1–6. [DOI] [PMC free article] [PubMed] [Google Scholar]
- 27.Petkar I, McQuaid D, Dunlop A, Tyler J, Hall E, & Nutting C Inter-Observer Variation in Delineating the Pharyngeal Constrictor Muscle as Organ at Risk in Radiotherapy for Head and Neck Cancer. Frontiers in Oncology, 11. 2021. 10.3389/fonc.2021.644767 [DOI] [PMC free article] [PubMed] [Google Scholar]
- 28.Thomson D, Boylan C, Liptrot T, Aitkenhead A, Lee L, Yap B, Sykes A, Rowbottom C and Slevin N Evaluation of an automatic segmentation algorithm for definition of head and neck organs at risk. Radiation Oncology. 2014;9(1):173. doi: 10.1186/1748-717x-9-173. [DOI] [PMC free article] [PubMed] [Google Scholar]
- 29.Han X, Hoogeman MS, Levendag PC, Hibbard LS, Teguh DN, Voet P, Cowen AC and Wolf TK Atlas-Based Auto-segmentation of Head and Neck CT Images. Medical Image Computing and Computer-Assisted Intervention – MICCAI 2008. 2008:434–441. doi: 10.1007/978-3-540-85990-1_52 [DOI] [PubMed] [Google Scholar]
- 30.Jue J, Jason H, Neelam T, Andreas R, Sean BL, Joseph DO, & Harini V Integrating Cross-modality Hallucinated MRI with CT to Aid Mediastinal Lung Tumor Segmentation. Lecture Notes in Computer Science. 2019; 221–229. 10.1007/978-3-030-32226-7_25 [DOI] [PMC free article] [PubMed] [Google Scholar]
- 31.Veeraraghavan H, Jiang J, Elguindi S, Berry SL, Onochie I, Apte A, Cervino L, Deasy JO. Nested-block self-attention for robust radiotherapy planning segmentation. arXiv: https://arxiv.org/abs/2102.13541. Published Feb 26, 2021. Accessed April 27, 2021. [Google Scholar]
- 32.Kurtzer GM, Sochat V, & Bauer MW Singularity: Scientific containers for mobility of compute. PLOS ONE. 2017;12(5). 10.1371/journal.pone.0177459 [DOI] [PMC free article] [PubMed] [Google Scholar]
- 33.Apte AP, Iyer A, Crispin-Ortuzar M, Pandya R, Van Dijk LV, Spezi E, Thor M, Um H, Veeraraghavan H, Oh JH and Shukla-Dave A Technical Note: Extension of CERR for computational radiomics: A comprehensive MATLAB platform for reproducible radiomics research. Medical Physics. 2018;45(8):3713–3720. doi: 10.1002/mp.13046 [DOI] [PMC free article] [PubMed] [Google Scholar]
- 34.Apte AP, Iyer A, Thor M, Pandya R, Haq R, Jiang J, LoCastro E, Shukla-Dave A, Sasankan N, Xiao Y, Hu YC, Elguindi S, Veeraraghavan H, Oh JH, Jackson A, Deasy JO. Library of deep-learning image segmentation and outcomes model-implementations. Physica Medica. 2020. May;73:190–196. doi: 10.1016/j.ejmp.2020.04.011 [DOI] [PMC free article] [PubMed] [Google Scholar]
- 35.Bzdusek K, Bystrov D, Pekar V, Peters J, Schadewaldt N, Schulz H, Vik T. Smart probabilistic image contouring engine (SPICE). Philips Research, Hamburg, Germany. 2012. Retrieved October 08, 2021 from: http://www.philips.co.uk/healthcare/product/HCNOCTN137/pinnacle3-auto-segmentation-spice. [Google Scholar]
Associated Data
This section collects any data citations, data availability statements, or supplementary materials included in this article.


