

Abstract
Background:
Pain may serve as an antecedent for alcohol use, increasing risk for hazardous drinking and associated consequences. Delayed onset muscle soreness (DOMS) induction produces clinically relevant but time-limited musculoskeletal pain. This study was conducted to determine whether DOMS induction on the dominant elbow flexors influenced alcohol demand using the Alcohol Purchase Task (APT). We hypothesized DOMS would increase alcohol demand relative to a sham control. Based on existing studies of pain self-medication, we expected DOMS-related increases in alcohol demand would be greatest in men.
Methods:
Participants (N = 53; 57 % women) were randomly assigned to a DOMS (eccentric exercise) or sham condition (concentric exercise). Participants completed the APT pre-exercise and 48 -hs post-exercise. Repeated measures GLM was used to characterize group by sex by time interactions on APT indices, including intensity, breakpoint, essential value (EV), Omax, and Pmax.
Results:
The DOMS procedure significantly increased pain ratings at the elbow flexors. Men had significantly higher demand intensity than women across groups and time points. Significant interactive effects were detected for breakpoint and EV. From pre- to post-test, breakpoint significantly increased in men in the DOMS group. However, breakpoint and EV significantly decreased in women in the DOMS group.
Conclusions:
Increased alcohol demand in men in the DOMS group was consistent with epidemiological data suggesting men are at higher risk for self-medicating pain with alcohol than women. However, decreased demand in women was unexpected. Taken together, results indicate DOMS induction may be a useful means to characterize pain as an antecedent for alcohol use.
Keywords: Alcohol, Delayed onset muscle soreness, Alcohol purchase task, Musculoskeletal pain, Behavioral economics
1. Introduction
Pain is the most common reason individuals seek medical treatment. People with acute pain frequently engage in pain self-management, including use of over-the-counter analgesics (Moore et al., 2015). However, exceedance of dosing guidelines is common, likely due to attempts to achieve adequate relief (Hommez et al., 2018). Likewise, chronic pain has detrimental effects on quality of life for nearly 100 million American sufferers and is extremely costly, with associated expenditures reaching $635 billion per year in the United States (Institute of Medicine, 2011). Existing treatments for chronic pain such as opioid analgesics, are relatively ineffective (Noble et al., 2010), rarely meet patients’ own criteria for successful treatment (Robinson et al., 2005), and are associated with significant risk (i.e., opioid use disorder) (Volkow and Collins, 2017). Therefore, patients may seek alternative, maladaptive methods for pain relief, including self-medication with alcohol.
A large majority (86 %) of US adults consume alcohol at some point in their lives (Substance Abuse and Mental Health Services Administration, 2017) and ~56 % have ≥ 1 alcoholic drink per month (Schiller et al., 2012). Stress, alcohol withdrawal symptoms, and pain can initiate urge or craving for alcohol consumption (American Psychiatric Association, 2013). Indeed, epidemiological data suggest that nearly 25 % of individuals suffering from orofacial or musculoskeletal pain at least occasionally self-medicate their pain with alcohol (Riley and King, 2009). A meta-analysis of the effects of acute alcohol intake on experimental pain in healthy participants found that alcohol produces significant reductions in pain intensity, as well as elevations in pain threshold and pain tolerance (Thompson et al., 2017). Critically, meta-regression analyses indicated these were dose-dependent, suggesting patients who self-medicate are likely to exceed moderate drinking guidelines, increasing risk of alcohol-related consequences including increased pain sensitivity, hyperalgesia associated with alcohol withdrawal (National Institute on Alcohol Abuse and Alcoholism, 2013), development of Alcohol Use Disorder (AUD), and harmful drug/alcohol interactions.
Theoretical models regarding reciprocal alcohol-pain interactions indicate this pattern can result in a feed-forward cycle associated with increased risk for AUD in people with chronic pain, and chronic pain in people with AUD (Ditre et al., 2020; Egli et al., 2012). This cyclical association is supported by data indicating greater pain-related physical impairment is associated with significantly increased risk for AUD (McDermott et al., 2018). In addition, 43 % percent of problem drinkers and 75 % of those with AUD report co-morbid moderate to severe pain (Brennan et al., 2005; Brennan and Soohoo, 2013; Larson et al., 2007). Taken together, individuals that use alcohol to cope with pain risk a vicious cycle of increased alcohol use resulting in pain relief acutely but hazardous drinking and exacerbated pain over an extended period.
Observational and cross-sectional studies support the notion that pain is associated with increased alcohol consumption. For example, people with chronic pain and higher ratings of pain unpleasantness report greater motivation to consume alcohol (Lawton and Simpson, 2009). Conversely, individuals with AUD and co-morbid chronic pain have reported pain as a primary reason for initiating alcohol misuse (Sheu et al., 2008). In a recent study, individuals seeking treatment for AUD indicated pain contributes significantly to their use of alcohol and other substances (Boissoneault et al., 2019). To our knowledge, only one study has directly investigated pain as an antecedent for alcohol use, finding that thermal pain induction in a laboratory setting increased reports of desire to consume alcohol (Moskal et al., 2018).
Sex differences have been noted in the literature regarding alcohol-related expectancies of pain relief and the neurobehavioral consequences of alcohol consumption (Horn-Hoffman et al., 2015). In fact, men are more likely to drink than women, drink more often, in larger quantities, and report more alcohol-related consequences (Wilsnack et al., 2000). Other sex differences are important to consider: 1) sex is an important moderator of clinical pain and evidence suggests women are more likely to experience chronic pain than men (Bartley and Palit, 2016); 2) men are more likely to endorse self-medicating pain than women (Riley and King, 2009); and 3) women tend to experience alcohol-related consequences to a greater extent than men (i.e., later initiation of regular drinking but a faster progression to dependence and treatment (Lewis & Nixon, 2014). Taken together, it is essential to consider sex as a moderator for alcohol consumption in the context of pain.
Typical laboratory pain induction methods, including thermal pain, electric shock, and cold-pressor, may be suboptimal for studies of pain as an antecedent for alcohol use because they are very temporally limited and do not produce prolonged functional limitations characteristic of clinically relevant pain. We believe these issues can be overcome by inducing delayed onset muscle soreness (DOMS) in the laboratory setting. Eccentric (elbow straightening/biceps lengthening) action causes mechanical disruption of muscle tissue, along with pain, edema, and temporary weakness (Friden et al., 1983; Nosaka and Clarkson, 1995; Clarkson and Hubal, 2002). Collectively, these post-exertion symptoms are known as DOMS. Pain from DOMS peaks 36–48 hours after exercise and typically resolves within a week (Clarkson and Tremblay, 1988). DOMS offers an excellent model for musculoskeletal pain as an antecedent for alcohol use because, unlike typical laboratory-based pain inductions, it produces relatively long-lasting pain associated with disability and functional limitations.
Furthermore, because musculoskeletal pain is the most common form of chronic pain (Institute of Medicine, 2011), DOMS-associated changes in desire to consume alcohol have high ecological validity. Use of DOMS induction also provides greater experimental control over the mechanism and injury site that cannot be obtained when recruiting patients with pre-existing clinical pain conditions. In this initial study, we used DOMS induction in the dominant elbow flexor muscles to model musculoskeletal pain as an antecedent of subsequent alcohol use characterized by a well-validated behavioral economic task: the Alcohol Purchase Task (APT; e.g. Murphy and MacKillop, 2006; Amlung et al., 2012; see Kaplan et al., 2018 for a systematic review).
Purchase tasks provide efficient approaches for measuring the reinforcing efficacy of a given substance. The basis of a purchase task is to collect information regarding how much of a given substance an individual would purchase at increasing price points. Measuring demand and its influencing variables may elucidate mechanisms underlying maladaptive decision making about substance use and the characterization of potential risk factors for substance use disorders. Outside of hypothetical purchase tasks, demand for a substance can be directly measured through operant procedures that allow participants to earn access to the drug by performing effortful tasks (Bickel et al., 1991). However, hypothetical purchasing tasks allow for less burdensome and more rapid assessments of demand while showing good reliability and strong correspondence to actual drug use (Petry and Bickel, 1998). The APT is sensitive to various manipulations, including changes in demand associated with alcohol-related cues (MacKillop et al., 2010), alcohol priming (Amlung et al., 2015), stress (Amlung and MacKillop, 2014), the presence or absence of next-day responsibilities (Gilbert et al., 2014), and others (Kaplan et al., 2018). Therefore, we aim to establish musculoskeletal pain via DOMS as a clinically relevant model of chronic pain and investigate the potential changes in alcohol demand stemming from this pain induction.
The current study comprises an initial test of a novel methodological approach for improving understanding of pain-alcohol interactions, consisting of experimentally induced musculoskeletal pain and subsequent assessment of alcohol demand using the APT. We hypothesized that DOMS induction would be associated with increases in alcohol demand. Given evidence that men are more likely to report self-medicating pain with alcohol than women (Riley and King, 2009), we hypothesized that DOMS-related increases in alcohol demand would be greater in men than women.
2. Method
2.1. Participants
Participants were recruited from the north central Florida area using flyers. Interested individuals contacted the laboratory and were informed of the basic inclusion criteria, including (a) being between the ages of 21 and 65; (b) consuming at least one alcoholic beverage per week, on average, for the past 6 months; (c) being a non-smoker, as previous research indicates nicotine has acute analgesic effects (Ditre et al., 2016) and pharmacologic interactions between nicotine and alcohol may modify alcohol demand indices and typical use (Amlung et al., 2017); (d) being in good physical health; (e) not participating in a biceps-specific conditioning program in the past 6 months (e.g., bicep curls, pull-ups, Olympic weightlifting, etc.); (f) not reporting any wrist/hand, elbow, or shoulder pain in the last 3 months; (g) having no history of kidney dysfunction, muscle damage, major psychiatric disorder, or any chronic medical condition that may affect pain perception; (h) not consuming any drugs that may affect pain perception or hydration status 24 h before participation in a testing session; and (i) no use of caffeine 4 or fewer hours before a testing session. Recent abstinence from substance use (including caffeine) was confirmed via participant self-report. The University of Florida Institutional Review Board approved the present study, and all participants provided written informed consent prior to data collection.
2.2. Procedure
Participants were randomly assigned to one of two groups: 1) DOMS or 2) Sham DOMS (control group). Participants attended two laboratory sessions separated by 48 h. A within-subjects design was used to facilitate measurement of pain-related changes in alcohol demand, controlling for individual differences in biopsychosocial factors that may influence drinking behavior in the context of musculoskeletal pain. During the first session, participants’ demographic information, health status, pain-related expectancies, and alcohol-use histories were assessed via self-report measures. Quantity-frequency index (QFI), representing average daily alcohol consumption over the 6 months prior to screening, was estimated using an alcohol use questionnaire derived from Cahalan et al. (1969) in units of oz. absolute ethanol consumed per day (one standard drink corresponds to approximately 0.6 oz. of absolute ethanol). Maximum alcohol consumption in a single day (MaxQ) during the 6 months prior to screening was also estimated in terms of oz. absolute ethanol. For both measures, participants were provided standard drink definitions (Saunders et al., 1993) and asked to describe their typical and maximal alcohol consumption in as much detail as possible. Individuals also completed a battery of questionnaires to assess state anxiety (Spielberger State-Trait Anxiety Inventory [STAI]; Spielberger, 1983), depressive symptomatology (Beck Depression Inventory-II [BDI-II]; Beck et al., 1996), and problematic drinking behaviors (Alcohol Use Disorders Identification Test [AUDIT]; Saunders et al., 1993). Participants then completed a maximum voluntary contraction (MVC) assessment, and a DOMS (eccentric exercise) or sham DOMs (concentric exercise) induction procedure at their dominant elbow flexor muscles according to their group assignment. At Session 2, participants in both groups completed follow-up assessments of pain experience and demand for alcohol. Participants returned to the lab for the 48 -h follow-up visit at the same time of day as the first session (always after noon) and completed the APT in the same exam room with the same experimenter. These procedures controlled for effects of time-of-day, environmental context, and cue exposure on alcohol demand. Five days after the second session, participants in both groups received a follow-up email to assess alcohol consumption during each of the five days following their second session. The study timeline is illustrated in Fig. 1. Participants received $50 for completing Session 1 and another $50 after completing Session 2. Participants who completed screening questionnaires but did not meet inclusion criteria were paid $15.
Fig. 1.
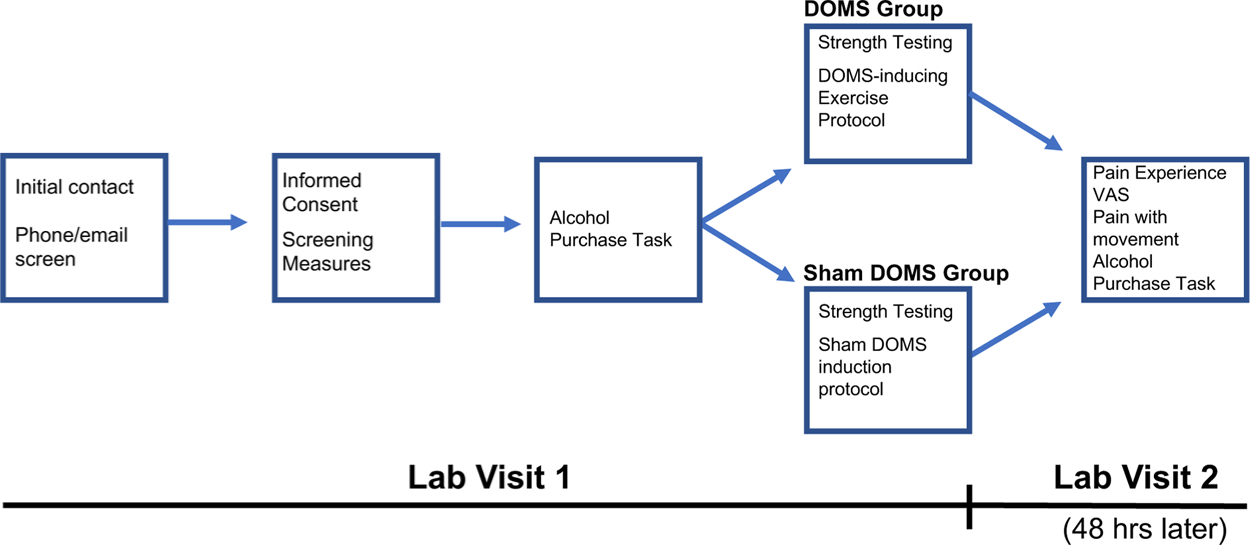
Schematic illustrating the study timeline.
2.3. Isometric biceps strength testing and DOMS-inducing exercise protocol
The exercise protocol was similar to that employed in our previous work (Sevel et al., 2019). Using a Biodex System Isokinetic Dynamometer (Biodex Medical Systems, Shirley, NY), each participant performed an isometric strength test to measure maximum voluntary contraction (MVC) of the dominant elbow flexors. To perform the MVC test, participants were seated within the testing apparatus and were prompted to move through their available range of motion in elbow flexion and extension. The device was then locked into a position halfway between the participant’s full range of motion. The participant was instructed to hold onto the grip handle of the machine and build maximal force by pulling the grip handle toward the body. After five seconds, the participant was instructed to relax. This test was repeated three times. A participant’s MVC was the average of the three trials. After performing the isometric strength test, participants rested for 60 s before completing the randomly assigned exercise protocol: DOMS or Sham DOMS. The DOMS Group participants performed three sets of 15 eccentric (elbow straightening/biceps lengthening) repetitions of the machine arm moving at a speed of 60◦/s. Starting with elbow bent, participants were instructed to resist the machine arm movement until their elbow was fully straightened. After each set of 15 eccentric repetitions, participants rested in a neutral position for 60 s. Consistent with previous work in our laboratory (Sevel et al., 2019), three sets of repetitions were used to ensure participants experienced sufficient soreness to effectively evaluate hypotheses. Sham DOMS Group participants performed a single set of 15 concentric (elbow flexion/biceps shortening) repetitions at a resistance set to 30 % of their MVC. The Sham DOMS exercise condition, which was intended to control for effects of experimenter contact, performing exercise, and repeated APT administration, was designed to be of low intensity and therefore unlikely to cause any significant soreness. For consistency, the DOMS group also completed the MVC assessment. However, the eccentric exercise was not dependent on participants’ MVC strength. Throughout the strength testing and exercise protocol, a member of the study team encouraged participants to maintain maximal effort.
2.4. Alcohol purchase task (APT)
When completing the APT, participants were provided with a standard instruction set like those employed in previous studies (e.g., Murphy and Mackillop, 2006):
In the questionnaire that follows we would like you to pretend to purchase and consume alcohol. Imagine that you could drink right now. The following questions ask how many drinks you would purchase at various prices. The available drinks are standard size beers (12 oz.), wine (5 oz.), shots of hard liquor/distilled spirits (1.5 oz.), or mixed drinks containing one shot of liquor/distilled spirits. You do not have access to any other alcohol than what is available for purchase here and assume you have the same income/savings that you do now. Also, assume that the alcohol you are about to purchase is for your consumption only and you would consume every drink you request. Everything you buy is, therefore, for your own personal use right now. Please respond to these questions honestly. Remember: - Imagine that you could drink right now. - You have no access to alcohol other than what is available for purchase here. - Everything you buy is for your own personal use right now. There are no “right” or “wrong” responses. Please answer all questions honestly, thoughtfully, and to the best of your understanding, as if you were actually in this situation.
Participants reported the number of drinks they would consume at each price point ($0.00, $0.05, $0.10, $0.25, $0.50, $1.00, $1.50 $2.00, $3.00, $4.00, $5.00, $6.00, $8.00, $10.00, $15.00, $20.00, $30.00). These data were used to derive several measures of relative reinforcing efficacy (RRE) including: demand intensity (number of drinks consumed when drinks are free), Omax (maximum expenditure, or the highest amount spent on alcohol), Pmax (price where demand becomes elastic, or the price at which Omax is reached), breakpoint (price when consumption reaches zero), and essential value (inversely proportional to elasticity; Acuff and Murphy, 2017; Hursh and Silberberg, 2008; Koffarnus et al., 2015). Elasticity is described as the point at which demand becomes sensitive to changes in price, or elastic, and has been traditionally derived using an exponential equation. We used the exponentiated demand equation (Koffarnus et al., 2015), which modified the Hursh and Silberberg (2008) equation to allow zero consumption in the curve fit (Koffarnus et al., 2015). The exponentiated demand equation can be written as:
where Q is the consumption of the commodity at cost C, Q0 is derived demand intensity or the consumption of the commodity when it costs nothing, k is a constant calculated using the range of consumption, and a is demand elasticity. This equation was fit to the experimental data using least squares regression in Microsoft Excel. Using the resulting values from this equation, we can calculate essential value (EV) using the following equation (Hursh, 2014):
The APT was administered twice: once in Session 1, prior to DOMS induction, and once during Session 2 in order to assess pain induced changes in alcohol demand.
2.4.1. DOMS-related pain measures
Consistent with our previous work (Sevel et al., 2019), participants in both the DOMS Group and Sham DOMS Group completed two assessments to evaluate pain associated with the exercise protocol during both sessions: (1) Spontaneous Pain: The Pain Experience Visual Analog Scale (PEVAS) consists of seven 100 mm lines. Each assesses a different component of the pain experience: depression, anxiety, frustration, fear, anger, pain intensity, and pain unpleasantness. Each VAS has one anchor on each end and ranges from ‘None’ to ‘Worst imaginable.’ Participants rated each by placing a single mark on each VAS (e.g. “What is your current level of pain intensity?”; Price et al., 1983). (2) Pain with Movement: Using the same VAS anchors, participants rated pain during elbow extension and elbow flexion (e.g. “What is the intensity of your pain when you straighten your elbow?”).
2.5. Analysis strategy
Data were analyzed using IBM SPSS 25. We examined the APT responses to identify any non-systematic data in which a participant reported they would purchase a greater number of drinks at a higher price point than lower price points. This resulted in the removal of one participant’s data from the analysis. No outliers (defined as +/− 3 standard deviations from the mean) were identified in APT indices. Similarly, no biologically implausible responses on the APT were noted. We first computed zero-order Pearson’s r correlations between pre-exercise APT measures, post-exercise APT measures, QFI, and MaxQ in order to determine correlations of (a) each APT index with itself across repeated administrations, (b) each APT index with QFI and MaxQ, and (c) each APT index with other APT indices. Then, hypotheses related to changes in alcohol demand post DOMS induction were assessed using a 2 (group: DOMS vs Sham DOMS) x 2 (sex: men vs. women) x 2 (time: Visit 1 vs Visit 2) mixed analysis of variance (ANOVA). Separate analyses were conducted for demand intensity, breakpoint, EV, Pmax, and Omax.
3. Results
3.1. Participant demographics
Participants (N = 53) averaged 26.28 years of age (SD = 9.908) and 16.32 years of education (SD = 2.128). Of the participants, 83 % (n = 44) identified as White, 3.8 % (n = 2) identified as Black or African American, 7.5 % (n = 4) identified as Asian or Pacific Islander, and 5.7 % (n = 3) identified as another race or multiple races. A subset of participants (17 %; n = 9) identified as Hispanic or Latinx. BDI-II and STAI-trait total mean scores were 4.02 (SD = 4.448) and 32.74 (SD = 8.629) respectively. Participants reported consuming 0.843 (SD = .758) oz. of absolute EtOH per day on average (quantity-frequency index, or QFI; ~1.4 standard drinks) during the 6 months prior to assessment and a maximum of 5.343 (SD = 2.698) oz. of absolute EtOH within a single 24 -h period (maximum quantity, or MaxQ; ~8.9 standard drinks). The mean AUDIT score was 6.81 (SD = 3.976). A breakdown of these measures by group and sex is listed in Table 1.
Table 1.
Participant demographic characteristics.
| DOMS | Sham DOMS | |||
|---|---|---|---|---|
| Men | Women | Men | Women | |
| Mean (SD) | Mean (SD) | Mean (SD) | Mean (SD) | |
| n = 12 | n = 14 | n = 11 | n = 16 | |
|
| ||||
| Age (years) | 23.92 (3.29) | 22.42 (2.44) | 31.64 (13.85) | 27.75 (12.56) |
| Education (years) | 16.58 (1.88) | 16.14 (1.75) | 17.45 (2.98) | 15.50 (1.67) |
| BDI-II (total) | 2.42 (2.88) | 4.71 (4.70) | 5.18 (5.51) | 3.81 (4.43) |
| STAI (trait total) | 31.00 (7.46) | 34.86 (8.09) | 32.91 (9.87) | 32.06 (9.41) |
| QFI (oz. EtOH/day) | 1.31 (0.99) | 0.52 (0.25) | 1.00 (1.00) | 0.66 (0.46) |
| MaxQ (oz. EtOH) | 6.54 (3.06) | 4.87 (2.66) | 5.91 (2.83) | 4.47 (2.11) |
| AUDIT (total) | 8.92 (5.67) | 6.14 (2.38) | 6.64 (4.32) | 5.94 (2.98) |
3.2. Effect of DOMS intervention
The Pain Experience Visual Analog Scale (PEVAS) showed no significant differences between the DOMS and Sham group in reported mood at 48 -h follow-up (see Table 2). In the spontaneous pain and pain with movement measures, compared to the Sham group, the DOMS group reported significantly more pain intensity with extension (t(31.6) = 7.445, p < .0001; d = 2.06), with flexion (t(32.5) = 6.403, p < .0001; d = 1.77), and at rest (t(28.4) = 3.556, p = .001; d = .99), as well as greater pain unpleasantness at rest (t(27.8) = 3.102, p = .004; d = .86) on a 100 point VAS. These effects are illustrated in Fig. 2.
Table 2.
PEVAS Mood Measures at 48 -h Follow-up.
| DOMS | Sham DOMS | t (df = 51) | p- value | Cohen’s d | |
|---|---|---|---|---|---|
|
| |||||
| Mean (SD) n = 26 |
Mean (SD) n = 27 |
||||
| Depression | 9.06 (12.58) | 6.44 (13.40) | .73 | .47 | 0.20 |
| Anxiety | 17.56 (18.28) | 11.48 (14.22) | 1.35 | .18 | 0.37 |
| Frustration | 15.27 (24.47) | 8.93 (12.04) | 1.11 | .27 | 0.33 |
| Fear | 5.29 (9.01) | 3.56 (8.03) | .74 | .46 | 0.20 |
| Anger | 10.15 (20.93) | 2.41 (4.96) | 1.84 | .08 | 0.51 |
Fig. 2.
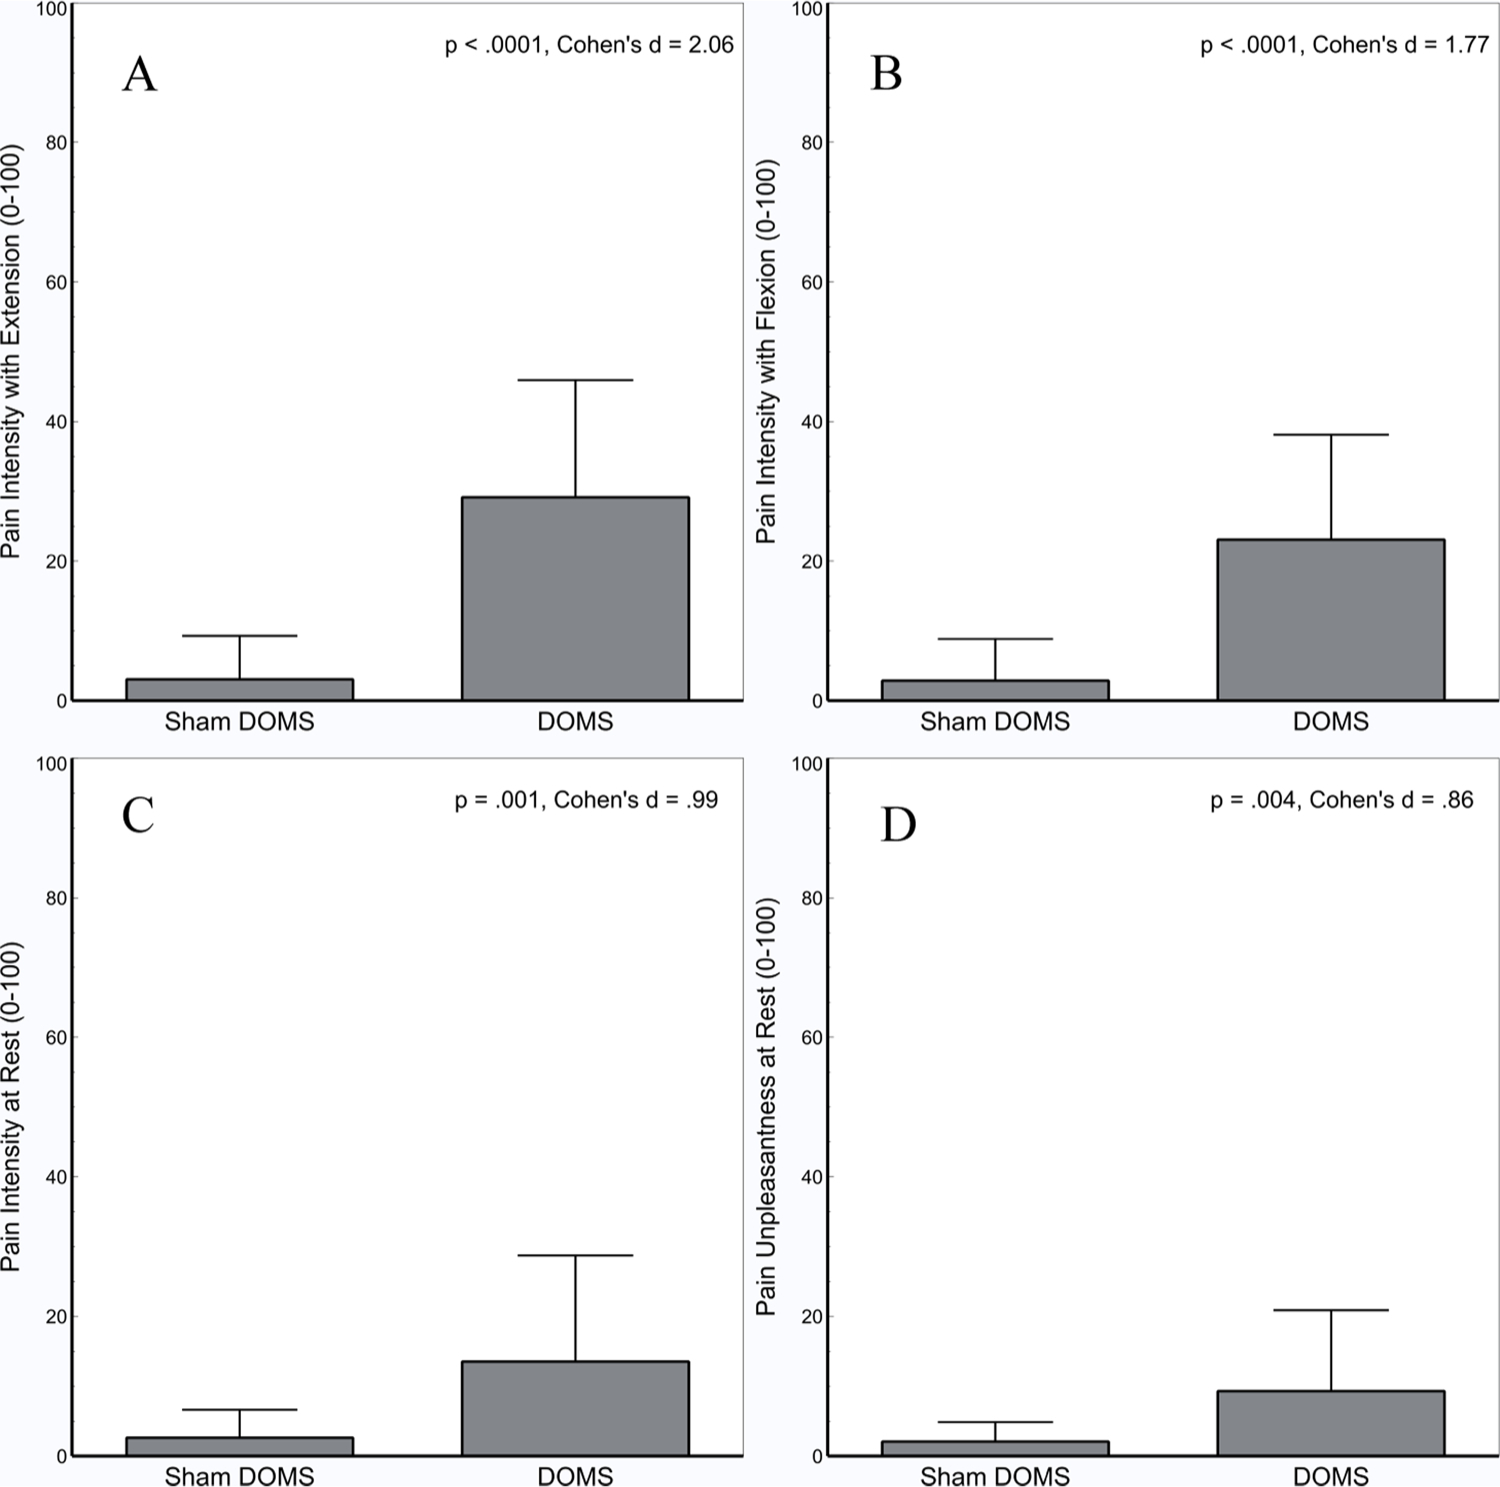
Eccentric exercise associated with the DOMS induction significantly increased pain intensity with Extension (A), Flexion (B), at Rest (C), and pain unpleasantness at rest (D) compared to the Sham DOMS condition. Error bars depict standard deviation.
3.3. Correlation of typical drinking behavior and APT indices
Correlations between pre-exercise APT indices, post-exercise APT indices, and QFI and MaxQ are presented in Table 3. Each APT index was significantly correlated with itself from pre- to post-exercise, and interrelations between APT indices were similar to those reported by previous studies (MacKillop et al., 2009). Specifically, breakpoint, EV, Pmax, and Omax were significantly correlated with each other, but correlations of these variables with demand intensity were either non-significant or significant, but statistically weak. Finally, demand intensity correlated significantly with both QFI and MaxQ, while EV and Omax correlated with MaxQ.
Table 3.
Correlation of APT Demand indices, QFI, and MaxQ.
| Variables | Intensity Pre |
Break-point Pre |
EV Pre | Pmax Pre |
Omax Pre |
Intensity Post |
Break-point Post |
EV Post | Pmax Post |
Omax Post |
QFI | MaxQ |
|---|---|---|---|---|---|---|---|---|---|---|---|---|
|
| ||||||||||||
| Intensity Pre | – | |||||||||||
| Breakpoint Pre | .075 | – | ||||||||||
| EV Pre | .380** | .629** | – | |||||||||
| Pmax Pre | .020 | .688** | .354** | – | ||||||||
| Omax Pre | .389** | .572** | .980** | .365** | – | |||||||
| Intensity Post | .891** | .070 | .402** | −.057 | .409** | – | ||||||
| Breakpoint | .138 | .700** | .559** | .616** | .501** | .291* | – | |||||
| Post | ||||||||||||
| EV Post | .359** | .580** | .923** | .362** | .904** | .474** | .685** | – | ||||
| Pmax Post | −.234 | .570** | .577** | .754** | .523** | −.150 | .608** | .670** | – | |||
| Omax Post | .359** | .580** | .923** | .426** | .925** | .474** | .685** | 1.00** | .523** | – | ||
| QFI | .357** | .037 | .122 | .114 | .151 | .364** | .428 | .090 | −.083 | .083 | – | |
| MaxQ | .502** | .160 | .479** | .177 | .521** | .464** | .177 | .407** | −.002 | .401** | .702** | – |
= p < .01
= p < .05.
3.4. Effects of DOMS induction on alcohol demand
Differences in pre- to post-test APT measures are depicted in Fig. 3. Demand curves indicating the average number of drinks purchased at each price point for men and women in the DOMS and Sham DOMS groups are depicted in log-transformed (Fig. 4A and B) and raw units (Fig. 4C and D). Alcohol demand indices are listed by group and sex in Table 4.
Fig. 3.
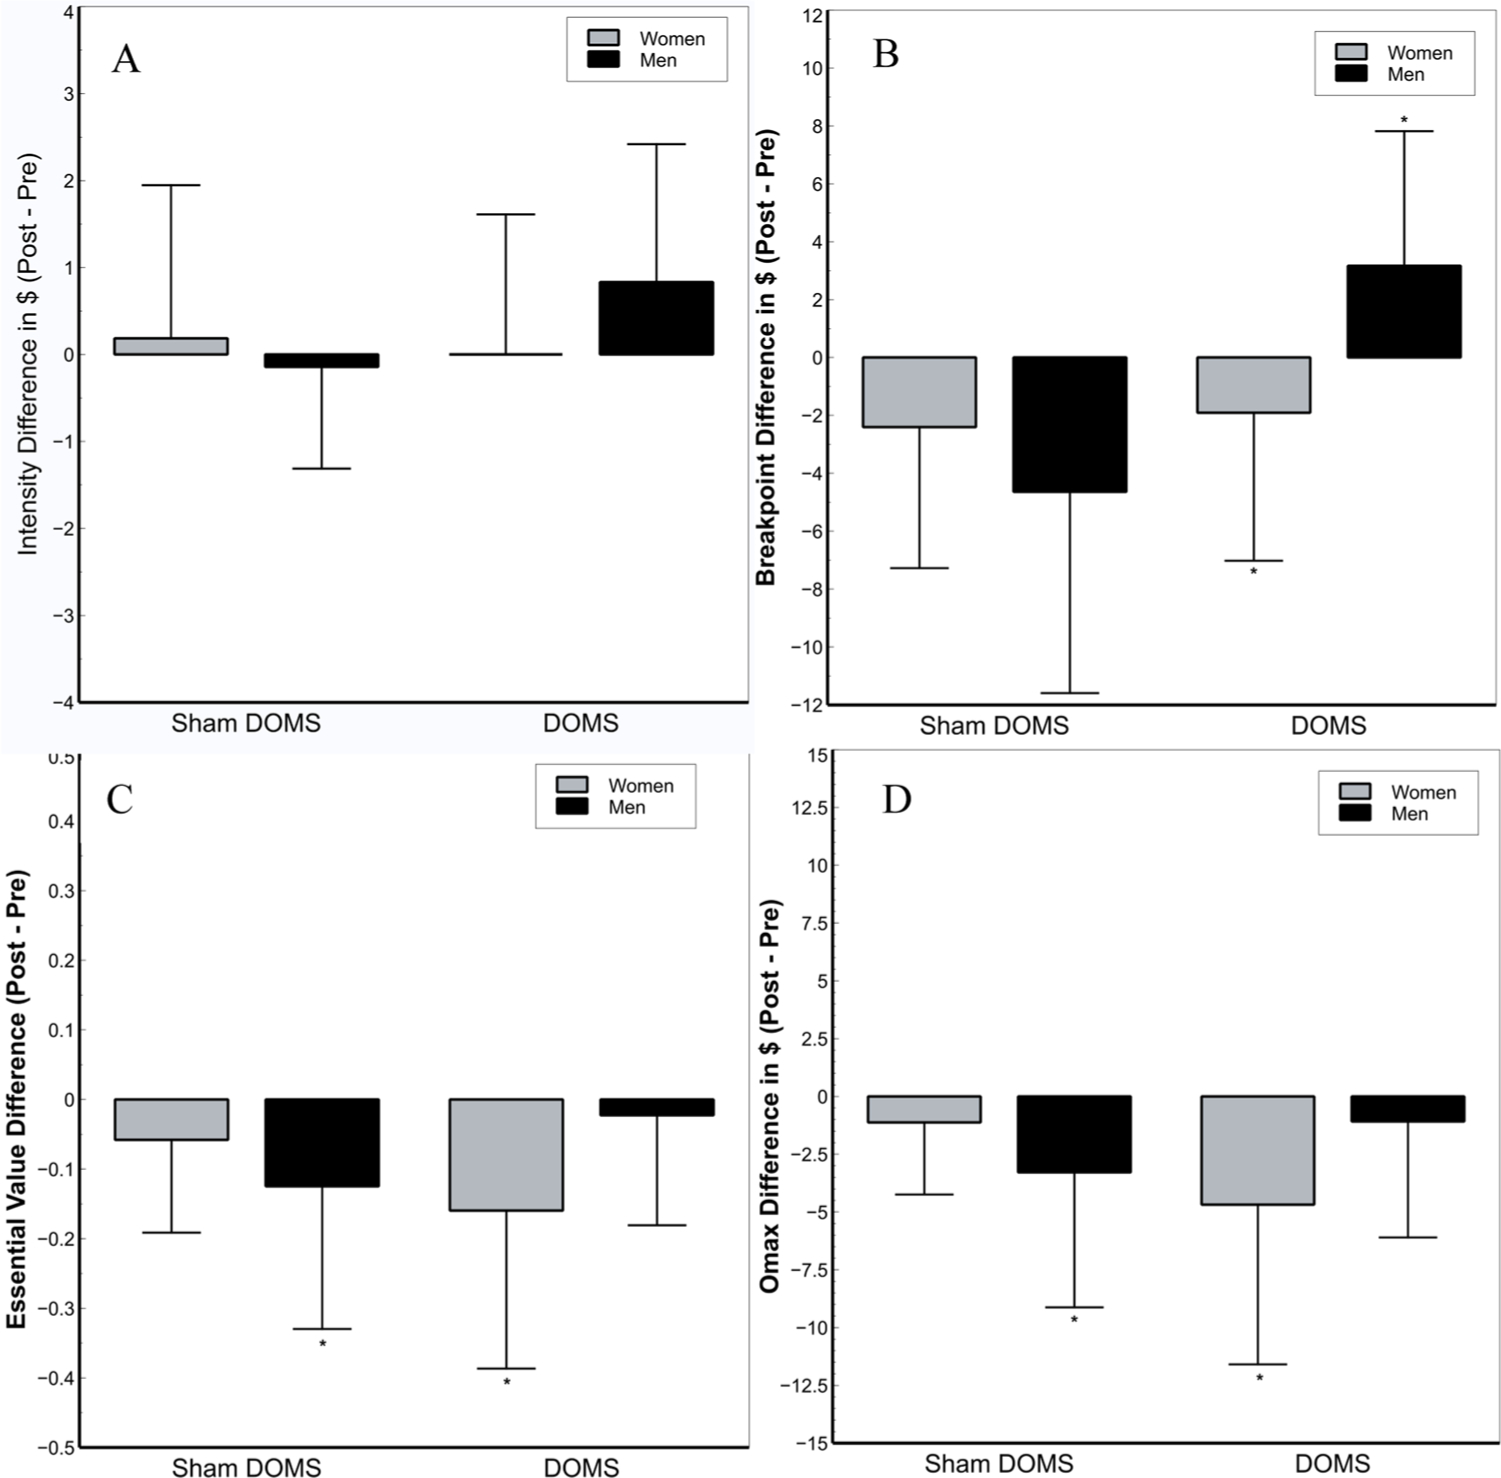
Effects of the exercise intervention on Intensity (A), Breakpoint (B), and Essential Value (C) by sex and group depicting using difference scores. A) No significant main or interactive effects of group, sex, or time were noted for demand intensity. B) Breakpoint significantly decreased from pre- to post-test for women in the DOMS group (p = .003) and significantly increased in men in the DOMS group (p = .05). No significant changes in breakpoint for women (p = .086) and men (p = .26) in the Sham DOMS group were noted. C) EV decreased significantly from pre- to post-test in women in the DOMS group (p = .013), but not men (p = .67). Men in the Sham group also showed a significant drop in EV from pre- to post-test (p = .005). D) Like EV, Omax decreased significantly from pre- to post-test in women in the DOMS group (p = .023), but not men (p = .48). Men in the Sham group also showed a significant drop in Omax from pre- to post-test (p = .005). Error bars depict standard deviation. *: denotes a significant change from pre- to post-test (p < .05).
Fig. 4.
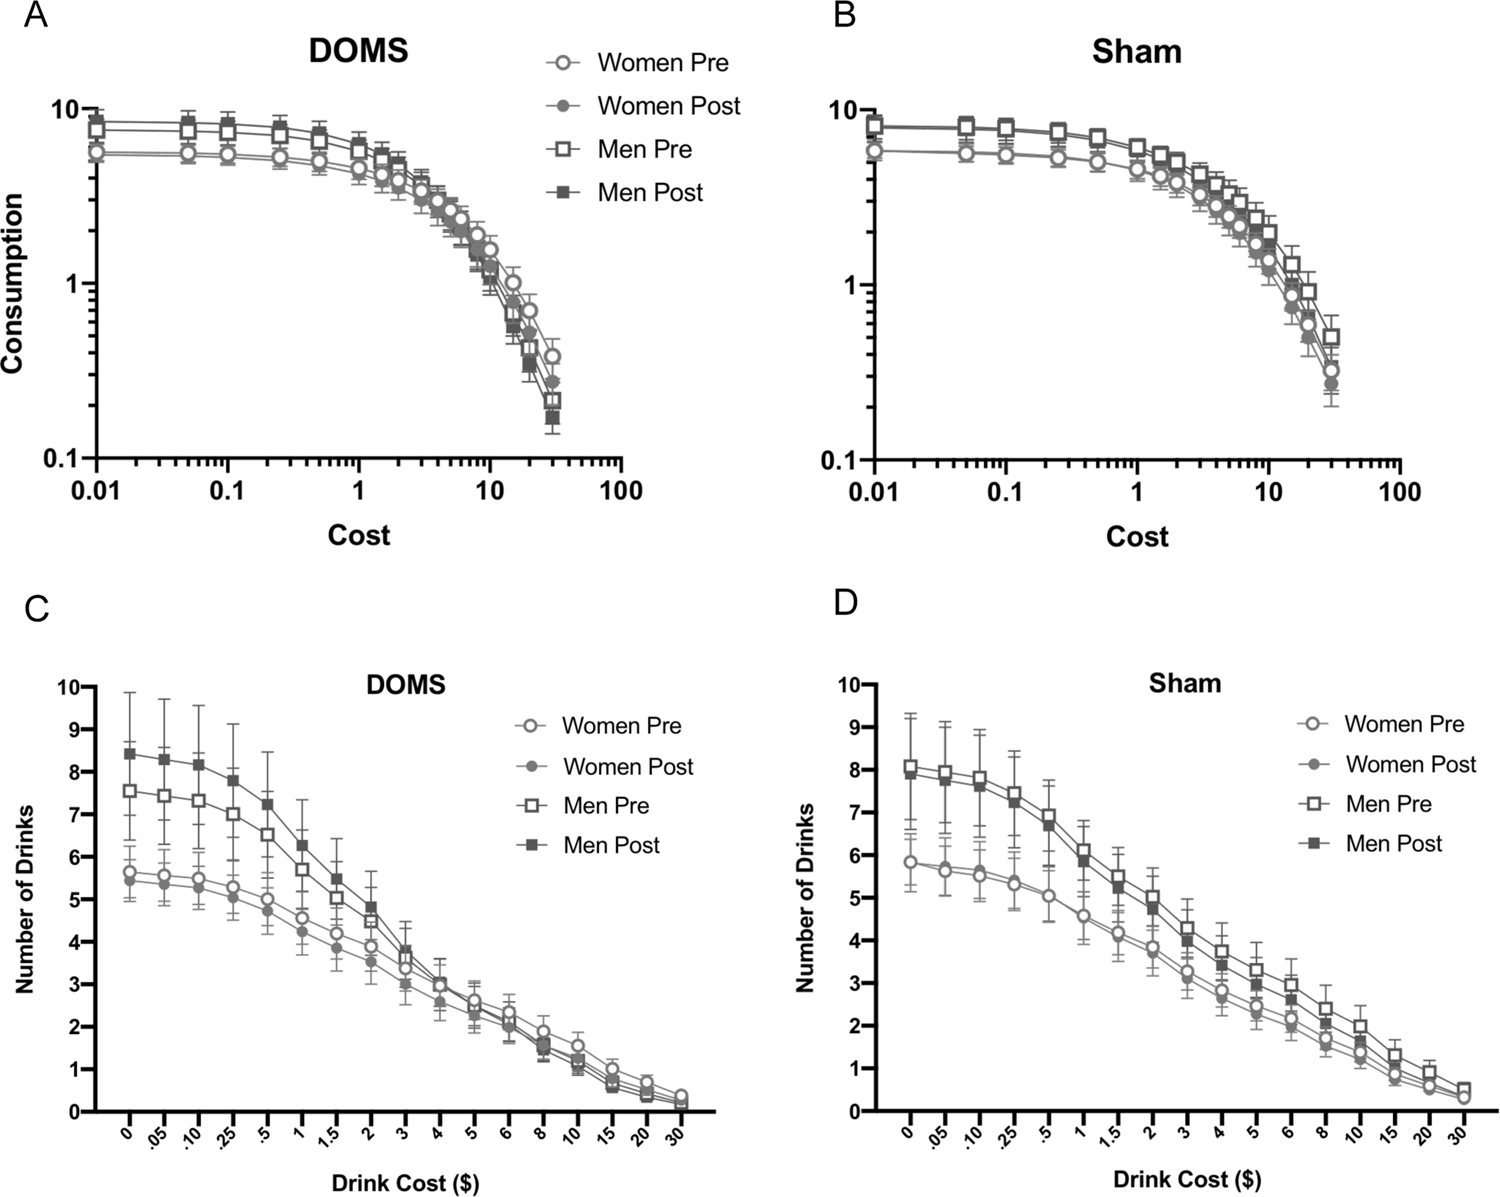
Average number of hypothetical standard drinks purchased at each price point in the DOMS Group and Sham DOMS Group separated by sex and depicted on a log-log scale (A and B, respectively) and in raw units (C and D, respectively). Error bars depict standard error of the mean. The curves represent the exponentiated demand equation fitted to the experimental data (Koffarnus et al., 2015; adapted from Hursh and Silberberg, 2008).
Table 4.
APT Demand Indices.
| DOMS | Sham DOMS | |||
|---|---|---|---|---|
| Men | Women | Men | Women | |
| Mean (SD) | Mean (SD) | Mean (SD) | Mean (SD) | |
| n = 12 | n = 14 | n = 11 | n = 16 | |
|
| ||||
| Breakpoint Pre | 11.67 (4.87) | 17.29 (8.62) | 17.00 (6.90) | 16.66 (9.42) |
| Breakpoint Post | 14.83 (7.49) | 12.64 (6.57) | 15.09 (8.02) | 14.25 (8.64) |
| Intensity Pre | 7.08 (3.63) | 5.21 (2.19) | 7.55 (3.72) | 5.50 (2.00) |
| Intensity Post | 7.92 (4.54) | 5.07 (1.73) | 7.55 (3.93) | 5.69 (2.70) |
| Pmax Pre | 4.17 (1.79) | 6.46 (3.64) | 9.22 (7.89) | 7.34 (7.51) |
| Pmax Post | 5.21 (3.74) | 5.32 (2.66) | 7.18 (4.58) | 5.56 (3.70) |
| Omax Pre | 15.50 (10.59) | 17.68 (11.51) | 25.09 (20.71) | 15.94 (8.88) |
| Omax Post | 14.42 (7.27) | 14.39 (9.64) | 20.41 (17.28) | 14.81 (9.27) |
| EV Pre | 0.51 (0.37) | 0.63 (0.46) | 0.81 (0.65) | 0.58 (0.36) |
| EV Post | 0.49 (0.30) | 0.51 (0.38) | 0.66 (0.49) | 0.52 (0.35) |
3.4.1. Demand intensity (Fig. 3A):
A main effect of sex on demand intensity (F1,49 = 6.73, p = .012, η2p = 0.12) indicated men had significantly higher demand intensity than women at both pre- and post-test, regardless of group assignment. Analyses indicated no other significant main or interactive effects of time, group, or sex on demand intensity of alcohol demand (F1,49 = 1.83, p > 0.18, η2p = 0.036). Because visual examination of demand curves (Fig. 4a) suggested greater demand intensity at post- than pre-test in men in the DOMS group, exploratory post-hoc dependent t-tests were conducted to determine the effect of time on demand intensity in each combination of group and sex. However, increases in demand intensity in men in the DOMS group from pre- to post-test were not significant (p = .069, η2p = 0.066). This effect did not approach significance for any other combination of sex and group (p > .65).
3.4.2. Breakpoint (Fig. 3B):
A significant group X sex X time interaction was detected for breakpoint (F1,49 = 5.74, p = .02, η2p = 0.11), superseding a significant sex × time interaction (F1,49 = 7.41, p = .009, η2p = 0.13). Decomposition indicated that, from pre- to post-test, breakpoint significantly decreased in women in the DOMS group (p = .003, η2p = 0.169) and increased in men in the DOMS group (p = .05, η2p = .075). Time point did not significantly affect breakpoint in women (p = .086, η2p = 0.059) or men in the Sham DOMS group (p = .26, η2p = 0.026). No other main or interactive effects were noted (F1,49 < 3.60, p > .064, η2p < 0.068).
3.4.3. EV (Fig. 3C):
A group X sex X time interaction (F1,49 = 4.12, p = .048, η2p = .078) qualifying a main effect of time (F1,49 = 13.18, p = .001, η2p = .212) was noted for EV. Women in the DOMS group (p = .013, η2p = .12) and men in the Sham DOMS group (p = .005, η2p = 0.149) showed significant drops in EV from pre- to post-test. However, no effects were noted for men in the DOMS group (p = .67, η2p = 0.004) or women in the Sham DOMS group (p = .21, η2p = 0.03).
3.4.4. Omax (Fig. 3D):
A group X sex X time interaction (F1,49 = 3.93, p = .05, η2p = .074) was observed for Omax, which qualified a main effect of time such that demand tended to decrease from pre- to post-test (F1,49 = 12.25, p = .001, η2p = .20). Decomposition of the interaction indicated Omax decreased significantly between assessment points for women in the DOMS group (p = .02, η2p = .10), but not men (p = 48, η2p = .01). In addition, Omax was unchanged for women in the Sham DOMS group (p = .39, η2p = .02), but decreased in men (p = .005, η2p = .15). 3.4.5 Pmax: No significant main or interactive effects of group, sex, or time were noted for Pmax (F1,49 < 3.25, p > .078, η2p < .06).
4. Discussion
In this study, we sought to determine to what extent DOMS pain affects motivation to consume alcohol, as reflected via alcohol demand indices measured using the APT. We were successful in producing DOMS-related pain as reflected by significantly greater ratings of pain upon extension, flexion, at rest, and pain intensity in the DOMS group compared to the Sham DOMS group at 48 -h follow-up.
We found similar correlations between APT indices and self-report measures of both typical and maximal drinking as previous groups (e. g., MacKillop et al., 2009), providing support and further evidence that APT metrics map onto clinically relevant measures of drinking behavior. Consistent with hypotheses and epidemiologic data on self-medicating pain with alcohol, DOMS induction resulted in sex-specific effects on breakpoint, EV, and Omax. However, the scope and directionality of these effects were unexpected. Rather than finding DOMS-related increases in alcohol demand in both men and women that were exaggerated in men, we found that DOMS tended to increase alcohol demand in men but robustly decreased demand in women. Specifically, the increase in breakpoint for men in the DOMS group between time points suggests men may persist in alcohol-seeking behavior at high prices when experiencing musculoskeletal pain, even though EV and Omax are not significantly changed. In other words, although the overall value of alcohol was unchanged (i.e., if there was a commodity that would previously compete with alcohol, it will would still compete, and vice versa), men are more likely to persist in drinking behavior if price increases when in pain. On the other hand, results suggested that women are less likely to drink in the context of acute musculoskeletal pain. EV of alcohol decreased, and women indicated they were not willing to pay as much for alcohol (i.e., lower persistence) after DOMS induction.
Taken together, our results have several important implications. First, we demonstrate that APT demand metrics are sensitive to the effects of experimentally induced musculoskeletal pain, suggesting behavioral economic approaches may be valuable for improving mechanistic understanding of factors underlying pain as an antecedent for alcohol use. They also highlight sex differences as a potential risk factor for self-medicating pain with alcohol. Several risk factors for self-medicating pain with alcohol have been previously identified, including younger age, male sex, higher SES, being White/Caucasian, greater pain severity, longer pain duration, depression, and use of prescription analgesics (Riley and King, 2009). Our data provide additional evidence that men may be at differential risk for self-medicating pain using alcohol. Thus, in the context of significantly greater intensity of alcohol demand in men than women, the interactive effects we detected suggest men in with musculoskeletal pain may be at particular risk for development of negative alcohol-related consequences or alcohol use disorder and imply this group may benefit especially from clinical interventions intended to attenuate or prevent self-medication behavior.
By the same token, we were surprised to note that the DOMS-related pain we induced appeared to increase elasticity of demand in women, consistent with a decrease in the relative reinforcing efficacy of alcohol in the context of acute musculoskeletal pain. Additional studies are needed to determine whether this finding is replicable across samples taking to account potentially critical moderating variables including family history of alcoholism, personal history of chronic heavy drinking, and personality factors. It is also unclear whether these effects might differ in the context of chronic musculoskeletal pain, or other types of pain (e.g., neuropathic or widespread pain).
Although the mechanism(s) underlying the sex-conditional effects of acute musculoskeletal pain on alcohol demand are unclear, several possibilities are worthy of investigation. A substantive literature indicates that men in Western cultures are less willing than women to report pain, and to seek medical care when they experience pain (Robinson et al., 2001). Thus, it is possible that men may be more inclined to seek alternative methods for pain relief, including self-management via alcohol consumption, than women. It is also possible that men have weaker expectancies of alcohol-related adverse consequences than women, stronger expectancies that alcohol will provide pain relief, or both. Future studies should explore expectancy differences as a potential mechanism underlying sex differences in the effect of pain on alcohol demand.
This study has several notable strengths, including use of a clinically relevant musculoskeletal pain induction and inclusion of an appropriate control group (Sham DOMS) for the effects of exercise and repeated administration of the APT. In addition, our results demonstrate the utility of the APT and/or other hypothetical purchase tasks for understanding mechanisms and moderators underlying pain as an antecedent for substance use. Furthermore, although necessarily preliminary, given the relatively small sample size, our results will help ensure future replications and extensions of this work have empirically derived effect sizes on which to base their power analyses. Certain limitations of the study also bear consideration.
First, we did not find significantly elevated measures of negative affect in the DOMS group compared to the Sham DOMS group. Given evidence indicating negative affect may mediate the effect of pain on subsequent substance use (Witkiewitz et al., 2015; Moskal et al., 2018), it is possible that even greater effects on alcohol demand could be observed if subsequent studies take advantage of DOMS interventions producing significant elevations in negative affect. Although the lack of elevated negative affect we observed may reflect a limitation of DOMS as a clinical pain analog, including additional repetitions of eccentric contractions during DOMS induction (resulting in greater pain severity) or targeting postural muscles more consistently activated in day-to-day activities may better model the experience of clinical pain. It is also possible that the pattern of sex-specific effects we observed may differ in the context of elevated negative affect. In our recently proposed theoretical model regarding psychosocial factors underlying pain as an antecedent for substance use (Ferguson et al., 2020), we note current evidence suggests pain-related negative affect is likely a critical mediator of this pathway, regardless whether pain is chronic or acute. However, given that the negative biopsychosocial context of chronic pain is more likely to be associated with significant pain-related negative affect than acute pain, it would be useful for future studies to examine the impact of chronic pain on alcohol demand (e.g., low back pain or osteoarthritis).
Given the current study sample is not a clinical population, it is also worth noting that our findings may not generalize to certain important groups, including individuals who regularly engage in heavy alcohol consumption or those with chronic pain conditions. It is also possible that income, which was not assessed in this study, may moderate the effect of pain on alcohol demand. However, years of education, which serves as a proxy for socioeconomic status, did not meaningfully alter the pattern of results when included as a covariate (results not shown). As the majority of participants had completed some college or attained a bachelor’s degree, it is possible that these results would not generalize to populations with lower educational attainment. Similarly, although the age of participants ranged from 21 to 63, most of the study population (91 %) were between the ages of 21 and 35. Inclusion of age as a covariate in analyses did not change our results. However, both pain prevalence and drinking patterns may change with advancing age and future studies focusing on older adults may be beneficial.
An individual’s consumption of alcohol may differ from the responses to a hypothetical purchase task given that numerous factors may influence the actual consumption of alcohol above and beyond motivation to drink. Additional research is needed to determine whether changes in alcohol demand associated with the DOMS induction procedure correspond with actual intake. Furthermore, although inclusion of typical daily drinking as a covariate in mixed models did not alter the pattern of sex-specific effects of DOMS on alcohol demand we observed (results not shown), future studies should examine other biopsychosocial factors that may explain individual differences in the effect of pain on alcohol demand and subsequent consumption, including pain-related attitudes (e.g., fear of pain, pain catastrophizing) and impulsivity (e.g., negative urgency; Ferguson et al., 2020).
Abstinence from recent substance use prior to laboratory sessions, which could influence APT responses, was confirmed via participant self-report. Although we do not have reason to disbelieve participants’ assurances of abstinence, objective confirmation using urine toxicology screens and breath alcohol testing may benefit future studies.
Finally, we did not assess the effects of pain on demand for substances other than alcohol in this study (e.g., cannabis or opioids). Given rapid sociocultural shifts in the perception of cannabis as an effective analgesic and public health concerns regarding opioid addiction and overdose, future studies should consider these substances as well.
5. Conclusions
In summary, results demonstrate that behavioral economic measures of alcohol demand are responsive to experimentally induced musculoskeletal pain and provide preliminary evidence that behavioral economic approaches may provide critical insight to biopsychosocial factors underlying motivation to consume alcohol in the context of pain. These data also provide further evidence that men experiencing pain may be at differential risk for engaging in hazardous drinking behaviors and development of alcohol use disorder.
Public health significance statements.
This study found that experimentally induced musculoskeletal pain had sex-specific effects on alcohol demand, increasing demand in men and decreasing demand in women. Results suggest men in pain may be at differential risk for engaging in hazardous drinking and highlight the need for additional studies examining pain as an antecedent for alcohol use.
Acknowledgements
The authors wish to thank the participants of this study for their willingness to participate.
Role of funding source
Funding for this study was provided by the UF Center for Pain Research and Behavioral Health and College of Public Health and Health Professions. Support for the research team was provided by National Institute on Alcohol Abuse and Alcoholism grants R21AA026805 (JB and MER; PI: JB) and R01AA025337 (BS, MER, JB; PI: JB). The content of this article is solely the responsibility of the authors and does not necessarily represent the official view of the National Institutes of Health.
Footnotes
Declaration of Competing Interest
The authors declare no conflict of interest.
References
- Acuff SF, Murphy JG, 2017. Further examination of the temporal stability of alcohol demand. Behav. Processes 141, 33–41. [DOI] [PMC free article] [PubMed] [Google Scholar]
- American Psychiatric Association, 2013. Diagnostic and Statistical Manual of Mental Disorders, 5th ed. American Psychiatric Association, Washington, DC. [Google Scholar]
- Amlung M, MacKillop J, 2014. Understanding the effects of stress and alcohol cues on motivation for alcohol via behavioral economics. Alcohol. Clin. Exp. Res 38 (6), 1780–1789. [DOI] [PMC free article] [PubMed] [Google Scholar]
- Amlung M, Acker J, Stojek M, Murphy JG, MacKillop J, 2012. Is talk ‘cheap’? An initial investigation of the equivalence of alcohol purchase task performance for hypothetical and actual rewards. Alcohol. Clin. Exp. Res 36 (4), 716–724. [DOI] [PMC free article] [PubMed] [Google Scholar]
- Amlung M, McCarty KN, Morris DH, Tsai CL, McCarthy DM, 2015. Increased behavioral economic demand and craving for alcohol following a laboratory alcohol challenge. Addiction 110 (9), 1421–1428. 10.1111/add.12897. [DOI] [PMC free article] [PubMed] [Google Scholar]
- Amlung M, MacKillop J, Monti PM, Miranda R Jr., 2017. Elevated behavioral economic demand for alcohol in a community sample of heavy drinking smokers. J. Stud. Alcohol Drugs 78 (4), 623–628. [DOI] [PMC free article] [PubMed] [Google Scholar]
- Bartley EJ, Palit S, 2016. Gender and pain. Curr. Anesthesiol. Rep 6, 344–353. [Google Scholar]
- Beck AT, Steer RA, Brown GK, 1996. Beck Depression Inventory, 2nd ed. The Psychological Corporation, San Antonio. [Google Scholar]
- Bickel WK, DeGrandpre RJ, Hughes JR, Higgins ST, 1991. Behavioral economics of drug self-administration. II. A unit-price analysis of cigarette smoking. J. Exp. Anal. Behav 55 (2), 145–154. 10.1901/jeab.1991.55-145. [DOI] [PMC free article] [PubMed] [Google Scholar]
- Boissoneault J, Lewis B, Nixon SJ, 2019. Characterizing chronic pain and alcohol use trajectory among treatment-seeking alcoholics. Alcohol 75, 47–54. [DOI] [PubMed] [Google Scholar]
- Brennan PL, Soohoo S, 2013. Pain and use of alcohol in later life: prospective evidence from the health and retirement study. J. Aging Health 25 (4), 656–677. 10.1177/0898264313484058. [DOI] [PMC free article] [PubMed] [Google Scholar]
- Brennan PL, Schutte KK, Moos RH, 2005. Pain and use of alcohol to manage pain: prevalence and 3-year outcomes among older problem and non-problem drinkers. Addiction 100 (6), 777–786. 10.1111/j.1360-0443.2005.01074.x. [DOI] [PubMed] [Google Scholar]
- Cahalan D, Cissin L, Crossley H, 1969. American Drinking Practices: A National Study of Drinking Behaviors and Attitudes (Monograph No. 6). Rutgers Center of Alcohol Studies., New Brunswick, NJ. [Google Scholar]
- Clarkson PM, Hubal MJ, 2002. Exercise-induced muscle damage in humans. Am. J. Phys. Med. Rehabil 81 (11 Suppl), S52–S69. 10.1097/01.PHM.0000029772.45258.43. [DOI] [PubMed] [Google Scholar]
- Clarkson PM, Tremblay I, 1988. Exercise-induced muscle damage, repair, and adaptation in humans. J. Appl. Physiol 65 (1), 1–6. 10.1152/jappl.1988.65.1.1. [DOI] [PubMed] [Google Scholar]
- Ditre JW, Heckman BW, Zale EL, Kosiba JD, Maisto SA, 2016. Acute analgesic effects of nicotine and tobacco in humans: a meta-analysis. Pain 157 (7), 1373–1381. [DOI] [PMC free article] [PubMed] [Google Scholar]
- Ditre JW, Zale EL, LaRowe LR (in press). A Reciprocal Model of Pain and Substance Use: Transdiagnostic Considerations, Clinical Implications, and Future Directions. Annual Review of Clinical Psychology. [DOI] [PubMed] [Google Scholar]
- Egli M, Koob GF, Edwards S, 2012. Alcohol dependence as a chronic pain disorder. Neurosci. Biobehav. Rev 36 (10), 2179–2192. 10.1016/j.neubiorev.2012.07.010. [DOI] [PMC free article] [PubMed] [Google Scholar]
- Ferguson E, Zale E, Ditre J, Wesolowicz D, Stennett B, Robinson M, Boissoneault J, 2020. CANUE: A Theoretical Model of Pain As an Antecedent for Substance Use. Annals of Behavioral Medicine. [DOI] [PMC free article] [PubMed] [Google Scholar]
- Friden J, Sjostrom M, Ekblom B, 1983. Myofibrillar damage following intense eccentric exercise in man. Int. J. Sports Med 4 (3), 170–176. [DOI] [PubMed] [Google Scholar]
- Gilbert LJ, Murphy JG, Dennhardt AA, 2014. A behavioral economic analysis of the effect of next-day responsibilities on drinking. Psychol. Addict. Behav 28 (4), 1253–1258. 10.1037/a0038369. [DOI] [PubMed] [Google Scholar]
- Hommez G, Ongena B, Cauwels R, De Paepe P, Christiaens V, Jacquet W, 2018. Analgesia (mis)usage on a dental emergency service: a patient survey. Clin. Oral Investig 22 (3), 1297–1302. 10.1007/s00784-017-2228-6. [DOI] [PubMed] [Google Scholar]
- Horn-Hoffman C, Büscher P, Lautenbacher S, Wolstein J, 2015. The effect of nonrecurring alcohol administration on pain perception in humans: a systematic review. J. Pain Res 8, 175–187. [DOI] [PMC free article] [PubMed] [Google Scholar]
- Hursh SR, 2014. Behavioral economics and the analysis of consumption and choice. In: McSweeney FK, Murphy ES (Eds.), The Wiley Blackwell Handbook of Operant and Classical Conditioning. Wiley-Blackwell, pp. 275–305. 10.1002/9781118468135.ch12. [DOI] [Google Scholar]
- Hursh SR, Silberberg A, 2008. Economic demand and essential value. Psychol. Rev. 115 (1), 186–198. 10.1037/0033-295X.115.1.186. [DOI] [PubMed] [Google Scholar]
- Institute of Medicine, 2011. Relieving Pain in America: A Blueprint for Transforming Prevention, Care, Education, and Research. National Academies Press, Washington, DC. [PubMed] [Google Scholar]
- Kaplan BA, Foster RNS, Reed DD, Amlung M, Murphy JG, MacKillop J, 2018. Understanding alcohol motivation using the alcohol purchase task: a methodological systematic review. Drug Alcohol Depend. 191, 117–140. 10.1016/j.drugalcdep.2018.06.029. [DOI] [PubMed] [Google Scholar]
- Koffarnus MN, Franck CT, Stein JS, Bickel WK, 2015. A modified exponential behavioral economic demand model to better describe consumption data. Exp. Clin. Psychopharmacol 23 (6), 504–512. 10.1037/pha0000045. [DOI] [PMC free article] [PubMed] [Google Scholar]
- Larson MJ, Paasche-Orlow M, Cheng DM, Lloyd-Travaglini C, Saitz R, Samet JH, 2007. Persistent pain is associated with substance use after detoxification: a prospective cohort analysis. Addiction 102 (5), 752–760. 10.1111/j.1360-0443.2007.01759.x. [DOI] [PubMed] [Google Scholar]
- Lawton J, Simpson J, 2009. Predictors of alcohol use among people experiencing chronic pain. Psychol. Health Med 14 (4), 487–501. 10.1080/13548500902923177. [DOI] [PubMed] [Google Scholar]
- MacKillop J, O’Hagen S, Lisman SA, Murphy JG, Ray LA, Tidey JW, Monti PM, 2010. Behavioral economic analysis of cue-elicited craving for alcohol. Addiction 105 (9), 1599–1607. 10.1111/j.1360-0443.2010.03004.x. [DOI] [PMC free article] [PubMed] [Google Scholar]
- McDermott KA, Joyner KJ, Hakes JK, Okey SA, Cougle JR, 2018. Pain interference and alcohol, nicotine, and cannabis use disorder in a national sample of substance users. Drug Alcohol Depend. 186, 53–59. 10.1016/j.drugalcdep.2018.01.011. [DOI] [PubMed] [Google Scholar]
- Moskal D, Maisto SA, De Vita M, Ditre JW, 2018. Effects of experimental pain induction on alcohol urge, intention to consume alcohol, and alcohol demand. Exp. Clin. Psychopharmacol 26 (1), 65–76. 10.1037/pha0000170. [DOI] [PMC free article] [PubMed] [Google Scholar]
- Murphy JG, MacKillop J, 2006. Relative reinforcing efficacy of alcohol among college student drinkers. Exp. Clin. Psychopharmacol 14 (2), 219–227. 10.1037/1064-1297.14.2.219. [DOI] [PubMed] [Google Scholar]
- National Institute on Alcohol Abuse and Alcoholism, 2013. Using Alcohol to Relieve Your Pain: What Are the Risks? Bethesda, MD: U.S. Dept. Of Health and Human Services, Public Health Service, National Institutes of Health, National Institute on Alcohol Abuse and Alcoholism. [Google Scholar]
- Noble M, Treadwell JR, Tregear SJ, Coates VH, Wiffen PJ, Akafomo C, Schoelles KM, 2010. Long-term opioid management for chronic noncancer pain. Cochrane Database Syst. Rev (1), CD006605. 10.1002/14651858.CD006605.pub2. [DOI] [PMC free article] [PubMed] [Google Scholar]
- Nosaka K, Clarkson PM, 1995. Muscle damage following repeated bouts of high force eccentric exercise. Med. Sci. Sports Exerc 27 (9), 1263–1269. [PubMed] [Google Scholar]
- Petry NM, Bickel WK, 1998. Polydrug abuse in heroin addicts: a behavioral economic analysis. Addiction 93 (3), 321–335. [DOI] [PubMed] [Google Scholar]
- Price DD, McGrath PA, Rafii A, Buckingham B, 1983. The validation of visual analogue scales as ratio scale measures for chronic and experimental pain. Pain 17 (1), 45–56. [DOI] [PubMed] [Google Scholar]
- Riley JL 3rd, King C, 2009. Self-report of alcohol use for pain in a multi-ethnic community sample. J. Pain 10 (9), 944–952. 10.1016/j.jpain.2009.03.005. [DOI] [PMC free article] [PubMed] [Google Scholar]
- Robinson ME, Riley III, J.L., Myers CD, Papas RK, Wise EA, Waxenberg LB, Fillingim RB, 2001. Gender role expectations of pain: relationship to sex differences in pain. J. Pain 2 (5), 251–257. [DOI] [PubMed] [Google Scholar]
- Robinson ME, Brown JL, George SZ, Edwards PS, Atchison JW, Hirsh AT, Fillingim RB, 2005. Multidimensional success criteria and expectations for treatment of chronic pain: the patient perspective. Pain Med. 6 (5), 336–345. 10.1111/j.1526-4637.2005.00059.x. [DOI] [PubMed] [Google Scholar]
- Saunders JB, Aasland OG, Babor TF, de la Fuente JR, Grant M, 1993. Development of the alcohol use disorders identification test (AUDIT): WHO collaborative project on early detection of persons with harmful alcohol consumption–II. Addiction 88 (6), 791–804. [DOI] [PubMed] [Google Scholar]
- Schiller JS, Lucas JW, Peregoy JA, 2012. Summary Health Statistics for US Adults: National Health Interview Survey, 2011. [PubMed]
- Sevel L, Boissoneault J, Alappattu M, Bishop M, Robinson M, 2019. Training endogenous pain modulation: a preliminary investigation of neural adaptation following repeated exposure to clinically-relevant pain. Brain Imaging Behav. 1–16. [DOI] [PubMed] [Google Scholar]
- Sheu R, Lussier D, Rosenblum A, Fong C, Portenoy J, Joseph H, Portenoy RK, 2008. Prevalence and characteristics of chronic pain in patients admitted to an outpatient drug and alcohol treatment program. Pain Med. 9 (7), 911–917. 10.1111/j.1526-4637.2008.00420.x. [DOI] [PubMed] [Google Scholar]
- Spielberger CD, 1983. Manual for State-Trait Anxiety Inventory. Consulting Psychologists Press, Palo Alto, CA. [Google Scholar]
- Substance Abuse and Mental Health Services Administration, 2017. Key Substance Use and Mental Health Indicators in the United States: Results from the 2016 National Survey on Drug Use and Health (HHS Publication No. SMA 17–5044, NSDUH Series H-52). Rockville, MD: Center for Behavioral Health Statistics and Quality, Substance Abuse and Mental Health Services Administration. Retrieved from. https://www.samhsa.gov/data/. [Google Scholar]
- Thompson T, Oram C, Correll CU, Tsermentseli S, Stubbs B, 2017. Analgesic effects of alcohol: a systematic review and meta-analysis of controlled experimental studies in healthy participants. J. Pain 18 (5), 499–510. 10.1016/j.jpain.2016.11.009. [DOI] [PubMed] [Google Scholar]
- Volkow ND, Collins FS, 2017. The role of science in addressing the opioid crisis. N. Engl. J. Med 377 (4), 391–394. 10.1056/NEJMsr1706626. [DOI] [PubMed] [Google Scholar]
- Wilsnack RW, Vogeltanz ND, Wilsnack SC, Harris TR, 2000. Gender differences in alcohol consumption and adverse drinking consequnces: cross-cultural patterns. Addiction 95 (2), 251–265. [DOI] [PubMed] [Google Scholar]
- Witkiewitz K, McCallion E, Vowles KE, Kirouac M, Frohe T, Maisto SA, Heather N, 2015. Association between physical pain and alcohol treatment outcomes: The mediating role of negative affect. J. Consult. Clin. Psychol 83 (6), 1044. [DOI] [PMC free article] [PubMed] [Google Scholar]