

Abstract
Dissecting the relationship between gene function and substitution rates is key to understanding genome-wide patterns of molecular evolution. Biochemical pathways provide powerful systems for investigating this relationship because the functional role of each gene is often well characterized. Here, we investigate the evolution of the flavonoid pigment pathway in the colorful Petunieae clade of the tomato family (Solanaceae). This pathway is broadly conserved in plants, both in terms of its structural elements and its MYB, basic helix–loop–helix, and WD40 transcriptional regulators, and its function has been extensively studied, particularly in model species of petunia. We built a phylotranscriptomic data set for 69 species of Petunieae to infer patterns of molecular evolution across pathway genes and across lineages. We found that transcription factors exhibit faster rates of molecular evolution (dN/dS) than their targets, with the highly specialized MYB genes evolving fastest. Using the largest comparative data set to date, we recovered little support for the hypothesis that upstream enzymes evolve slower than those occupying more downstream positions, although expression levels do predict molecular evolutionary rates. Although shifts in floral pigmentation were only weakly related to changes affecting coding regions, we found a strong relationship with the presence/absence patterns of MYB transcripts. Intensely pigmented species express all three main MYB anthocyanin activators in petals, whereas pale or white species express few or none. Our findings reinforce the notion that pathway regulators have a dynamic history, involving higher rates of molecular evolution than structural components, along with frequent changes in expression during color transitions.
Keywords: anthocyanins, flower color, molecular evolution, MYB, phylogenomics, Petunieae, Solanaceae, transcription factors
Introduction
The structure and function of biochemical pathways are closely tied to patterns and rates of molecular evolution. For example, enzymes positioned at early steps in these pathways have substantial control over total pathway output (flux) and often experience stronger constraints with lower overall rates of evolution (e.g. Rausher et al. 1999; Livingstone and Anderson 2009; Cole and Ingvarsson 2018, but see Alvarez-Ponce et al. 2009). As they have high flux control, upstream genes are also theoretically expected to be the targets of adaptive substitutions (Wright and Rausher 2010), a pattern found in several empirical studies (Olson-Manning et al. 2013; Passow et al. 2019). Enzymes positioned at branch points exert similarly high control (Rausher 2013; Wheeler and Smith 2019), and thus experience similar evolutionary pressures. Studies across a range of metabolic pathways indicate that, like upstream genes, enzymes at branch points exhibit elevated purifying selection (Greenberg et al. 2008; Ramsay et al. 2009) and, in some cases, show signatures of positive selection (Flowers et al. 2007; Dall’Olio et al. 2012). These complex effects of the topology of biochemical pathways can manifest as system-level relationships between molecular evolution and network properties, such as centrality and connectivity (Hahn and Kern 2005; Vitkup et al. 2006; Masalia et al. 2017).
The molecular evolution of transcription factors in relation to the metabolic pathways they regulate has received less attention, but evidence to date points to markedly different dynamics. Given their position upstream of structural gene targets, transcription factors might be expected to evolve under strong constraints, and that is indeed the case for many well-studied “toolkit” genes (Carroll 2008). However, some core developmental genes are rapidly evolving (Whitfield et al. 1993; Purugganan and Wessler 1994), including some of the regulators that control transitions to the reproductive stage in plants (Lagercrantz and Axelsson 2000). This variation in molecular evolutionary rates across transcription factors may relate to different histories of gene duplication and different levels of functional specificity (Baum et al. 2005; Streisfeld et al. 2011; Ascencio et al. 2017), as well as differences in gene expression (Jovelin and Phillips 2011; Yang and Gaut 2011; Mukherjee et al. 2016). One challenge for understanding how the molecular evolution of transcription factors differs from the genes they regulate is the lack of studies investigating both sets of genes (Alvarez-Ponce et al. 2009). This pathway-level approach is essential for gaining insight into the potential targets of selection during macroevolutionary transitions (e.g., Foote et al. 2015; Ciezarek et al. 2019) and assessing the consequences for other pathway genes (e.g., relaxed constraint and gene decay following trait loss, Preston et al. 2011; Springer et al. 2021).
Here, we use the flavonoid pigmentation pathway in the genus Petunia and its wild relatives (tribe Petunieae) to investigate the relationship between macroevolutionary trait transitions and the molecular evolution of the underlying gene network. Flavonoids include the blue, purple, and red anthocyanin pigments that color many flowers and fruits, and a range of yellowish or colorless compounds (e.g., flavonols, flavones) that can act as copigments and create ultraviolet (UV) patterns on flowers (Winkel-Shirley 2001; Davies et al. 2012). Although our knowledge of this deeply conserved pathway builds from work in a broad range of model systems (e.g., maize, Arabidopsis, snapdragon), Petunia has served as the premier model for understanding the regulation of anthocyanin pigments and copigments that give rise to variation in flower color intensity, hue, and pattern (Quattrocchio et al. 2006; Albert et al. 2014; Sheehan et al. 2016; Esfeld et al. 2018; Berardi et al. 2021). Surprisingly, very little is known about the molecular basis for flower color variation in the wild relatives of petunias, which include many showy-flowered taxa of horticultural importance such as species of Calibrachoa (million bells), Nierembergia (the cupflowers), Brunfelsia (yesterday, today, and tomorrow), and Fabiana (the false heaths; fig. 1). This wide floral variation across the approximately 182 Petunieae species provides an opportunity to test whether the mechanisms controlling flower color in model species extend to a clade-wide scale.
Fig. 1.

Strong support across gene trees for the monophyly of Petunieae and its genera. Tree topology from the coalescent-based species tree analysis with branch lengths in substitutions per base pair (subs/bp) of concordant genes. As Astral does not provide branch lengths in subs/bp, we calculated these values using the method of Walker et al. (2021), which filters all gene trees for only branches that are concordant with the species trees to avoid being misled by conflicting signals. For every branch in the species tree, the mean of all the concordant branches in the gene trees is used to provide the branch length. All branches have 100% local posterior probability. The size of the triangles corresponds to the number of taxa sampled in the clade (supplementary fig. S1, Supplementary Material online). Pie charts at the nodes show the level of gene tree conflict where gray, black, and white denote concordant, conflicting, and uninformative (support less than 95% UFboot or insufficient taxon sampling), respectively. Images from top to bottom (with credits): Calibrachoa eglandulata, Fabiana punensis, Petunia reitzii, Nierembergia scoparia (all by Lucas C. Wheeler), Bouchetia erecta (Edith Bergquist), Hunzikeria texana (Karla M. Benítez), Plowmania nyctaginoides, Leptoglossis albiflora (both by Rocío Deanna), and Brunfelsia lactea (Lucas C. Wheeler).
One emerging theme from flower color genetics is the critical role of R2R3 MYB transcription factors. These highly variable proteins have duplicated extensively in flowering plants (Gates et al. 2016; Jiang and Rao 2020) and tend to be narrowly specific in terms of their spatial and temporal expression as well as their targets (Sobel and Streisfeld 2013). Many MYB genes, acting in complex with basic helix–loop–helix (bHLH) and WD40 partners, regulate epidermal cell differentiation, contributing for example to the distribution of root hairs (Bernhardt et al. 2005) and the conical shape of petal cells (Ramsay and Glover 2005). In the context of flower color, different copies of MYBs are specialized for activating anthocyanins and copigment production in different petal regions, thus regulating overall color intensity and the complex pigmentation patterns such as spots (Martins et al. 2017; Ding et al. 2020) and bullseyes (Sheehan et al. 2016). The primary activators of anthocyanin production in Petunia include four MYBs from subgroup 6 (AN2, AN4, DPL, and PHZ; Albert et al. 2011; Zhang et al. 2021). Another cluster of subgroup 6 MYBs, the ASR genes, was recently described in Petunia, and these seem to be important early in bud development (Zhang et al. 2019). The activity of MYB repressors, including MYB27 and MYBx (Albert et al. 2011), also shape floral anthocyanin production. MYBFL, which belongs to the subgroup 7 flavonoid regulators, controls the floral expression of flavonol copigments (Sheehan et al. 2016). Changes in the function and expression of these diverse MYB transcription factors underlie much of the flower color variation across model species of Petunia (Quattrocchio et al. 1999; Hoballah et al. 2007; Esfeld et al. 2018; Berardi et al. 2021). Thus, we hypothesized that MYBs are likely to contribute to the diversification of flower color across the entire Petunieae clade, a history that would be reflected in elevated rates of molecular evolution compared with the rest of the pathway.
To test these hypotheses, we built a large and densely sampled transcriptomic data set for Petunieae and examined the evolution of structural and regulatory genes of the flavonoid pathway across multiple flower color transitions. First, we estimated a new phylogeny for the tribe to provide a framework for identifying color transitions and testing for their molecular signatures. Next, we estimated rates of molecular evolution (in terms of the ratio of nonsynonymous and synonymous substitutions) for structural and regulatory genes to examine how these rates vary with position and functional role. Finally, we used the repeated color transitions across the phylogeny to test whether losses of floral pigmentation are associated with changes in the selective constraint acting on coding sequences and the presence/absence of transcripts of the structural and regulatory genes. Our results uncover widely varying dynamics across the pathway and its regulators, with some loci highly conserved and others rapidly evolving. The rapid evolution of MYB genes, along with the absence of the MYB activators in the white-flowered lineages, implicates this class of transcription factors as playing a central role in flower color evolution at the clade level.
Results
Transcriptomic Data Resolve Relationships across Petunieae
We assembled de novo transcriptomes from 69 Petunieae species and an outgroup (Browallia americana; supplementary table S1, Supplementary Material online), incorporating a median of 24,945,754 100-bp reads per assembly (see Materials and Methods, supplementary table S2, Supplementary Material online). Median contig lengths for the predicted CDS ranged from 447 to 837 bp, with a median of 714 bp. The transcriptomes contained a median of 24,840 transcripts per assembly (supplementary table S2, Supplementary Material online). These transcriptomic data set spanned all genera of Petunieae, with multiple species of all nonmonospecific genera, allowing us to make inferences about relationships and explore the diversity of phylogenetic signal across loci. Previous phylogenetic analyses of Petunia and allied genera showed moderate to strong support for the monophyly of the genera. Still, these studies were often limited in sampling and relied on a handful of markers (e.g., Särkinen et al. 2013; Ng and Smith 2016). Furthermore, relationships among the genera have been contentious (Reck-Kortmann et al. 2015) and some genera have been very difficult to resolve (Fregonezi et al. 2012). Our coalescent-based and concatenation analyses of 3672 protein-coding genes revealed congruent relationships along the tree’s backbone (fig. 1 andsupplementary figs. S1 and S2, Supplementary Material online). For example, Petunia, Calibrachoa, and Fabiana formed a well-supported clade with the latter two genera as sister groups (as in Reck-Kortmann et al. 2015 but contra Olmstead et al. 2008; Särkinen et al. 2013). We also recovered the small but florally diverse Bouchetia–Hunzikeria–Plowmania clade and its close relationship to Nierembergia and Leptoglossis as in Särkinen et al. (2013). The large-flowered shrubby genus Brunfelsia is sister to this group of small herbs, a relationship also found in previous work (e.g. Filipowicz et al. 2012). In addition to these backbone relationships, our analyses highlighted the discordance across gene trees that may explain past challenges in inferring relationships among genera. The most significant conflict involves the placement of Brunfelsia, where we estimated that 26% of the genes conflict in the species tree (fig. 1 andsupplementary fig. S3, Supplementary Material online).
We also observed wide variation in patterns of concordance within the genera. Some splits are highly concordant across gene trees (e.g., the split between Antillean and South American Brunfelsia [Filipowicz et al. 2012] and the two subgenera of Calibrachoa [Fregonezi et al. 2012]) whereas other shallow relationships showed little agreement across gene trees (supplementary fig. S3, Supplementary Material online). Discordance was particularly notable in Calibrachoa subg. Stimomphis, where previous studies have found little support for relationships among the 25 species (Fregonezi et al. 2012, 2013). A more recent study using 10 kb of plastid and nuclear sequence data recovered higher support in combined analyses (Mäder and Freitas 2019); however, few of those relationships match those we inferred (supplementary fig. S1, Supplementary Material online). These disagreements are not surprising as only approximately 10% of the genes follow the inferred species tree (supplementary fig. S3, Supplementary Material online). The extremely short branch lengths in coalescent units (supplementary fig. S1A, Supplementary Material online) are consistent with incomplete lineage sorting during a rapid radiation. However, hybridization among the highly interfertile species (Facciuto et al. 2009) could also have contributed to the discordance. Portions of the Petunia clade show high levels of gene tree conflict as seen in Calibrachoa (supplementary fig. S3, Supplementary Material online).
Rates of Molecular Evolution Vary Significantly across Pathway Genes
We mined the high-quality floral transcriptomes (65 of 69 species) for structural and regulatory genes with well-studied roles in floral flavonoid variation in Petunia. We created a bioinformatic pipeline (see Materials and Methods) to retrieve ten structural genes and the homologs of eight transcription factors (shown in fig. 2A). We recovered nearly all of the structural genes for all of the taxa and the majority of the pigment activators and repressors, including the bHLH genes AN1 and JAF13, the WD40 AN11, and five MYBs that regulate flavonoid production. We did not include MYBx (Albert et al. 2011) in these searches because its very short coding length (85 amino acids) makes homology detection difficult. Also, we detected the homologs of An4 and the ASR genes in at most eight species; therefore, we excluded them from statistical analyses. For CHI, our pipeline recovered both the A and B copies (supplementary fig. S4, Supplementary Material online). We focused on CHI-A to represent this step in the pathway as it is the predominant copy involved in flavonoid synthesis in petunia petals (van Tunen et al. 1988). However, the duplicates have similar rates of molecular evolution (results not shown). CHS also comprises a multigene family in Petunia, with CHS-A and CHS-J being closely related (Koes et al. 1989) and the former accounting for roughly 90% of the floral expression (Koes et al. 1989). Our pipeline retrieved a single copy across the taxa, which appears to correspond to CHS-A (supplementary fig. S5, Supplementary Material online).
Fig. 2.

Pathway genes vary seven-fold in evolutionary rate. (A) Simplified diagram of the flavonoid pathway with enzymes in the dark blue boxes. Colored circles denote regulators. The MYB genes DPL, AN2, and PHZ function as part of MBW complexes, with AN1 or JAF13 (not shown) as the bHLH partner and AN11 as the WD40 partner. The dashed lines indicate the type of product (mono-, di-, or tri-hydroxylated), which correspond to anthocyanins of different hues. The two rows of arrows at the last steps indicate downstream modification and decoration of the base molecules by enzymes such as UFGT and AAT. See supplementary figure S7D, Supplementary Material online for a more detailed pathway depiction and supplementary table S3, Supplementary Material online for gene names. (B) The global values estimated for each flavonoid pathway gene from the single ω model (structural genes in black and transcription factors in gray). Values above bars are the number of sites subject to positive selection, estimated by FUBAR (Murrell et al. 2013).
Using sequence alignments for these genes and their maximum likelihood trees, we estimated the ratio of nonsynonymous to synonymous substitution rates (dN/dS or “ω”) as an indicator of selective constraint. We found that ω varies nearly 7-fold across loci, with the lowest value (0.09) corresponding to the most upstream structural gene in the flavonoid pathway (CHS-A) and the highest value (0.62) corresponding to MYBFL, one of the MYB transcription factors (fig. 2B andsupplementary table S4, Supplementary Material online). This rate for CHS is on par with housekeeping genes, such as actin and GAPDH homologs (supplementary fig. S6A, Supplementary Material online), and is consistent with strong purifying selection (Yang 2007). The genes with higher ω do not present more sites under positive selection (fig. 2B and supplementary fig. S6A, Supplementary Material online) and we did not find a significant correlation between ω and the number of positively selected sites, suggesting that the elevated rates instead reflect relaxed selective constraint spread across the coding regions. Pairwise comparisons among these loci supported the significant variation in molecular evolutionary rate observed across this set of genes (supplementary fig. S6B, Supplementary Material online).
Functional Category Predicts Evolutionary Rate Better Than Position in the Network
In previous studies of the flavonoid pathway and other metabolic networks, the molecular rate of evolution and pathway position have been linked (Rausher et al. 1999, 2008); therefore, we first examined their relationship with our data set. We repeated the classic analysis of Rausher et al. (1999) and found a similar trend of increasing evolutionary rates moving along the linear portion of the pathway across the six “core” genes, that is, those that comprise the shortest pathway from precursors to pigments (CHS, CHI-A, F3H, DFR, ANS, and UFGT; supplementary fig. S7A, Supplementary Material online). However, this trend was not significant for ω or the nonsynonymous rates (dN) alone (, 0.76, P = 0.1, 0.08; Kendall’s T = 0.6, 0.6, P = 0.14, 0.14, supplementary fig. S7A and B, Supplementary Material online). We then repeated this analysis using the broader set of genes involved in the flavonoid biosynthesis. We scored position using a modified pathway pleiotropy index (Ramsay et al. 2009), where we averaged the position for genes involved in multiple reactions (see supplementary methods, Supplementary Material online). Again, we found no significant relationship with dN or ω (, 0.19, P = 0.53, 0.60; Kendall’s T = 0.18, 0.09, P = 0.47, 0.72, respectively; fig. 3A and supplementary fig. S7C, Supplementary Material online). This result appears to be partly driven by the highly conserved but downstream genes FLS and AAT (fig. 3A).
Fig. 3.
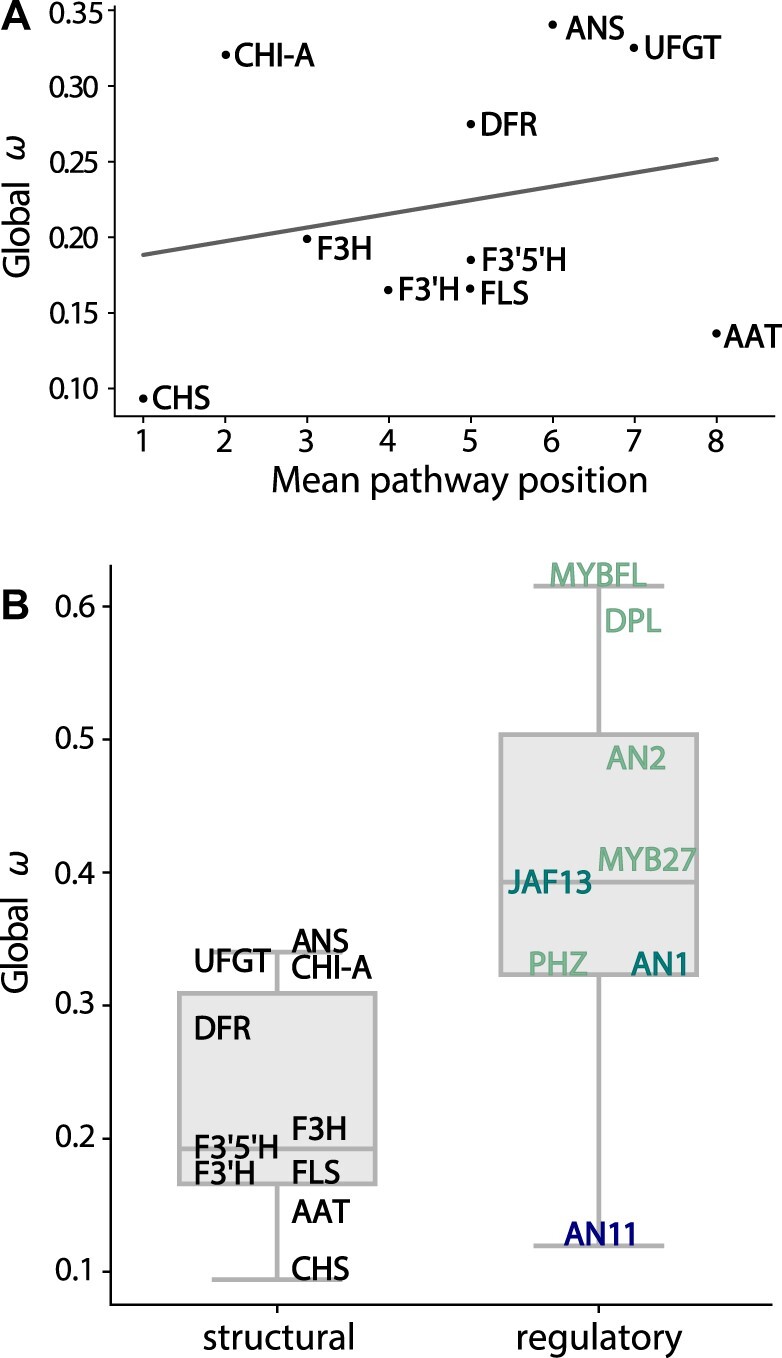
Molecular evolutionary rates vary by gene type but not across pathway positions. (A) Global ω estimated for structural genes ranked according to their mean position in the pathway, from most upstream (CHS) to most downstream (AAT). (B) Boxplot distributions for ω for regulatory and structural genes that code for transcription factors and enzymes, respectively. ω values of individual genes are marked by their abbreviations, which are color-coded by gene type, with WD40 in dark blue, bHLH in teal, and MYBs in light green. The height of each box shows the interquartile range, the horizontal line shows the median, and the bars show the range of values. See online version in color.
To test whether gene type was associated with substitution rate, we divided pathway genes into structural and regulatory categories and compared rates between these two groups. The median ω for transcription factors is roughly double that of the structural genes (0.4 vs. 0.2, Kruskal–Wallis H test: H = 5.76, P = 0.016, fig. 3C). The two classes of genes also differed in the range of variation in ω, with the structural genes having a compact distribution and the transcription factors spread from 0.12 for the WD40 repeat protein AN11 to 0.62 for MYB-FL (fig. 3B). Thus, structural genes from the flavonoid pathway tend to evolve more slowly and vary less in rates of evolution than transcription factors in Petunieae.
Finally, we examined how these molecular evolutionary rates might vary with gene expression levels, as these two factors are often closely related (Jovelin and Phillips 2011; Slotte et al. 2011; Yang and Gaut 2011; Mukherjee et al. 2016). By mapping reads back to each assembled CDS for each species, we calculated the total reads per gene and found that this value was significantly correlated with the global ω (, P = 0.02; fig. 4). The average number of reads for structural genes is 9.8-fold higher than for transcription factors (P = 0.002, supplementary fig. S8, Supplementary Material online), in line with their lower ω values. We repeated the analysis with additional genes (five housekeeping genes and four florally expressed transcription factors) to determine how widely this pattern held. We recovered a very similar pattern (, P = 0.02, supplementary fig. S9, Supplementary Material online). We also considered that sequencing error associated with variation in read counts might contribute to the observed relationship with ω. We compared our assemblies for pathway genes with those from published Petunia genomes. We found that the percent identity between the two was not related to read number (e.g., MYB27 and AAT were over 99% identical for Petuniaaxillaris sequences despite having thousands more reads for the latter; supplementary table S5, Supplementary Material online). The results show that lower read counts still gave accurate assemblies, and the observed relationship with ω is not due to sequencing error.
Fig. 4.

Gene expression level is related to molecular evolutionary rate. Labels indicate gene names with structural genes in black and transcription factors in gray. The number of reads for each gene was computed with Salmon (Patro et al. 2017) by mapping reads from each sample to a reference file containing the assembled transcripts for the gene and summing across all samples.
Rates of Molecular Evolution Are Decoupled from Flower Color Shifts
We next used phylogenetic comparative methods to identify shifts in the intensity of floral anthocyanin production and test the relationship of those shifts to rates of gene evolution. We hypothesized that pathway genes would experience relaxed selection in lineages that produce white flowers lacking anthocyanin pigments (Ho and Smith 2016). We also predicted that relaxed selection in white lineages would be most pronounced in the MYB transcription factors (e.g., AN2, DPL) since their roles are specific to anthocyanin production in flowers (Quattrocchio et al. 1999; Schwinn et al. 2006). Our floral biochemical profiling (see Materials and Methods) revealed wide variation in levels of anthocyanin production across the clade, providing evolutionary replication to test these hypotheses. Petunia and Calibrachoa showed the most intense pigmentation, whereas Brunfelsia, Leptoglossis, and Nierembergia experienced convergent losses (fig. 5A, Supplementary Material online). Despite the many color shifts, there is a significant phylogenetic signal in floral anthocyanin concentration (Blomberg’s K = 0.57, P = 0.001; Blomberg et al. 2003).
Fig. 5.

Convergent losses of color are associated with fewer pathway genes expressed. (A) Maximum likelihood ancestral state reconstruction of the anthocyanin pigment concentration for the 58 species with HPLC data. Black X indicates a complete loss of floral pigmentation. The heatmap shows flavonoid pathway genes detected (dark square) or not (light square) for each species based upon associated reads from the floral transcriptome. Genes are in the order MYBs, bHLH, WD40 transcription factors, then structural genes from early to late. (B) A plot of anthocyanin content against the number of pathway-related genes present for each species. (C) The number of species where we were able to detect each gene in the transcriptome. Structural genes are black, and transcription factors are gray.
We first carried out phylogenetic generalized least squares (PGLS) analysis to test for associations between variation in molecular evolutionary rates and flower color intensity. Using anthocyanin content measured with high-performance liquid chromatography (HPLC; supplementary table S6, Supplementary Material online) and tip values for rate ω (supplementary table S7, Supplementary Material online), we conducted PGLS analyses for each gene. The PGLS analyses showed two marginally significant relationships, nonsignificant after Bonferroni correction (supplementary table S8, Supplementary Material online). Repeating this analysis with dN, rather than ω, also revealed no significant gene-wise relationships (supplementary table S9, Supplementary Material online). Since relaxed selection may not be concentrated in particular loci but spread across the pathway, we repeated the analysis using the sum of dN across all genes for each tip; this comparison also returned no significant relationship (supplementary fig. S10, Supplementary Material online). As a whole, the PGLS results indicate that shifts in the intensity of pigmentation are decoupled from rates of molecular evolution associated with flavonoid pathway genes.
Mapping anthocyanin content onto the Petunieae phylogeny indicated multiple complete losses of floral anthocyanins. Thus, we also scored pigmentation as present/absent and estimated branch models. We implemented branch models in RELAX (Wertheim et al. 2015), allowing ω to vary between background lineages producing pigments and foreground lineages without pigments while incorporating uncertainty in ancestral trait reconstruction. We estimated relaxed selective constraint for 4 of the 18 pathway genes examined: 3 regulatory genes coding for the transcription factors AN1, JAF13, AN11, and 1 structural gene, AAT, encoding a downstream enzyme in the flavonoid pathway (supplementary table S10, Supplementary Material online). This result is significant for AN1, the bHLH component of MYB-bHLH-WD40 (MBW) complexes that activate anthocyanin production, where the estimated ω for lineages lacking anthocyanins is twice that of those with anthocyanins (supplementary table S10, Supplementary Material online). Combined with the PGLS analyses, these results suggest that while reductions in pigmentation and evolutionary rates across the pathway are not tightly coupled, complete losses tend to coincide with relaxed selection for some loci.
Loss of Floral Pigmentation Accompanied by Lack of MYB Expression
In addition to variation in rates of molecular evolution across pathway loci, our transcriptomic data set revealed variation across species in the presence and absence of transcripts associated with the flavonoid pathway genes (supplementary fig. S4, Supplementary Material online). We hypothesized that this variation in transcriptome content might be related to floral pigmentation, particularly as regulatory changes often underlie macroevolutionary color transitions (Larter et al. 2019). Treating anthocyanin concentration as a continuous trait, we again used PGLS to test for an association between pigmentation and variation in gene expression. We found a strong relationship (, P = 0.003), with transcript detection positively correlated with anthocyanin concentration (fig. 5B). We suspected that this correlation is primarily driven by the MYB transcription factors, which are the most frequently absent among the set of pathway genes (fig. 5C), and indeed, removing these genes from the analysis eliminates the significant correlation (supplementary fig. S11, Supplementary Material online). Thus, the more pigmented species express a larger number of pathway genes, and specifically, more MYB genes, in their corolla.
In contrast to the pigmented species, white-flowered species tend to be missing MYB genes while retaining the expression of structural genes. The presence of the structural targets in the absence of their activators may seem surprising, especially for the downstream genes (e.g., DFR, ANS) that are only involved in anthocyanin production (fig. 2A). Still, most of the white-flowered species express at least one activator, which may be sufficient for a low level of pathway expression. There are three white-flowered species in which no activators were detected, and in these cases, it is possible that the activators were expressed in earlier stages of development (fig. 5A). For example, the ASR genes, which were only recovered from a few pigmented species (supplementary figs. S12 and S13, Supplementary Material online), tend to be active only early in bud development in Petunia (Zhang et al. 2019).
The variation in the presence and absence of MYB transcripts across Petunieae species could be due to differences in genomic content (gene gain or loss) or gene expression in corolla tissues. To explore this possibility, we designed specific primers for AN2 and DPL, the two MYBs that were most often missing, and surveyed several taxa for the presence of these genes in the genome (see supplementary methods, Supplementary Material online). The primers for DPL successfully amplified that specific MYB and allowed us to sequence partial copies from species of Brunfelsia and Nierembergia that lacked DPL in their transcriptomes (see supplementary results, Supplementary Material online). For AN2, the primers designed to be copy-specific tended to amplify multiple copies, although at least one amplicon corresponded to AN2. Overall, these results suggest that DPL, and likely AN2, are present more widely in Petunieae and that their absence in the transcriptomes is due to regulatory changes.
Discussion
Gene Function and Expression Drive Rates of Molecular Evolution
The topology of metabolic pathways has often been linked to rates of molecular evolution (Vitkup et al. 2006; Alvarez-Ponce et al. 2009; Montanucci et al. 2018). Early studies on the molecular evolution of the flavonoid pathway found a trend of greater constraint in the enzymes positioned at the first steps in the pathway (Rausher et al. 1999), which have high control over pathway output. Subsequent studies have recovered mixed results, with a few supporting the pattern (Lu and Rausher 2003) and others showing no association between position and rate of molecular evolution (Ramos-Onsins et al. 2008; Ho and Smith 2016; Shoeva et al. 2017). With our 65 species data set, we observed a slight trend across the six core pathway genes (supplementary fig. S3A, Supplementary Material online), but a more complete sampling of the pathway did not support this relationship (fig. 3A). The most downstream gene sampled, the anthocyanin modifier AAT, has a similar ω and an even lower dN than the first committed enzyme in the anthocyanin pathway, CHS (fig. 3C). Overall, it appears that rates of molecular evolution are only weakly related to pathway position, implicating other factors in generating the 3-fold variation in ω across the structural genes (fig. 2B). One complication in dissecting this relationship is that flux control, thought to be the underlying driver of the position effect (Rausher et al. 1999), likely evolves with the color phenotype, shifting such that the enzyme’s control over the selected products is maximized (e.g., purple pigments; Wheeler and Smith 2019; Wheeler et al. 2021). Future studies could assess the role of flux more directly by focusing on phenotypic transitions and testing whether shifting flux control alters selective regimes acting on pathway enzymes.
Although relative position within the series of biochemical steps was not correlated with the rate of molecular evolution, we found that a gene’s function, as a regulator or enzyme, was predictive of selective constraint. Consistent with several studies in other pathways (e.g., Wu et al. 2010, but see Invergo et al. 2013; Jovelin and Phillips 2011), we found that transcription factors regulating the flavonoid pathway evolve 1.8 times faster on average than the structural genes they regulate (fig. 3C). The lack of positively selected sites in these genes suggests this difference is primarily due to relaxed selection (fig. 2B). The elevated evolutionary rates in transcription factors may be surprising as any coding mutations could affect the expression of multiple downstream targets (Doebley and Lukens 1998; Carroll 2008). However, this predicted pleiotropy can be reduced by redundancy and specialization (Duret and Mouchiroud 2000; Badawi et al. 2014), both of which are at play among the regulators of anthocyanin biosynthesis. Functional studies in Petunia suggest that the two bHLH proteins AN1 and JAF13 overlap in function, with floral pigment production being initiated by JAF13 and then reinforced with AN1 to give full coloration (Spelt et al. 2000; Albert et al. 2014). Functional roles are even more finely divided among the MYB genes regulating the flavonoid pathway, most of which are specific to particular regions of the flower (Schwinn et al. 2006) and/or branches of the pathway (Sheehan et al. 2016; Berardi et al. 2021). For example, in most Petunia, DPL or AN4 control vein coloration (Albert et al. 2011; Zhang et al. 2021), AN2 activates color production in the petal limb (Quattrocchio et al. 1993), and MYB-FL controls the flavonol copigments that give floral UV patterns (Sheehan et al. 2016). As might be predicted from these functional differences across TFs, the single-copy AN11 has a slower rate of molecular evolution; the bHLH genes are intermediate; and the diverse MYBs exhibit the fastest molecular rates (fig. 2B, see also Streisfeld et al. 2011). In contrast to the functional specificity observed for most TFs, the pathway enzymes are widely expressed in above-ground tissues, where flavonoids, including anthocyanins, are involved in many physiological functions, such as protection from UV light and mitigation of drought stress (Gould 2004).
Transcription factors may evolve faster than their enzymatic targets, not only because of their specificity but also their lower level of expression. Our results showed transcription factors have a 9.8-fold lower level of expression on average than structural genes, and rates of molecular evolution negatively correlate with this variation (Pál et al. 2001; Subramanian and Kumar 2004; Drummond et al. 2006; Yang and Gaut 2011). The transcription factors, particularly the rapidly evolving MYB genes, had some of the lowest expression levels (fig. 4). The low level of expression of transcription factors relative to their targets has been widely observed (e.g. Ghaemmaghami et al. 2003; Czechowski et al. 2004; Vaquerizas et al. 2009) and may limit binding to the highest affinity targets (Liu and Clarke 2002). The relationship between expression levels and rates of sequence evolution may be driven by selection against misfolded proteins, which not only represent wasted energy but can act as toxins in the cell (Drummond and Wilke 2008). Some degree of misfolding of lowly expressed proteins may not invoke high fitness costs as long as the same mutations that affect misfolding propensity do not substantially affect function. By contrast, highly expressed genes found in many tissues, like housekeepers and the flavonoid pathway enzymes, are expected to be under strong selection for robust folding, consistent with our findings. Collectively, our results show that the role of the gene in the pathway (structural or regulatory) and the level of expression associated with that function are the primary drivers of rates of molecular evolution.
Changes in MYB Expression May Underlie Flower Color Evolution
Macroevolutionary transitions in phenotype are often associated with suites of changes in the pathways that underlie the development of those phenotypes. Although some of these changes are required to produce the new phenotype, others may accumulate after the transition, for example, changes that stabilize the new state (Rodríguez-Trelles et al. 2003; Poon and Chao 2005; Deng et al. 2010) or changes that reflect relaxed selection on genes no longer expressed (dePamphilis and Palmer 1990; Meredith et al. 2013; Boakye et al. 2017). Our study revealed repeated cases in which lineages have transitioned to pale flowers and, in some cases, lost floral pigmentation entirely (fig. 5). We hypothesized that pigment pathway genes, particularly the floral-specific regulators, would show relaxed selective constraint in these lineages. We found no clear evidence that decreases in the color intensity relaxed the strength of selection (supplementary tables S8 and S9, Supplementary Material online). However, complete losses of floral pigmentation, which occurred independently in five lineages (fig. 5, supplementary table S10, Supplementary Material online), did lead to relaxed constraint for the downstream gene AAT and three transcription factors, the WD40 AN11, and the bHLH genes JAF13 and AN1, with the strongest effect in the latter (supplementary table S7, Supplementary Material online). These losses occurred within the last 10 Ma (fig. 5A, supplementary fig. S7, Supplementary Material online), a timespan over which genes with lost functions would be expected to decay (Marshall et al. 1994; Lynch and Conery 2000; Protas et al. 2007). Even though the increase was marked (e.g., from ω of 0.31 in the background to 0.62 in loss lineages for AN1), all values remain well below 1, indicating purifying selection. They may, for example, contribute to flavonoid production in other tissues and/or in different conditions (e.g., drought stress). Some of the Petunieae species possess intraspecific flower color variation, which could provide an additional avenue for examining the contribution of coding sequence changes to color evolution (e.g., Zufall and Rausher 2004; Coburn et al. 2015).
Although the R2R3 MYB AN2 and its close relatives DPL and PHZ did not emerge from these cross-species analyses of sequence evolution, they appear linked to color transitions through the presence and absence of their associated transcripts. The five pigment-less lineages are missing DPL and AN2 transcripts in their corollas, as are many other pale or white-flowered species (fig. 5A). Another MYB activator, PHZ, which gives blushes to flowers and colors the vegetative tissue of petunias (Albert et al. 2011), is recovered from most of the species, suggesting it is likely responsible for the pale floral coloration of taxa like the cupflowers (fig. 1E). By contrast, the intensely pigmented and patterned species, like most Petunia and Calibrachoa (fig. 1), express all three MYB activators (fig. 5A). Although this variation in transcriptome content could reflect underlying differences in genome content, our small PCR survey (see supplementary text, Supplementary Material online) supports the regulatory hypothesis, given that DPL and AN2 appear widely spread across Petunieae genomes. These findings align well with lessons from the model petunias that the diversification of R2R3 MYB genes and their regulation has been integral to flower color evolution (Esfeld et al. 2018; Berardi et al. 2021).
Conclusions
Patterns of molecular evolution across these biochemical pathways can provide insight into the selective forces that have historically acted on each gene and how these genes evolve in concert with phenotypic transitions. With extensive clade-level analysis of the anthocyanin pathway, our study confirms that most pathway elements are highly conserved, despite a multitude of shifts in color intensity and pattern. Evolutionary change in protein sequence is concentrated in the transcription factors of the pathway and especially the MYB genes. With their high tissue specificity and low levels of expression, coding mutations in MYBs are more often fixed than in other pathway genes. Moreover, the presence of transcripts associated with these genes is highly variable across species, with lineages containing the most substantial dose of MYB activators producing the most intense colors.
This study suggests that genomic scans of molecular evolutionary rates will be limited in their ability to identify genes and genetic changes that underlie adaptation. Although such approaches are commonly used to narrow down candidate loci (e.g. Prudent et al. 2016; Muntané et al. 2018), they will miss regulatory variation that may be more important in driving phenotypic evolution. As seen here, the coding regions of the fast-evolving MYB genes show no evidence of altered selection in association with flower color shifts, although their expression patterns point to a strong relationship. This result highlights the importance of developing phylogenetic genotype-to-phenotype (PhyloG2P) approaches tailored for detecting the signals of different mechanisms that can alter phenotype, from variation in coding sequences (e.g. Halabi et al. 2021) to shifts in gene content (Kiefer et al. 2019), to regulatory changes (Larter et al. 2018; Hu et al. 2019). Integrating these approaches can lead to a deeper understanding of how pathway structure and function shape phenotypic space and the potential for moving through it.
Materials and Methods
Transcriptome Assembly and Identification of Pathway Genes
We sequenced and assembled floral transcriptomes for 67 species, leaf transcriptomes for an additional two species of Petunieae for which flowering material was not available, and a floral transcriptome for the outgroup species B.americana (supplementary table S1 and methods, Supplementary Material online). Tissue sampling and RNA extraction followed Larter et al. (2018), as described here (supplementary text, Supplementary Material online). Transcriptomes were assembled from 100-bp paired-end reads following Morales-Briones et al. (2021), with the steps unified as a single Snakemake pipeline (https://osf.io/b7gcp/). Briefly, raw reads were first corrected using Rcorrector (Song and Florea 2015), and Trimmomatic (Bolger et al. 2014) was used to remove adapters. Trimmed reads were assembled with Trinity (Grabherr et al. 2011), incorporating strand-specific information. The raw Trinity assemblies were filtered for chimeric sequences using the “run_chimera_detection.py” script (https://bitbucket.org/yanglab/phylogenomic_dataset_construction/) from Morales-Briones et al. (2021) with a custom BLAST database constructed from Petunia, Solanum, and Arabidopsis transcriptomes. We then used Corset (Davidson and Oshlack 2014) to collapse and cluster transcripts and finally TransDecoder (TransDecoder/TransDecoder 2021) to predict CDS and filter predicted sequences against the same custom BLAST database, discarding CDS with no BLAST hits.
We retrieved anthocyanin pathway genes, along with a selection of housekeeping genes and other known florally expressed transcription factors for comparison, by first collecting published sequences and using them to query BLAST databases created with makeblastdb (Madden 2013) from each raw Trinity transcriptome assembly using BLASTN. Our search set included the structural genes encoding CHS-A, CHI-A, F3H, FLS, F3’H, F3’5’H, DFR, ANS, UFGT, AAT; the transcription factors AN2, DPL, PHZ, AN11, AN1, JAF13, MYBFL, MYB27, AN4, ASR1, ASR2, ASR3, PH1, PH2, ODO1; and the housekeeping genes actin, tubulin, Rps18, Gapdh, Hprt (see supplementary table S3, Supplementary Material online for full gene names). We retained matching hits (e-value cutoff = 1e−50) and then used TransDecoder to predict CDS and peptide sequences from these sets. Among these sets, we aligned each hit to a representative published sequence using BioPython and kept the single most similar sequence (highest alignment score). Filtered sequences were queried against the Petunia inflata draft genome CDS using BLASTN (Bombarely et al. 2016) to validate this approach. Given the close relationships among the MYB activators (AN2, AN4, DPL, PHZ, ASR1, ASR2, ASR3), we took an additional step to confirm the accuracy of our double BLAST approach, building a gene tree for the entire set to determine how the recovered sequences are related to the characterized genes from Petunia (see supplementary results, Supplementary Material online). After this step, we excluded AN4 and the ASR genes, because we recovered from eight or fewer taxa each, probably due to their low expression at the sampled bud stage (Zhang et al. 2019). For the remaining 26 loci, we inferred final alignments of the peptide sequences with MAFFT (Katoh and Standley 2013) and used these to generate codon alignments of the corresponding nucleotide CDS with pal2nal.pl (Suyama et al. 2006). We inspected all alignments for spurious sequences, and in this process, removed one truncated and unalignable CHI-A sequence from Hunzikeria texana. Finally, we estimated maximum likelihood gene trees from the codon alignments with a GTR + Γ model in RaxML (Stamatakis 2014) for downstream analyses. All scripts for these bioinformatic steps, along with the assembled transcriptomes, are deposited online (https://osf.io/b7gcp/).
Estimation of Evolutionary Rates across Genes and Branches
We discarded five transcriptomes from our analyses of molecular evolution. Brunfelsia pauciflora (BRPA), Brunfelsia plicata (FBRP), and Fabiana viscosa (FAVI) were dropped because they are derived from leaf rather than floral tissue. Calibrachoa parviflora (CPAR) and Calibrachoa excellens (CEXC) were also discarded due to the lower quality of the sequencing data (see supplementary methods, Supplementary Material online). We used the codon alignments and corresponding gene trees for the remaining 65 species to analyze patterns of molecular evolution. We used HyPhy (Kosakovsky Pond et al. 2020) to fit a single ω and a free-rates model for each gene. Briefly, the single ω model fits a single shared value for the dN/dS ratio for the entire gene tree inferred from the codon alignment. In contrast, the free-rates model fits a separate ω value for each branch. To test whether the global ω values were driven by a subset of sites under positive selection, we fit the FUBAR model (Murrell et al. 2013) in HyPhy. We confirmed that the genes exhibit significant variation in ω using the BUSTED model in HyPhy to conduct pairwise comparisons across a subset of genes spanning the range of observed global ω values (supplementary text, Supplementary Material online). We also compared synonymous and nonsynonymous rates across genes by summing estimated branch lengths for each (dN and dS) from HyPhy. We used the nonparametric Kruskal–Wallis H test (Kruskal and Wallis 1952) and Kendall’s τ (Kendall 1938) to compare rates across gene types and pathway positions. For testing the association between molecular evolution and losses of floral anthocyanins, we used the RELAX approach (Wertheim et al. 2015), also implemented in HyPhy. For this analysis, we used the species tree (see below) and assigned species lacking floral anthocyanins to the foreground using the phylotree.js tool (http://phylotree.hyphy.org/). We used maximum parsimony to label internal foreground branches and then fit the RELAX model to each codon alignment to test for different dN/dS rate classes between foreground (unpigmented) and background (pigmented) branches. Raw data and scripts to run these analyses are deposited (https://osf.io/b7gcp/).
Quantification of Anthocyanin Content
We quantified the production of anthocyanins for each sampled Petunieae species with HPLC. We sampled flowers from three individuals per species and used these to calculate the mean anthocyanin mass fraction (mg compound per g tissue) over replicates. For each individual, we collected fresh floral corolla tissue, dried the tissue with silica gel, and stored the material in 2-ml tubes at −80 °C as in Berardi et al. (2016). For extraction of total flavonoids, 0.0005 to 0.1 g of dried tissue was soaked in 1 ml 2 N HCL overnight. Samples were then centrifuged (3 min at 12,000 RPM) to pellet tissue debris and the 1 ml solvent was decanted into a new 2-ml tube. Samples were heated at 100–104 °C for 1 h to convert the glycosylated flavonoids into their corresponding aglycones. Four hundred microliters of ethyl acetate was then added to each tube and vortexed thoroughly to mix the solution. Samples were centrifuged at 12,000 RPM for 1 min. The ethyl acetate layer (containing flavones and flavonols) was carefully removed using a micropipette. This ethyl acetate wash was repeated a second time. Tubes containing the remaining HCl layer were then placed open-topped in an N-EVAP nitrogen evaporator connected to an airline in a fume hood to evaporate residual ethyl acetate. One hundred and fifty microliters of iso-amyl alcohol was then added to the tubes, and the solution was vortexed thoroughly to mix. Samples were again centrifuged at 12,000 RPM for 1 min. The iso-amyl alcohol layer (containing anthocyanidins) was carefully removed and pipetted into new 1.5-ml tubes and this iso-amyl alcohol extraction step was repeated a second time. The combined iso-amyl alcohol layers were then dried using an N-EVAP. Each extract was eluted in 50 µl of 1% HCl in MeOH before analyses. Before injecting onto the HPLC system, we assessed the overall concentration by examining a series of dilutions (1:75, 1:50, 1:10) on an Eppendorf BioSpectrometer and ensuring that peaks between 200 and 680 nm were under an absorbance of 3.0 (within linear range of the spec) to avoid overloading the column. After this QC step, 10 µl at the desired dilution (none or 1:10) were injected into an Agilent 1260 HPLC system. Anthocyanidins were separated by gradient elution at 30 °C using solvents A (HPLC-grade water, 0.1% trifluoroacetic acid) and C (1-propanol, 0.1% trifluoroacetic acid) with the following program: 15% C from 0 to 4 min; linear increase to 20% C from 4 to 10 min; 20% C from 10 to 14 min; linear increase to 22.5% C from 14 to 16 min; instantaneous increase to 27.5% C; 27.5% C from 16 to 18 min; instantaneous decrease to 15% C; 15% C from 18 to 21 min. Peaks were detected at 520 and 540 nm. A blank sample was run after every three samples and between species to wash the injection needle and avoid contamination. The mobile phase was 0.5% TFA in HPLC grade water and 1% HCL in MeOH and used a 100-4.6 mm Chromalith Performance column. All results were analyzed using Agilent Chemstation software and peaks were compared with standards obtained from Extrasynthese (360 nm for flavonoids and 520 nm for anthocyanidins). In total, we completed HPLC analyses for 58 Petunieae species.
Species Tree Estimation and PGLS Analyses
We used the phylotranscriptomic pipeline developed by Yang and Smith (2014) to estimate species relationships. This pipeline uses a combination of BLAST searches and tree-building steps to identify homologous gene clusters and estimate ML gene trees for input into species tree estimation programs (described in the supplementary text, Supplementary Material online). To obtain an ultrametric tree (with branches proportional to time) for statistical comparative analyses, we estimated branch lengths from a sample of genes present in all species and used penalized likelihood as implemented in TreePL (Smith and O’Meara 2012) to carry out rate smoothing (described in the supplementary text, Supplementary Material online). We used this ultrametric tree to estimate ancestral states for anthocyanin content with the fastAnc function of the phytools package (Revell 2012) and test for associations between these shifts and multiple aspects of molecular evolution. First, we used a PGLS to test for associations between tip estimates of ω for each gene from the free-rates model and anthocyanin amount with the gls function in the NLME package (Pinheiro et al. 2021). We set the Ornstein–Uhlenbeck parameter α to be freely estimated, allowing the degree of phylogenetic structure to vary across analyses. Second, we used PGLS to examine the relationship between gene presence/absence and anthocyanin content for each gene (with nonzero missing species). Finally, we repeated the PGLS analysis scoring anthocyanins as present or absent, which is equivalent to a phylogenetic ANOVA (Rohlf 2001).
Supplementary Material
Supplementary data are available at Molecular Biology and Evolution online.
Supplementary Material
Acknowledgments
We thank members of the Smith lab for discussions on the project and two anonymous reviewers for helpful comments. We thank Aléxia Gope, Drielli Canal, Sebastián Guzman Rodríguez, Louana Susa, and Ana Lúcia Cunha Dornelles of UFGRS in Porto Alegre for their assistance getting around the lab. We thank iNaturalist users Karla M. Benítez and Lindheimer, Texas Master Naturalist Edith Bergquist for contributing their photos for figure 1. We thank multiple agencies for providing permits for collecting floral tissue and vouchers, including the Ministerio de Ambiente de Jujuy (Res. 001/2017), the Secretaría del Ambiente y Desarrollo Sustentable de Catamarca (Res. 375), and the Ministerio de Ambiente y Producción Sustentable de Salta (Res. 00001/2017). Collections in Brazil were conducted under permit MP 2.186/16 of the Federal Government to access plant genetic information for evolutionary or taxonomic studies (authorization for activities with scientific purposes SISBIO 41530-7). We thank many who helped us acquire plant material in botanic gardens and plant research institutes: Joseph Cahill of the Ventura Botanical Gardens, Julián Greppi of INTA Castellar in Buenos Aires, Chad Husby of Fairchild Tropical Botanic Garden, Bruce Holst, Shawn McCourt, and Sally Chambers of Marie Selby Botanical Gardens, and Mike Bone of Denver Botanic Gardens. We are also grateful to Segundo Leiva, Victor Quipuscoa, and Carmen Fernandez for assistance with field collections. We thank Sergei Pond for his advice and rapid responses regarding the use of HyPhy. This work utilized the RMACC Summit supercomputer, which is supported by the National Science Foundation (awards ACI-1532235 and ACI-1532236), the University of Colorado Boulder, and Colorado State University. The Summit supercomputer is a joint effort of the University of Colorado Boulder and Colorado State University. This work was funded by NSF-DEB 1553114 to S.D.S. and the Gatsby Charitable Foundation to E.M. The funders had no role in study design, data collection, analysis, decision to publish, or manuscript preparation.
Author Contributions
S.D.S., J.N., L.B.d.F, G.E.B., and L.C.W. conceived the study and outlined the experimental design. L.C.W., J.F.W., E.M., and S.D.S. developed the analyses. L.C.W., S.D.S., J.N., R.D., A.D.W., A.B., P.H.P., and M.V.P. conducted fieldwork to collect plant samples. A.D.W. performed HPLC. J.F.W. reconstructed the species phylogeny. L.C.W. built the sequencing libraries and assembled the de novo transcriptomes. A.M., J.F.W., and L.C.W. implemented the assembly pipeline. H.M.R. and J.F.W. wrote the software pipeline to conduct the conflict analysis. L.C.W. and S.D.S. conducted the statistical analyses of the data and drafted the manuscript with revisions from J.F.W. and E.M. and additional edits from G.E.B., J.N., and M.V.P.
Data Availability
The supplemental scripts and processed data files (including transcriptome assemblies) needed to conduct the analyses referenced throughout the manuscript can be found in the supplementary OSF repo (https://osf.io/b7gcp/). The raw RNA-seq data files have been uploaded to the SRA (BioProject PRJNA746328, supplementary table S1, Supplementary Material online).
References
- Albert NW, Davies KM, Lewis DH, Zhang H, Montefiori M, Brendolise C, Boase MR, Ngo H, Jameson PE, Schwinn KE.. 2014. A conserved network of transcriptional activators and repressors regulates anthocyanin pigmentation in eudicots. Plant Cell. 26(3):962–980. [DOI] [PMC free article] [PubMed] [Google Scholar]
- Albert NW, Lewis DH, Zhang H, Schwinn KE, Jameson PE, Davies KM.. 2011. Members of an R2R3-MYB transcription factor family in Petunia are developmentally and environmentally regulated to control complex floral and vegetative pigmentation patterning. Plant J. 65(5):771–784. [DOI] [PubMed] [Google Scholar]
- Alvarez-Ponce D, Aguadé M, Rozas J.. 2009. Network-level molecular evolutionary analysis of the insulin/TOR signal transduction pathway across 12 Drosophila genomes. Genome Res. 19(2):234–242. [DOI] [PMC free article] [PubMed] [Google Scholar]
- Ascencio D, Ochoa S, Delaye L, DeLuna A.. 2017. Increased rates of protein evolution and asymmetric deceleration after the whole-genome duplication in yeasts. BMC Evol Biol. 17(1):40. [DOI] [PMC free article] [PubMed] [Google Scholar]
- Badawi M, Giraud I, Vavre F, Grève P, Cordaux R.. 2014. Signs of neutralization in a redundant gene involved in homologous recombination in Wolbachia endosymbionts. Genome Biol Evol. 6(10):2654–2664. [DOI] [PMC free article] [PubMed] [Google Scholar]
- Baum DA, Yoon H-S, Oldham RL.. 2005. Molecular evolution of the transcription factor LEAFY in Brassicaceae. Mol Phylogenet Evol. 37(1):1–14. [DOI] [PubMed] [Google Scholar]
- Berardi AE, Esfeld K, Jäggi L, Mandel T, Cannarozzi GM, Kuhlemeier C.. 2021. Complex evolution of novel red floral color in Petunia. Plant Cell. 33(7):2273–2295. [DOI] [PMC free article] [PubMed] [Google Scholar]
- Berardi AE, Hildreth SB, Helm RF, Winkel BSJ, Smith SD.. 2016. Evolutionary correlations in flavonoid production across flowers and leaves in the Iochrominae (Solanaceae). Phytochemistry 130:119–127. [DOI] [PubMed] [Google Scholar]
- Bernhardt C, Zhao M, Gonzalez A, Lloyd A, Schiefelbein J.. 2005. The bHLH genes GL3 and EGL3 participate in an intercellular regulatory circuit that controls cell patterning in the Arabidopsis root epidermis. Development 132(2):291–298. [DOI] [PubMed] [Google Scholar]
- Blomberg SP, Garland T, Ives AR.. 2003. Comparative data: behavioral traits are more labile. Evolution 57(4):717–745. [DOI] [PubMed] [Google Scholar]
- Boakye DW, Jaroenlak P, Prachumwat A, Williams TA, Bateman KS, Itsathitphaisarn O, Sritunyalucksana K, Paszkiewicz KH, Moore KA, Stentiford GD, et al. 2017. Decay of the glycolytic pathway and adaptation to intranuclear parasitism within Enterocytozoonidae microsporidia. Environ Microbiol. 19(5):2077–2089. [DOI] [PubMed] [Google Scholar]
- Bolger AM, Lohse M, Usadel B.. 2014. Trimmomatic: a flexible trimmer for Illumina sequence data. Bioinformatics 30(15):2114–2120. [DOI] [PMC free article] [PubMed] [Google Scholar]
- Bombarely A, Moser M, Amrad A, Bao M, Bapaume L, Barry CS, Bliek M, Boersma MR, Borghi L, Bruggmann R, et al. 2016. Insight into the evolution of the Solanaceae from the parental genomes of Petunia hybrida. Nat Plants. 2(6):1–9. [DOI] [PubMed] [Google Scholar]
- Carroll SB. 2008. Evo-devo and an expanding evolutionary synthesis: a genetic theory of morphological evolution. Cell 134(1):25–36. [DOI] [PubMed] [Google Scholar]
- Ciezarek AG, Osborne OG, Shipley ON, Brooks EJ, Tracey SR, McAllister JD, Gardner LD, Sternberg MJE, Block B, Savolainen V.. 2019. Phylotranscriptomic insights into the diversification of endothermic Thunnus tunas. Mol Biol Evol. 36(1):84–96. [DOI] [PMC free article] [PubMed] [Google Scholar]
- Coburn RA, Griffin RH, Smith SD.. 2015. Genetic basis for a rare floral mutant in an andean species of solanaceae. Am J Bot. 102(2):264–272. [DOI] [PubMed] [Google Scholar]
- Cole CT, Ingvarsson PK.. 2018. Pathway position constrains the evolution of an ecologically important pathway in aspens (Populus tremula L.). Mol Ecol. 27(16):3317–3330. [DOI] [PubMed] [Google Scholar]
- Czechowski T, Bari RP, Stitt M, Scheible W-R, Udvardi MK.. 2004. Real-time RT-PCR profiling of over 1400 Arabidopsis transcription factors: unprecedented sensitivity reveals novel root- and shoot-specific genes. Plant J. 38(2):366–379. [DOI] [PubMed] [Google Scholar]
- Dall’Olio GM, Laayouni H, Luisi P, Sikora M, Montanucci L, Bertranpetit J.. 2012. Distribution of events of positive selection and population differentiation in a metabolic pathway: the case of asparagine N-glycosylation. BMC Evol Biol. 12:98. [DOI] [PMC free article] [PubMed] [Google Scholar]
- Davidson NM, Oshlack A.. 2014. Corset: enabling differential gene expression analysis for de novo assembled transcriptomes. Genome Biol. 15(7):410. [DOI] [PMC free article] [PubMed] [Google Scholar]
- Davies KM, Albert NW, Schwinn KE, Davies KM, Albert NW, Schwinn KE.. 2012. From landing lights to mimicry: the molecular regulation of flower colouration and mechanisms for pigmentation patterning. Funct Plant Biol. 39(8):619–638. [DOI] [PubMed] [Google Scholar]
- Deng C, Cheng C-HC, Ye H, He X, Chen L.. 2010. Evolution of an antifreeze protein by neofunctionalization under escape from adaptive conflict. Proc Natl Acad Sci U S A. 107(50):21593–21598. [DOI] [PMC free article] [PubMed] [Google Scholar]
- dePamphilis CW, Palmer JD.. 1990. Loss of photosynthetic and chlororespiratory genes from the plastid genome of a parasitic flowering plant. Nature 348(6299):337–339. [DOI] [PubMed] [Google Scholar]
- Ding B, Patterson EL, Holalu SV, Li J, Johnson GA, Stanley LE, Greenlee AB, Peng F, Bradshaw HD, Blinov ML, et al. 2020. Two MYB proteins in a self-organizing activator-inhibitor system produce spotted pigmentation patterns. Curr Biol. 30(5):802–814.e8. [DOI] [PMC free article] [PubMed] [Google Scholar]
- Doebley J, Lukens L.. 1998. Transcriptional regulators and the evolution of plant form. Plant Cell. 10(7):1075–1082. [DOI] [PMC free article] [PubMed] [Google Scholar]
- Drummond DA, Raval A, Wilke CO.. 2006. A single determinant dominates the rate of yeast protein evolution. Mol Biol Evol. 23(2):327–337. [DOI] [PubMed] [Google Scholar]
- Drummond DA, Wilke CO.. 2008. Mistranslation-induced protein misfolding as a dominant constraint on coding-sequence evolution. Cell 134(2):341–352. [DOI] [PMC free article] [PubMed] [Google Scholar]
- Duret L, Mouchiroud D.. 2000. Determinants of substitution rates in mammalian genes: expression pattern affects selection intensity but not mutation rate. Mol Biol Evol. 17(1):68–74. [DOI] [PubMed] [Google Scholar]
- Esfeld K, Berardi AE, Moser M, Bossolini E, Freitas L, Kuhlemeier C.. 2018. Pseudogenization and resurrection of a speciation gene. Curr Biol. 28(23):3776–3786.e7. [DOI] [PubMed] [Google Scholar]
- Facciuto G, Pannunzio MJCoviella A, Bologna P, Soto S, Imhof L, Borja M.. 2009. Calibrachoa breeding advances in Argentina. Acta Hortic. 813:121–126. [Google Scholar]
- Filipowicz N, Nee M, Renner S.. 2012. Description and molecular diagnosis of a new species of Brunfelsia (Solanaceae) from the Bolivian and Argentinean Andes. Phytokeys 10(0):83–94. [DOI] [PMC free article] [PubMed] [Google Scholar]
- Flowers J, Sezgin E, Kumagai S, Duvernell D, Matzkin L, Schmidt P, Eanes W.. 2007. Adaptive evolution of metabolic pathways in Drosophila. Mol Biol Evol. 24(6):1347–1354. [DOI] [PubMed] [Google Scholar]
- Foote AD, Liu Y, Thomas GW, Vinař T, Alföldi J, Deng J, Dugan S, van Elk CE, Hunter ME, Joshi V, et al. 2015. Convergent evolution of the genomes of marine mammals. Nat Genet. 47(3):272–275. [DOI] [PMC free article] [PubMed] [Google Scholar]
- Fregonezi JN, de Freitas LB, Bonatto SL, Semir J, Stehmann JR.. 2012. Infrageneric classification of Calibrachoa (Solanaceae) based on morphological and molecular evidence. Taxon 61(1):120–130. [Google Scholar]
- Fregonezi JN, Turchetto C, Bonatto SL, Freitas LB.. 2013. Biogeographical history and diversification of Petunia and Calibrachoa (Solanaceae) in the Neotropical Pampas grassland. Bot J Linn Soc. 171(1):140–153. [Google Scholar]
- Gates DJ, Strickler SR, Mueller LA, Olson BJSC, Smith SD.. 2016. Diversification of R2R3-MYB transcription factors in the tomato family Solanaceae. J Mol Evol. 83(1–2):26–37. [DOI] [PubMed] [Google Scholar]
- Ghaemmaghami S, Huh W-K, Bower K, Howson RW, Belle A, Dephoure N, O'Shea EK, Weissman JS.. 2003. Global analysis of protein expression in yeast. Nature 425(6959):737–741. [DOI] [PubMed] [Google Scholar]
- Gould KS. 2004. Nature’s Swiss army knife: the diverse protective roles of anthocyanins in leaves. J Biomed Biotechnol. 2004(5):314–320. [DOI] [PMC free article] [PubMed] [Google Scholar]
- Grabherr MG, Haas BJ, Yassour M, Levin JZ, Thompson DA, Amit I, Adiconis X, Fan L, Raychowdhury R, Zeng Q, et al. 2011. Full-length transcriptome assembly from RNA-Seq data without a reference genome. Nat Biotechnol. 29(7):644–652. [DOI] [PMC free article] [PubMed] [Google Scholar]
- Greenberg AJ, Stockwell SR, Clark AG.. 2008. Evolutionary constraint and adaptation in the metabolic network of Drosophila. Mol Biol Evol. 25(12):2537–2546. [DOI] [PMC free article] [PubMed] [Google Scholar]
- Hahn MW, Kern AD.. 2005. Comparative genomics of centrality and essentiality in three eukaryotic protein-interaction networks. Mol Biol Evol. 22(4):803–806. [DOI] [PubMed] [Google Scholar]
- Halabi K, Karin EL, Guéguen L, Mayrose I.. 2021. A codon model for associating phenotypic traits with altered selective patterns of sequence evolution. Syst Biol. 70(3):608–622. [DOI] [PubMed] [Google Scholar]
- Ho WW, Smith SD.. 2016. Molecular evolution of anthocyanin pigmentation genes following losses of flower color. BMC Evol Biol. 16(1):98. [DOI] [PMC free article] [PubMed] [Google Scholar]
- Hoballah ME, Gübitz T, Stuurman J, Broger L, Barone M, Mandel T, Dell'Olivo A, Arnold M, Kuhlemeier C.. 2007. Single gene–mediated shift in pollinator attraction in Petunia. Plant Cell. 19(3):779–790. [DOI] [PMC free article] [PubMed] [Google Scholar]
- Hu Z, Sackton TB, Edwards SV, Liu JS.. 2019. Bayesian detection of convergent rate changes of conserved noncoding elements on phylogenetic trees. Mol Biol Evol. 36(5):1086–1100. [DOI] [PMC free article] [PubMed] [Google Scholar]
- Invergo BM, Montanucci L, Laayouni H, Bertranpetit J.. 2013. A system-level, molecular evolutionary analysis of mammalian phototransduction. BMC Evol Biol. 13:52. [DOI] [PMC free article] [PubMed] [Google Scholar]
- Jiang C-K, Rao G-Y.. 2020. Insights into the diversification and evolution of R2R3-MYB transcription factors in plants. Plant Physiol. 183(2):637–655. [DOI] [PMC free article] [PubMed] [Google Scholar]
- Jovelin R, Phillips PC.. 2011. Expression level drives the pattern of selective constraints along the insulin/tor signal transduction pathway in Caenorhabditis. Genome Biol Evol. 3:715–722. [DOI] [PMC free article] [PubMed] [Google Scholar]
- Katoh K, Standley DM.. 2013. MAFFT multiple sequence alignment software version 7: improvements in performance and usability. Mol Biol Evol. 30(4):772–780. [DOI] [PMC free article] [PubMed] [Google Scholar]
- Kendall MG. 1938. A new measure of rank correlation. Biometrika 30(1–2):81–93. [Google Scholar]
- Kiefer C, Willing E-M, Jiao W-B, Sun H, Piednoël M, Hümann U, Hartwig B, Koch MA, Schneeberger K.. 2019. Interspecies association mapping links reduced CG to TG substitution rates to the loss of gene-body methylation. Nat Plants. 5(8):846–855. [DOI] [PubMed] [Google Scholar]
- Koes RE, Spelt CE, Mol JN.. 1989. The chalcone synthase multigene family of Petunia hybrida (V30): differential, light-regulated expression during flower development and UV light induction. Plant Mol Biol. 12(2):213–225. [DOI] [PubMed] [Google Scholar]
- Kosakovsky Pond SL, Poon AFY, Velazquez R, Weaver S, Hepler NL, Murrell B, Shank SD, Magalis BR, Bouvier D, Nekrutenko A, et al. 2020. HyPhy 2.5—a customizable platform for evolutionary hypothesis testing using phylogenies. Mol Biol Evol. 37(1):295–299. [DOI] [PMC free article] [PubMed] [Google Scholar]
- Kruskal WH, Wallis WA.. 1952. Use of ranks in one-criterion variance analysis. J Am Stat Assoc. 47(260):583–621. [Google Scholar]
- Lagercrantz U, Axelsson T.. 2000. Rapid evolution of the family of CONSTANS LIKE genes in plants. Mol Biol Evol. 17(10):1499–1507. [DOI] [PubMed] [Google Scholar]
- Larter M, Dunbar-Wallis A, Berardi AE, Smith SD.. 2018. Convergent evolution at the pathway level: predictable regulatory changes during flower color transitions. Mol Biol Evol. 35(9):2159–2169. [DOI] [PubMed] [Google Scholar]
- Larter M, Dunbar-Wallis A, Berardi AE, Smith SD.. 2019. Developmental control of convergent floral pigmentation across evolutionary timescales. Dev Dyn. 248(11):1091–1100. [DOI] [PubMed] [Google Scholar]
- Liu X, Clarke ND.. 2002. Rationalization of gene regulation by a eukaryotic transcription factor: calculation of regulatory region occupancy from predicted binding affinities. J Mol Biol. 323(1):1–8. [DOI] [PubMed] [Google Scholar]
- Livingstone K, Anderson S.. 2009. Patterns of variation in the evolution of carotenoid biosynthetic pathway enzymes of higher plants. J Hered. 100(6):754–761. [DOI] [PubMed] [Google Scholar]
- Lu Y, Rausher MD.. 2003. Evolutionary rate variation in anthocyanin pathway genes. Mol Biol Evol. 20(11):1844–1853. [DOI] [PubMed] [Google Scholar]
- Lynch M, Conery JS.. 2000. The evolutionary fate and consequences of duplicate genes. Science 290(5494):1151–1155. [DOI] [PubMed] [Google Scholar]
- Madden T. 2013. The BLAST sequence analysis tool. In: The NCBI handbook [Internet]. 2nd ed. Bethesda (MD): National Center for Biotechnology Information (US). Available from: https://www.ncbi.nlm.nih.gov/books/NBK148670/. [Google Scholar]
- Mäder G, Freitas LB.. 2019. Biogeographical, ecological, and phylogenetic analyses clarifying the evolutionary history of Calibrachoa in South American grasslands. Mol Phylogenet Evol. 141:106614. [DOI] [PubMed] [Google Scholar]
- Marshall CR, Raff EC, Raff RA.. 1994. Dollo’s law and the death and resurrection of genes. Proc Natl Acad Sci U S A. 91(25):12283–12287. [DOI] [PMC free article] [PubMed] [Google Scholar]
- Martins TR, Jiang P, Rausher MD.. 2017. How petals change their spots: cis-regulatory re-wiring in Clarkia (Onagraceae). New Phytol. 216(2):510–518. [DOI] [PubMed] [Google Scholar]
- Masalia RR, Bewick AJ, Burke JM.. 2017. Connectivity in gene coexpression networks negatively correlates with rates of molecular evolution in flowering plants. PLoS One 12(7):e0182289. [DOI] [PMC free article] [PubMed] [Google Scholar]
- Meredith RW, Gatesy J, Springer MS.. 2013. Molecular decay of enamel matrix protein genes in turtles and other edentulous amniotes. BMC Evol Biol. 13(1):20. [DOI] [PMC free article] [PubMed] [Google Scholar]
- Montanucci L, Laayouni H, Dobon B, Keys KL, Bertranpetit J, Peretó J.. 2018. Influence of pathway topology and functional class on the molecular evolution of human metabolic genes. PLoS One 13(12):e0208782. [DOI] [PMC free article] [PubMed] [Google Scholar]
- Morales-Briones DF, Kadereit G, Tefarikis DT, Moore MJ, Smith SA, Brockington SF, Timoneda A, Yim WC, Cushman JC, Yang Y.. 2021. Disentangling sources of gene tree discordance in phylogenomic data sets: testing ancient hybridizations in Amaranthaceae s.l. Syst Biol. 70(2):219–235. [DOI] [PMC free article] [PubMed] [Google Scholar]
- Mukherjee D, Mukherjee A, Ghosh TC.. 2016. Evolutionary rate heterogeneity of primary and secondary metabolic pathway genes in Arabidopsis thaliana. Genome Biol Evol. 8(1):17–28. [DOI] [PMC free article] [PubMed] [Google Scholar]
- Muntané G, Farré X, Rodríguez JA, Pegueroles C, Hughes DA, de Magalhães JP, Gabaldón T, Navarro A.. 2018. Biological processes modulating longevity across primates: a phylogenetic genome-phenome analysis. Mol Biol Evol. 35(8):1990–2004. [DOI] [PMC free article] [PubMed] [Google Scholar]
- Murrell B, Moola S, Mabona A, Weighill T, Sheward D, Kosakovsky Pond SL, Scheffler K.. 2013. FUBAR: a fast, unconstrained bayesian approximation for inferring selection. Mol Biol Evol. 30(5):1196–1205. [DOI] [PMC free article] [PubMed] [Google Scholar]
- Ng J, Smith SD.. 2016. Widespread flower color convergence in Solanaceae via alternate biochemical pathways. New Phytol. 209(1):407–417. [DOI] [PubMed] [Google Scholar]
- Olmstead RG, Bohs L, Migid HA, Santiago-Valentin E, Garcia VF, Collier SM.. 2008. A molecular phylogeny of the Solanaceae. Taxon 57(4):1159–1181. [Google Scholar]
- Olson-Manning CF, Lee C-R, Rausher MD, Mitchell-Olds T.. 2013. Evolution of flux control in the glucosinolate pathway in Arabidopsis thaliana. Mol Biol Evol. 30(1):14–23. [DOI] [PMC free article] [PubMed] [Google Scholar]
- Pál C, Papp B, Hurst LD.. 2001. Highly expressed genes in yeast evolve slowly. Genetics 158(2):927–931. [DOI] [PMC free article] [PubMed] [Google Scholar]
- Passow CN, Bronikowski AM, Blackmon H, Parsai S, Schwartz TS, McGaugh SE.. 2019. Contrasting patterns of rapid molecular evolution within the p53 network across mammal and sauropsid lineages. Genome Biol Evol. 11(3):629–643. [DOI] [PMC free article] [PubMed] [Google Scholar]
- Patro R, Duggal G, Love MI, Irizarry RA, Kingsford C.. 2017. Salmon: fast and bias-aware quantification of transcript expression using dual-phase inference. Nat Methods. 14(4):417–419. [DOI] [PMC free article] [PubMed] [Google Scholar]
- Pinheiro J, Bates D, DebRoy S, Sarkar D; R Core Team. 2021. nlme: linear and nonlinear mixed effects models. Manual. Available from: https://CRAN.R-project.org/package=nlme
- Poon A, Chao L.. 2005. The rate of compensatory mutation in the DNA bacteriophage phiX174. Genetics 170(3):989–999. [DOI] [PMC free article] [PubMed] [Google Scholar]
- Preston JC, Martinez CC, Hileman LC.. 2011. Gradual disintegration of the floral symmetry gene network is implicated in the evolution of a wind-pollination syndrome. Proc Natl Acad Sci U S A. 108(6):2343–2348. [DOI] [PMC free article] [PubMed] [Google Scholar]
- Protas M, Conrad M, Gross JB, Tabin C, Borowsky R.. 2007. Regressive evolution in the Mexican cave tetra, Astyanax mexicanus. Curr Biol. 17(5):452–454. [DOI] [PMC free article] [PubMed] [Google Scholar]
- Prudent X, Parra G, Schwede P, Roscito JG, Hiller M.. 2016. Controlling for phylogenetic relatedness and evolutionary rates improves the discovery of associations between species’ phenotypic and genomic differences. Mol Biol Evol. 33(8):2135–2150. [DOI] [PMC free article] [PubMed] [Google Scholar]
- Purugganan MD, Wessler SR.. 1994. Molecular evolution of the plant R regulatory gene family. Genetics 138(3):849–854. [DOI] [PMC free article] [PubMed] [Google Scholar]
- Quattrocchio F, Baudry A, Lepiniec L, Grotewold E.. 2006. The regulation of flavonoid biosynthesis. In: Grotewold E, editor. The science of flavonoids. New York: Springer. p. 97–122. doi:10.1007/978-0-387-28822-2_ 4. [Google Scholar]
- Quattrocchio F, Wing J, Leppen H, Mol J, Koes R.. 1993. Regulatory genes controlling anthocyanin pigmentation are functionally conserved among plant species and have distinct sets of target genes. Plant Cell. 5(11):1497–1512. [DOI] [PMC free article] [PubMed] [Google Scholar]
- Quattrocchio F, Wing J, van der Woude K, Souer E, de Vetten N, Mol J, Koes R.. 1999. Molecular analysis of the anthocyanin2 gene of petunia and its role in the evolution of flower color. Plant Cell. 11(8):1433–1444. [DOI] [PMC free article] [PubMed] [Google Scholar]
- Ramos-Onsins SE, Puerma E, Balañá-Alcaide D, Salguero D, Aguadé M.. 2008. Multilocus analysis of variation using a large empirical data set: phenylpropanoid pathway genes in Arabidopsis thaliana. Mol Ecol. 17(5):1211–1223. [DOI] [PubMed] [Google Scholar]
- Ramsay H, Rieseberg LH, Ritland K.. 2009. The correlation of evolutionary rate with pathway position in plant terpenoid biosynthesis. Mol Biol Evol. 26(5):1045–1053. [DOI] [PubMed] [Google Scholar]
- Ramsay NA, Glover BJ.. 2005. MYB-bHLH-WD40 protein complex and the evolution of cellular diversity. Trends Plant Sci. 10(2):63–70. [DOI] [PubMed] [Google Scholar]
- Rausher MD. 2013. The evolution of genes in branched metabolic pathways. Evolution 67(1):34–48. [DOI] [PubMed] [Google Scholar]
- Rausher MD, Lu Y, Meyer K.. 2008. Variation in constraint versus positive selection as an explanation for evolutionary rate variation among anthocyanin genes. J Mol Evol. 67(2):137–144. [DOI] [PubMed] [Google Scholar]
- Rausher MD, Miller RE, Tiffin P.. 1999. Patterns of evolutionary rate variation among genes of the anthocyanin biosynthetic pathway. Mol Biol Evol. 16(2):266–274. [DOI] [PubMed] [Google Scholar]
- Reck-Kortmann M, Silva-Arias GA, Stehmann JR, Greppi JA, Freitas LB.. 2015. Phylogenetic relationships of Petunia patagonica (Solanaceae) revealed by molecular and biogeographical evidence. Phytotaxa 222(1):17–32 [Google Scholar]
- Revell LJ. 2012. phytools: an R package for phylogenetic comparative biology (and other things). Methods Ecol Evol. 3(2):217–223. [Google Scholar]
- Rodríguez-Trelles F, Tarrío R, Ayala FJ.. 2003. Convergent neofunctionalization by positive Darwinian selection after ancient recurrent duplications of the xanthine dehydrogenase gene. Proc Natl Acad Sci U S A. 100(23):13413–13417. [DOI] [PMC free article] [PubMed] [Google Scholar]
- Rohlf FJ. 2001. Comparative methods for the analysis of continuous variables: geometric interpretations. Evolution 55(11):2143–2160. [DOI] [PubMed] [Google Scholar]
- Särkinen T, Bohs L, Olmstead RG, Knapp S.. 2013. A phylogenetic framework for evolutionary study of the nightshades (Solanaceae): a dated 1000-tip tree. BMC Evol Biol. 13(1):214. [DOI] [PMC free article] [PubMed] [Google Scholar]
- Schwinn K, Venail J, Shang Y, Mackay S, Alm V, Butelli E, Oyama R, Bailey P, Davies K, Martin C.. 2006. A small family of MYB-regulatory genes controls floral pigmentation intensity and patterning in the genus Antirrhinum. Plant Cell. 18(4):831–851. [DOI] [PMC free article] [PubMed] [Google Scholar]
- Sheehan H, Moser M, Klahre U, Esfeld K, Dell'Olivo A, Mandel T, Metzger S, Vandenbussche M, Freitas L, Kuhlemeier C.. 2016. MYB-FL controls gain and loss of floral UV absorbance, a key trait affecting pollinator preference and reproductive isolation. Nat Genet. 48(2):159–166. [DOI] [PubMed] [Google Scholar]
- Shoeva OY, Glagoleva AY, Khlestkina EK.. 2017. The factors affecting the evolution of the anthocyanin biosynthesis pathway genes in monocot and dicot plant species. BMC Plant Biol. 17(Suppl 2):256. [DOI] [PMC free article] [PubMed] [Google Scholar]
- Slotte T, Bataillon T, Hansen TT, St. Onge K, Wright SI, Schierup MH.. 2011. Genomic determinants of protein evolution and polymorphism in Arabidopsis. Genome Biol Evol. 3:1210–1219. [DOI] [PMC free article] [PubMed] [Google Scholar]
- Smith SA, O’Meara BC.. 2012. treePL: divergence time estimation using penalized likelihood for large phylogenies. Bioinformatics 28(20):2689–2690. [DOI] [PubMed] [Google Scholar]
- Sobel JM, Streisfeld MA.. 2013. Flower color as a model system for studies of plant evo-devo. Front Plant Sci. 4:321. [DOI] [PMC free article] [PubMed] [Google Scholar]
- Song L, Florea L.. 2015. Rcorrector: efficient and accurate error correction for Illumina RNA-seq reads. GigaScience 4(1):48. [DOI] [PMC free article] [PubMed] [Google Scholar]
- Spelt C, Quattrocchio F, Mol JNM, Koes R.. 2000. Anthocyanin1 of petunia encodes a basic helix-loop-helix protein that directly activates transcription of structural anthocyanin genes. Plant Cell. 12(9):1619–1631. [DOI] [PMC free article] [PubMed] [Google Scholar]
- Springer MS, Guerrero-Juarez CF, Huelsmann M, Collin MA, Danil K, McGowen MR, Oh JW, Ramos R, Hiller M, Plikus MV, et al. 2021. Genomic and anatomical comparisons of skin support independent adaptation to life in water by cetaceans and hippos. Curr Biol. 31(10):2124–2139.e3. [DOI] [PMC free article] [PubMed] [Google Scholar]
- Stamatakis A. 2014. RAxML version 8: a tool for phylogenetic analysis and post-analysis of large phylogenies. Bioinformatics 30(9):1312–1313. [DOI] [PMC free article] [PubMed] [Google Scholar]
- Streisfeld MA, Liu D, Rausher MD.. 2011. Predictable patterns of constraint among anthocyanin-regulating transcription factors in Ipomoea. New Phytol. 191(1):264–274. [DOI] [PubMed] [Google Scholar]
- Subramanian S, Kumar S.. 2004. Gene expression intensity shapes evolutionary rates of the proteins encoded by the vertebrate genome. Genetics 168(1):373–381. [DOI] [PMC free article] [PubMed] [Google Scholar]
- Suyama M, Torrents D, Bork P.. 2006. PAL2NAL: robust conversion of protein sequence alignments into the corresponding codon alignments. Nucleic Acids Res. 34(Web Server issue):W609–W612. [DOI] [PMC free article] [PubMed] [Google Scholar]
- TransDecoder/TransDecoder. 2021. Available from: https://github.com/TransDecoder/TransDecoder. Original date: 2015-01-25T15:02:27Z.
- van Tunen AJ, Koes RE, Spelt CE, van der Krol AR, Stuitje AR, Mol JN.. 1988. Cloning of the two chalcone flavanone isomerase genes from Petunia hybrida: coordinate, light-regulated and differential expression of flavonoid genes. EMBO J. 7(5):1257–1263. [DOI] [PMC free article] [PubMed] [Google Scholar]
- Vaquerizas JM, Kummerfeld SK, Teichmann SA, Luscombe NM.. 2009. A census of human transcription factors: function, expression and evolution. Nat Rev Genet. 10(4):252–263. [DOI] [PubMed] [Google Scholar]
- Vitkup D, Kharchenko P, Wagner A.. 2006. Influence of metabolic network structure and function on enzyme evolution. Genome Biol. 7(5):R39. [DOI] [PMC free article] [PubMed] [Google Scholar]
- Walker JF, Smith SA, Hodel RGJ, Moyroud E.. 2021. Concordance-based approaches for the inference of relationships and molecular rates with phylogenomic data sets. Syst Biol. doi: 10.1093/sysbio/syab052. [DOI] [PubMed] [Google Scholar]
- Wertheim JO, Murrell B, Smith MD, Kosakovsky Pond SL, Scheffler K.. 2015. RELAX: detecting relaxed selection in a phylogenetic framework. Mol Biol Evol. 32(3):820–832. [DOI] [PMC free article] [PubMed] [Google Scholar]
- Wheeler LC, Smith SD.. 2019. Computational modeling of anthocyanin pathway evolution: biases, hotspots, and trade-offs. Integr Comp Biol. 59(3):585–598. [DOI] [PubMed] [Google Scholar]
- Wheeler LC, Wing BA, Smith SD.. 2021. Structure and contingency determine mutational hotspots for flower color evolution. Evol Lett. 5(1):61–74. [DOI] [PMC free article] [PubMed] [Google Scholar]
- Whitfield LS, Lovell-Badge R, Goodfellow PN.. 1993. Rapid sequence evolution of the mammalian sex-determining gene SRY. Nature 364(6439):713–715. [DOI] [PubMed] [Google Scholar]
- Winkel-Shirley B. 2001. Flavonoid biosynthesis. A colorful model for genetics, biochemistry, cell biology, and biotechnology. Plant Physiol. 126(2):485–493. [DOI] [PMC free article] [PubMed] [Google Scholar]
- Wright KM, Rausher MD.. 2010. The evolution of control and distribution of adaptive mutations in a metabolic pathway. Genetics 184(2):483–502. [DOI] [PMC free article] [PubMed] [Google Scholar]
- Wu X, Chi X, Wang P, Zheng D, Ding R, Li Y.. 2010. The evolutionary rate variation among genes of HOG-signaling pathway in yeast genomes. Biol Direct. 5(1):46. [DOI] [PMC free article] [PubMed] [Google Scholar]
- Yang L, Gaut BS.. 2011. Factors that contribute to variation in evolutionary rate among Arabidopsis genes. Mol Biol Evol. 28(8):2359–2369. [DOI] [PubMed] [Google Scholar]
- Yang Y, Smith SA.. 2014. Orthology inference in nonmodel organisms using transcriptomes and low-coverage genomes: improving accuracy and matrix occupancy for phylogenomics. Mol Biol Evol. 31(11):3081–3092. [DOI] [PMC free article] [PubMed] [Google Scholar]
- Yang Z. 2007. PAML 4: phylogenetic analysis by maximum likelihood. Mol Biol Evol. 24(8):1586–1591. [DOI] [PubMed] [Google Scholar]
- Zhang B, Xu X, Huang R, Yang S, Li M, Guo Y.. 2021. CRISPR/Cas9-mediated targeted mutation reveals a role for AN4 rather than DPL in regulating venation formation in the corolla tube of Petunia hybrida. Hortic Res. 8(1):1–9. [DOI] [PMC free article] [PubMed] [Google Scholar]
- Zhang H, Koes R, Shang H, Fu Z, Wang L, Dong X, Zhang J, Passeri V, Li Y, Jiang H, et al. 2019. Identification and functional analysis of three new anthocyanin R2R3-MYB genes in Petunia. Plant Direct. 3(1):e00114. [DOI] [PMC free article] [PubMed] [Google Scholar]
- Zufall RA, Rausher MD.. 2004. Genetic changes associated with floral adaptation restrict future evolutionary potential. Nature 428(6985):847–850. [DOI] [PubMed] [Google Scholar]
Associated Data
This section collects any data citations, data availability statements, or supplementary materials included in this article.
Supplementary Materials
Data Availability Statement
The supplemental scripts and processed data files (including transcriptome assemblies) needed to conduct the analyses referenced throughout the manuscript can be found in the supplementary OSF repo (https://osf.io/b7gcp/). The raw RNA-seq data files have been uploaded to the SRA (BioProject PRJNA746328, supplementary table S1, Supplementary Material online).