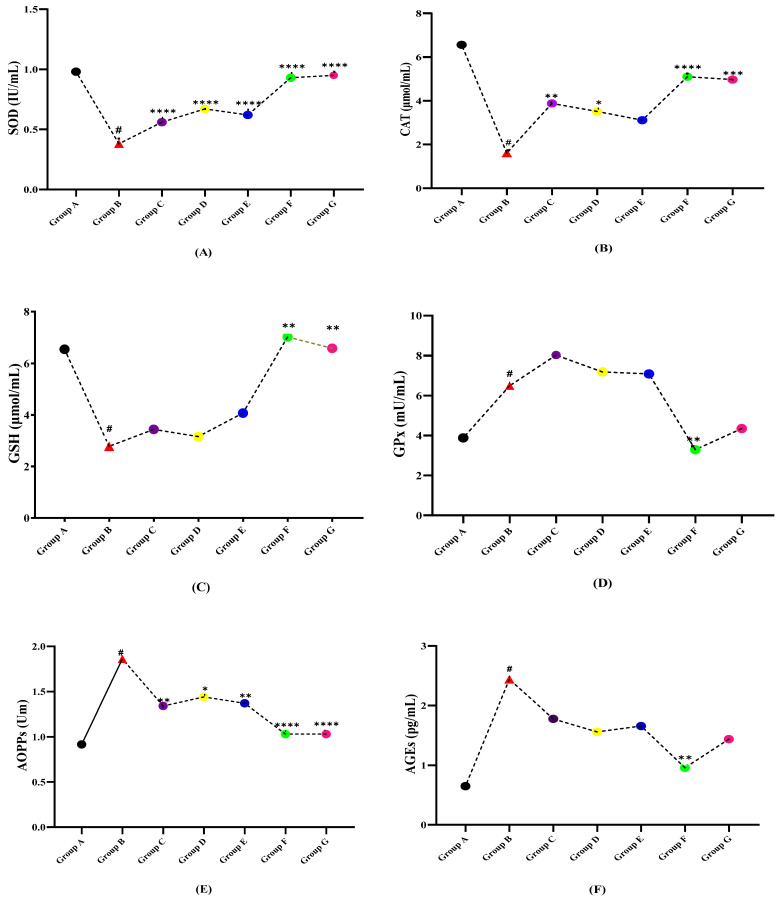
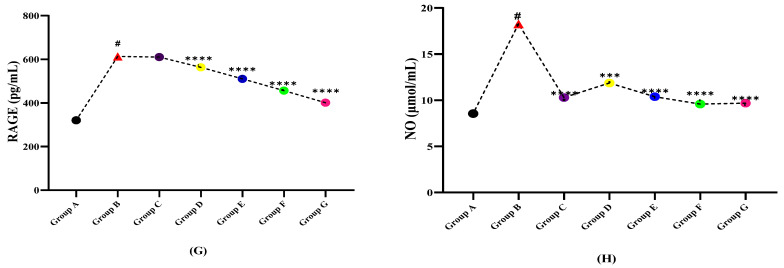
Figure 3.
Comparison of plant extracts treated groups independently against LPS induced multiple sclerotic Wistar rats (A) SOD, (B) CAT, (C) GSH, (D) GPx, (E) AOPPs, (F) AGEs (G) RAGE, and (H) NO. (# indicate reference group EAE model while Asterisks are showing the significance in the improvement of results as compared to reference group B). (*) slight significance, (**) moderate significance, (***) high significance, (****) very highly/effective significance.


