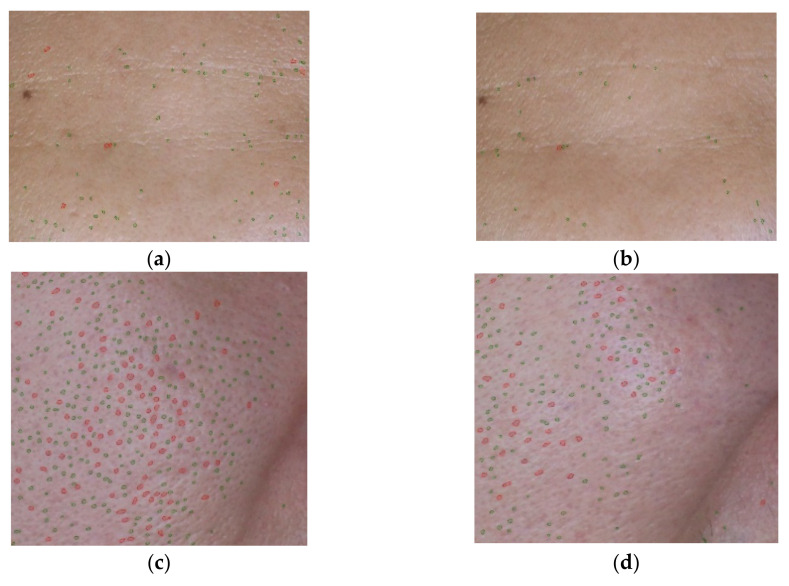
Figure 4.
An example of pore area visualization from the A. racemosus Willd. root extract solution treatment using VisioFace® CSI software (Köln, Germany) (a) before and (b) after 30 days of the extract treatment on forehead; (c) before and (d) after 30 days of the extract treatment on right cheek. Red spots = large pores; green spots = fine pores.

