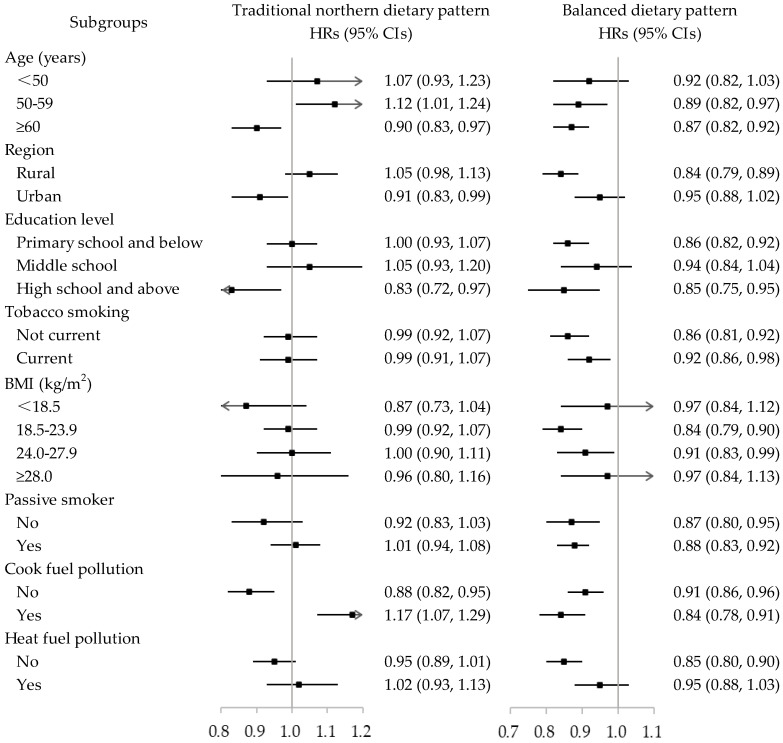
Figure 1.
Subgroup analyses of the association between two dietary patterns and risk of COPD. Note: HRs (95% CIs) per standard deviation change of each dietary pattern score for Model 3 were presented. Adjusted variables included sex, education level, marital status, household income, tobacco smoking, alcohol consumption, nutritional supplement, BMI, physical activity, daily energy intake, passive smoking, cook fuel pollution, and heat fuel pollution, if appropriate. p values for interaction were <6.25 × 10⁻³ for region (p < 0.001) in the traditional northern dietary pattern and tobacco smoking (p < 0.001) and BMI (p = 0.006) in the balanced dietary pattern. HR: hazard ratio; CI: confidence interval; CNY: unit of Chinese money Yuan; BMI: body mass index.

