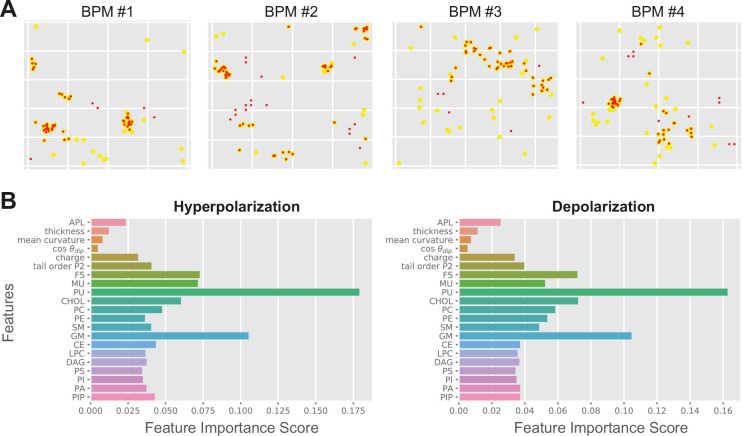
Figure 4. Random forest output.
(A) Comparison between the predicted poration sites (red dots) and real poration sites (yellow dots). Only locations that were classified as porated in >90% of the trajectory frames are shown. (B) Feature importance score for average plasma membrane (APM) and brain plasma membrane (BPM) obtained under hyperpolarization and depolarization. The feature importance score quantifies how much each feature is used in each tree of the random forest.

