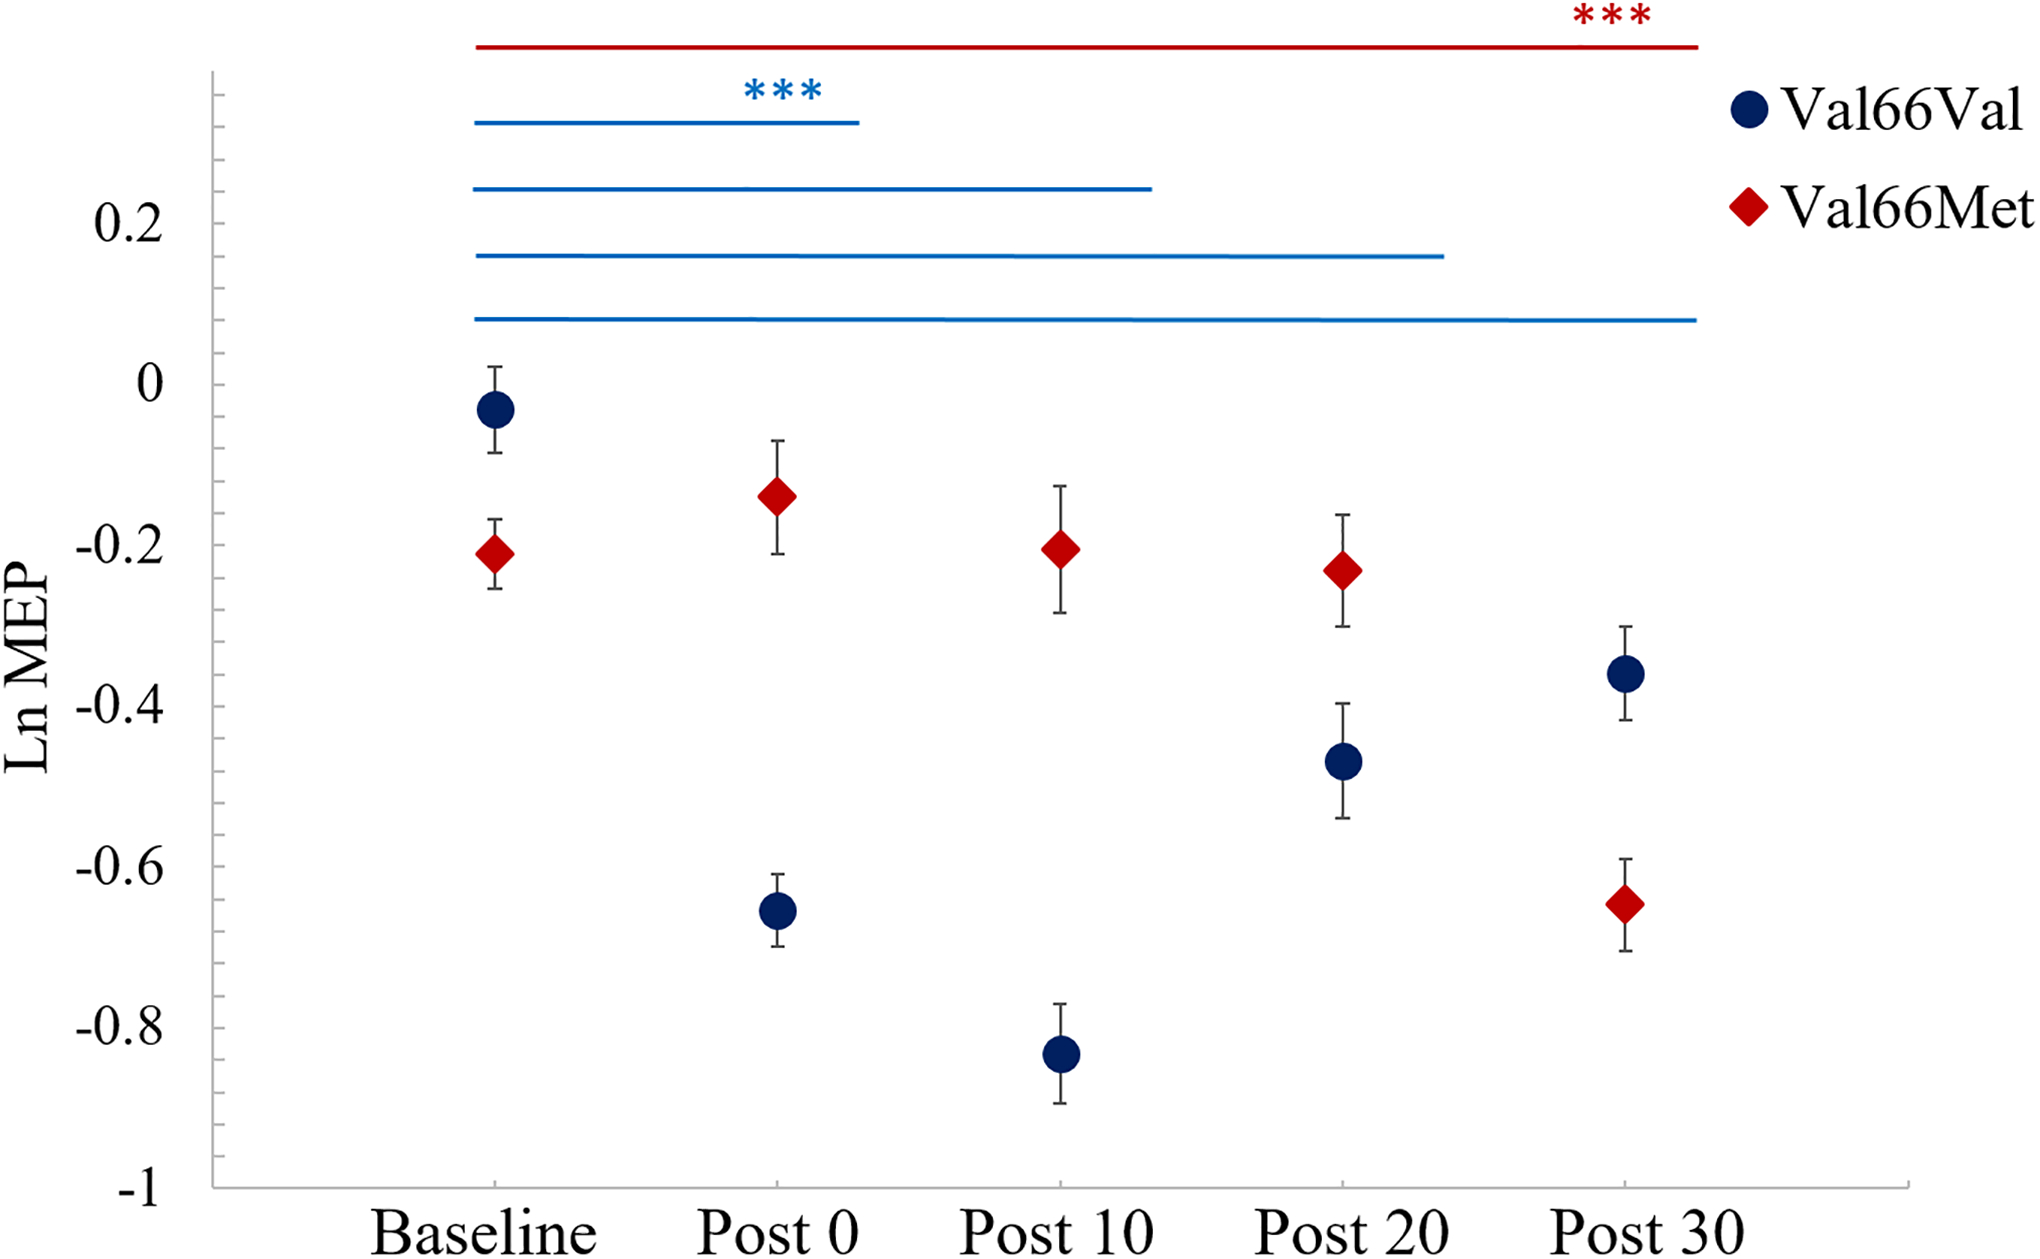
Figure 2. cTBS effects on LnMEPs by BDNF Genotype.

Mean LnMEPs at baseline and 0, 10, 20, and 30 minutes post-cTBS for BDNF Val66Val (blue) and Val66Met (red) carriers. Logarithmic scale relates to MEPs in mV. Error bars reflect Standard Error. Significance shown based on post-hoc pairwise comparisons tests of LnMEPs at different times for either Val66Val (blue bars) or Val66Met (red bars) group using estimated marginal means computed from model with a Tukey adjustment. *** indicates p <0.001.
