Abstract
MicroRNAs (miRNAs) are part of deregulated insulin secretion in type 2 diabetes (T2D) development. Rodent models have suggested miR-200c to be involved, but the role and potential as therapeutic target of this miRNA in human islets are not clear. Here we report increased expression of miR-200c in islets from T2D as compared with nondiabetic (ND) donors and display results showing reduced glucose-stimulated insulin secretion in EndoC-βH1 cells overexpressing miR-200c. We identify transcription factor ETV5 as the top rank target of miR-200c in human islets using TargetScan in combination with Pearson correlation analysis of miR-200c and mRNA expression data from the same human donors. Among other targets were JAZF1, as earlier shown in miR-200 knockout mice. Accordingly, linear model analysis of ETV5 and JAZF1 gene expression showed reduced expression of both genes in islets from human T2D donors. Western blot analysis confirmed the reduced expression of ETV5 on the protein level in EndoC-βH1 cells overexpressing miR-200c, and luciferase assay validated ETV5 as a direct target of miR-200c. Finally, LNA knockdown of miR-200c increased glucose-stimulated insulin secretion in islets from T2D donors approximately threefold. Our data reveal a vital role of the miR-200c–ETV5 axis in β-cell dysfunction and pathophysiology of T2D.
Introduction
Insulin secretion from pancreatic β-cells is central in the control of blood glucose, and it has become clear that dysfunctional insulin secretion is part of the pathogenesis of type 2 diabetes (T2D). The current view suggests that the β-cells need to secrete more insulin upon insulin resistance in target tissues and that failure to improve insulin secretion results in hyperglycemia and T2D (1). The defective insulin secretion is caused by impaired β-cell function as well as increased β-cell apoptosis and/or reduced β-cell proliferation (2,3).
MicroRNAs (miRNAs) are small RNAs that regulate genes at the posttranscriptional level mostly by direct base pairing with target mRNA at the 3′ untranslated region (UTR), and to some extent the 5′UTR, using their “seed” sequence (2–7 nucleotides long) (4). As regulators of gene expression, miRNAs are involved in the regulation and/or deregulation of both the β-cell secretion process and mechanisms controlling β-cell survival (5–7). Moreover, the changes in miRNA expression in islet cells during diabetes development occur either as part of the etiology of T2D or as a compensatory mechanism for insulin resistance (5,6).
Recent years have demonstrated that miRNA inhibitors (antagomirs or anti-miRs) can be used to improve cell function in cases where an elevated level of a miRNA is part of the disease pathogenesis (8,9). Among these inhibitors are the locked nucleotide acid (LNA)-based anti-miRs. These molecules have modified backbones, which makes them more stable in blood and therefore favorable as therapeutics (10). Currently several LNAs are in clinical trials; for instance, LNA inhibiting miR-92 is explored for its potential in wound healing (9).
Members of the miR-200 family (miR-200a, miR-200b, miR-200c, miR-429, and miR-141) are among the best studied β-cell miRNAs. These miRNAs are derived from two different chromosomal locations; miR-200a, -200b, and -429 come from human chromosome 1 and miR-200c and -141 from human chromosome 12. The family is divided into two classes (miR-200a and -141 and miR-200b, -200c, and -429) based on the homology of their seed sequences, with only a single base difference between the groups (11). Earlier reports have suggested that members of the miR-200 family are more abundant in human β- than α-cells (12). The expression of miR-200a, miR-200b, miR-200c, and miR-141 is regulated by the proapoptotic regulator Txnip (thioredoxin-interacting protein) (13). Overexpression of miR-200b was in the same study specifically shown to induce apoptosis in INS-1 cells through decreased Zeb1 (zinc finger E-box binding homeobox 1) (13). More recent work in a mouse model also suggested a role of a miR-200–Zeb1 axis in regulation of the epithelial-to-mesenchymal transition and differentiation (14). Moreover, in mice the miR-200 family induces β-cell apoptosis through modulation of an advanced network of several genes including JazF1 (juxtaposed with another zinc finger protein 1), thereby regulating β-cell survival in response to metabolic stress (15). However, functional implications of the miR-200 family in human islets are still not known.
In this study we use molecular, biochemical, and physiological approaches with the aim of investigating the role of miR-200c in insulin secretion in human islets. For this purpose, we 1) examined potential differential expression of miR-200c in T2D donor islets, 2) determined validated miR-200c targets and their function in β-cells, 3) explored effects on glucose-stimulated insulin secretion, and 4) evaluated whether an LNA antagomir targeting miR-200c (LNA200c) can be used to recover insulin secretion in islets from donors with T2D.
Research Design and Methods
Human Islets and Cell Lines
Human islets were obtained from the Nordic Network for Clinical Islet Transplantation and the Human Tissue Laboratory, EXODIAB/Lund University Diabetes Centre. Donor characteristics for each experiment are shown in Supplementary Table 1. Nondiabetic (ND) donors were defined as those with HbA1c <42 mmol/mol or no measured HbA1c. Donors or their relatives had given their written consent to donate organs for biomedical research upon admission to the intensive care unit. The work was approved by ethics committees at Uppsala University and Lund University. The islets were processed as previously described (16) and handpicked under stereomicroscope before use.
EndoC-βH1 cells (EndoCells, Paris, France) (17) were seeded in Matrigel/fibronectin-coated (100 μg/mL and 2 μg/mL, respectively; Sigma-Aldrich) culture vessels in DMEM containing 5.6 mmol/L glucose, 2% BSA fraction V, 10 mmol/L nicotinamide, 50 μmol/L 2-mercaptoethanol, 5.5 μg/mL transferrin, 6.7 ng/mL sodium selenite, 100 units/mL penicillin, and 100 μg/mL streptomycin. Cells were incubated in a humidified atmosphere with 5% CO2 at 37°C.
Overexpression and Knockdown in Cell Lines and Islets
Cells or islets were transfected with PremiR miRNA Precursor from Life Technologies: PremiR-Scramble (SCR, AM17110), PremiR-200c-3p (OE200c, AM17100), or miRcury LNA miRNA inhibitors from QIAGEN: LNA Scramble (no. 199005-00), LNA 200c (no. Y104101122-ADA), or SilencerSelect Pre-Designed siETV5 (nos. 4390771 and 4392420; Life Technologies, San Fransisco, CA) using Lipofectamine RNAiMAX (Life Technologies). EndoC-βH1 cells, 180,000 cells per well, were seeded in a 48-well plate containing 150 μL DMEM medium without antibiotics (penicillin/streptomycin) 1 day before transfection. For transfection of human islets, 100–200 islets were seeded in culture dishes containing RPMI media (with 5 mmol/L glucose, 10% FBS, and 200 mmol/L l-glutamine). A final transfection volume of 2.5 mL per dish contained 50 nmol/L LNA or siRNA in Opti-MEM reduced serum media and 6.25 μL Lipofectamine RNAiMAX. A second transfection was performed 24 h after the first transfection in human islets only. All functional experiments were performed 72 h after the first transfection.
Cells were assayed for insulin secretion after reaching ∼100% confluence. Protein and RNA samples were extracted from replicate wells at the same time.
Insulin Secretion Assay
Prior to insulin secretion measurements, batches of five human islets were preincubated for 30 min in 2.8 mmol/L glucose and stimulated for 1 h with either 2.8 mmol/L or 16.7 mmol/L glucose in 0.5 mL KREBS buffer.
EndoC-βH1 cells were transferred to complete glucose starvation medium containing 2.8 mmol/L for 18 h. Confluent plates were carefully washed twice with 1 mL prewarmed secretion assay buffer (SAB), pH 7.2 (1.16 mmol/L MgSO4, 4.7 mmol/L KCl, 1.2 mmol/L KH2 PO4, 114 mmol/L NaCl, 2.5 mmol/L CalCl2, 25.5 mmol/L NaHCO3, 20 mmol/L HEPES, and 0.2% BSA), containing 1 mmol/L glucose. Cells were then preincubated in a new 0.5 mL SAB with 1 mmol/L glucose for 2 h. The cells were stimulated in 0.25 mL SAB at 37°C for 1 h with 1 mmol/L glucose or 20 mmol/L glucose or for 15 min with 1 mmol/L glucose or 1 mmol/L glucose and 50 mmol/L KCl.
After stimulation, islets or cells were dissolved in radioimmunoprecipitation assay buffer (50 mmol/L Tris-HCl, 150 mmol/L NaCl, 0.5 mmol/L Na-deoxycholate, 2 mmol/L EDTA, 50 mmol/L NaF, 1 % Triton-X, and 0.1% SDS) and sonicated. Supernatant and dissolved islets were analyzed with Insulin ELISA (no. 10-1113-01; Mercodia). Total protein content (EndoC-βH1) was analyzed with BCA assay (Pierce BCA Protein Assay Kit; Thermo Scientific, IL) on a Model 680 Microplate Reader (Bio-Rad Laboratories, Hercules, CA).
Total RNA Extraction and Quality Control
QIAGEN miRNeasy isolation kit was used to extract total RNA according to the manufacturer’s instructions (QIAGEN, Hilden, Germany). The RNA concentration was measured using 1.5 μL on a NanoDrop (ND-1000; Thermo Fisher Scientific, Waltham, MA). The quality and integrity of the RNA were evaluated by both spectrophotometry and electropherogram profiles with NanoDrop (ND-1000) and the Experion automated electrophoresis system (Bio-Rad Laboratories).
Quantification of miRNAs and mRNAs by Real-time Quantitative PCR
cDNA was generated with High-Capacity cDNA Reverse Transcription Kit according to the manufacturer’s instructions (Applied Biosystems, CA). Quantitative PCR (qPCR) was performed in triplicates on a 384-well plate using Applied Biosystems QuantStudio 7 Flex Real Time PCR system under default cycling parameters. Specific primers and probes from TaqMan MiRNA Assays (Applied Biosystems) were used to measure the expression level of miR-200a-3p (no. TM000502), miR-200b (no. TM002251), and miR-200c-3p (no. TM002300) and mRNA expression of miR-200c targets: human ETV5 (Hs00927557_m1), human JAZF1 (Hs00697777_m1), human SNX30 (Hs00 418125_m1), human AQP3 (Hs00185020_m1), and human CBFB (Hs00903431_s1). We used RNU48 (no. TM001006) and RNU44 (no. TM001094) for human miRNAs, while human PPIA (Hs04194521_s1) and human HPRT1 (Hs02800695_m1) were used for normalizing mRNA expression. All TaqMan assays and qPCR reagents were purchased from Thermo Fisher Scientific. Data are presented as relative quantification, describing the change in expression of the gene compared with a control group. Threshold levels of all Ct values were automatically set, and the gene expressions were normalized using the geometric means of two endogenous controls. Relative expressions were calculated with the ΔΔCt method (18).
Western Blot Analysis
Total protein (15 μg/mL EndoC-βH1) extracted at 72 h posttransfection was separated by 4–15% TGX Stain-Free gels (Bio-Rad Laboratories). The gels were then activated with ultraviolet light for 1 min to visualize total protein on the blotted LF PVDF membrane (Bio-Rad Laboratories). Protein was transferred to PVDF membrane with a Trans-Blot Turbo Transfer System (Bio-Rad Laboratories) and then blocked with 5% milk and 1% BSA in a buffer consisting of 150 mmol/L NaCl; 20 mmol/L Tris-HCl, pH 7.5; and 0.1% (v/w) Tween for 1 h. The blot was probed with ETV5 (1:500, no. ab102010; Abcam, Cambridge, U.K.), SYT11 (1:500, no. ab204589; Abcam), VAMP2 (1:1,000, no. ab181869, Abcam), or SNAP25 (1:1,000, no. 111011; Synaptic Systems, Göttingen, Germany) antibody and incubated overnight at 4°C. Horseradish peroxidase (HRP)-conjugated goat anti-rabbit IgG, HRP-linked antibody (1:10,000, no. 7074; Cell Signaling Technology, Danvers, MA), or anti-mouse immunoglobulins/HRP antibody (1:1,000, no. P0448; Dako, Glostrup, Denmark) was used to detect the primary antibodies. Clarity Western ECL Substrate was used for visualization of proteins with a ChemiDoc XRS+ System (Bio-Rad Laboratories). The signal intensity of each protein band was measured with Image Lab software (version 5.2.1; Bio-Rad Laboratories) and normalized to that of the total protein bands in the lane.
Luciferase Assay
Luciferase gene reporter assay was performed in EndoC-βH1 cells. Plasmids carrying the Renilla luciferase gene and the ETV5-3′UTR (ETV5 plasmid: ETV5_3UTR_01, cat. no. 32011, product identifier S813229; Active Motif, Carlsbad CA) or a random 3′UTR control (CON plasmid: cat. no. 32017, product identifier S890001) were cotransfected with pre-miRNAs as described above (pre–miR-scramble and pre–miR-200c-3p). Cells were seeded in 96-well plates, grown to ∼80% confluence overnight, and transfected with Lipofectamine 3000 (Thermo Fisher Scientific). In each well, a total of 100 ng plasmid was cotransfected with pre-miRNA at a concentration of 25 nmol/L. Total transfection time was 24 h, after which the wells were frozen in 100 µL PBS before analysis. Each of the four conditions (CON+SCR, CON+OE200c, ETV5+SCR, and ETV5+OE200c) was transfected in triplicate wells in four independent experiments. Luminescence of the assay was analyzed with the LightSwitch Luciferase Assay Kit (product identifier LS100; Active Motif) according to the manufacturer’s protocol. Luminescence was read at 480 nm on a CLARIOstar microplate reader (BMG Labtech, Ortenburg, Germany).
Human Islet RNA-Sequencing Data Analysis
An mRNA library was prepared from RNA extracted from control human islets (siSCR) and islets in which ETV5 was reduced (siETV5), respectively. Sequencing reads were mapped to the human transcriptome (GENCODE Release 30) and quantified accordingly with Salmon (version 0.14.0) (19). Differential gene expression analysis was performed with DESeq2 (version 1.25.10) (20). We obtained the differentially expressed gene list by comparing siSCR islets against siETV5 islets, in which genes with an adjusted P value <0.1 were considered differentially expressed.
Bioinformatics and Statistical Analysis
Putative targets of miR-200c were identified with the TargetScan prediction tool (https://www.targetscan.org/). Pearson correlation was then performed between expression of identified conserved targets of miR-200c (from published RNA-sequencing [RNA-seq] data [21,22]) and miR-200c expression data from the same donors (N = 47).
Multiple regression models were used to estimate the effect of each condition (T2D, impaired glucose tolerance [IGT] [42 mmol/mol <HbA1c <48 mmol/mol], ND) on the expression of each of the target genes (ETV5, CBFB, SNX30, JAZF1) after controlling for donor age and sex. RNA-seq expression data, published in (21,22), were available in logarithmic scale and used for the analyses.
Experimental data are presented as mean ± SEM, and significant differences between groups were determined with Student t test or ANOVA.
Data and Resource Availability
The data sets generated and/or analyzed during the current study are available from the corresponding author on reasonable request.
Results
miR-200c Expression Is Increased in Human Islets From T2D Donors, and Overexpression of miR-200c Reduces Glucose-Stimulated Insulin Secretion
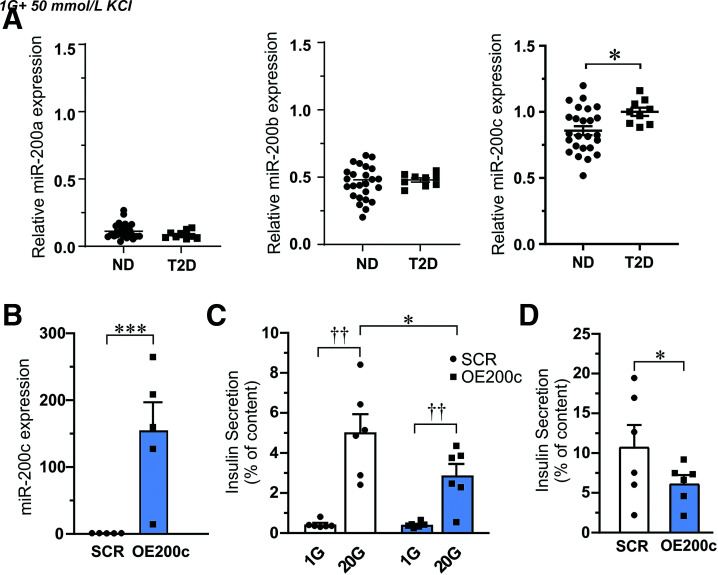
We performed qPCR measurements of miR-200a, miR-200b, and miR-200c expression in handpicked human islets from ND and T2D donors. Interestingly, we found increased expression of miR-200c (P < 0.05) in islets from T2D as compared with ND (Fig. 1A).
Figure 1.
Expression of miR-200c in human islets and effects of miR-200c overexpression on insulin secretion. A: Expression of miR-200a, miR-200b, and miR-200c in islet from ND and T2D donors. Data are presented as mean ± SEM. *P < 0.05 from N = 25 ND and N = 9 T2D donors. B: Expression of miR-200c in EndoC-βH1 β-cells after overexpression of miR-200c (OE200c) compared with scramble control (SCR). C: Insulin released from EndoC-βH1 cells after 1-h stimulation with low glucose (1 mmol/L [1G]) or high glucose (20 mmol/L [20G]). Secretion measurements were proceeded by transfection of cells with control (SCR) and pre–miR-200c (OE200C) plasmids as indicated. D: Depolarization-induced insulin secretion (50 mmol/L K+ for 15 min) in SCR and OE200c EndoC-βH1 β-cells. Data in B–D are presented as mean ± SEM of N = 6 biological replicates. *P < 0.05, ***P < 0.001 vs. SCR and ††P < 0.01 vs. low glucose with use of Student paired t test and ANOVA.
To mimic the effect of upregulation of miR-200c in islets from T2D donors, we overexpressed miR-200c (OE200c) in human EndoC-βH1 cells and compared with control cells (SCR) (Fig. 1B). OE200c decreased glucose-stimulated insulin secretion compared with SCR (Fig. 1C), without any differences in insulin content (data not shown). Likewise, depolarization-induced insulin secretion with 50 mmol/L K+ was reduced in OE200c cells. (Fig 1D).
Transcription Factor ETV5 Is Identified as the Top Rank Target of miR-200c in Human Islets
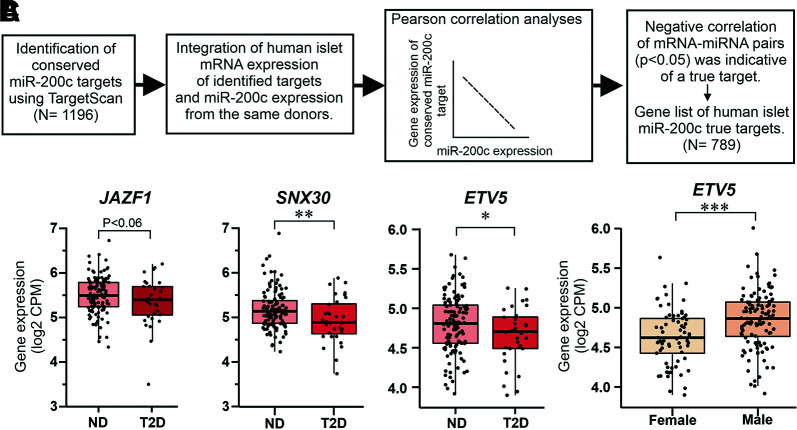
To determine the putative targets through which the miRNA-200c regulate insulin secretion in the β-cell, we followed the workflow in Fig. 2A. We identified ETV5 (ETS variant transcription factor 5) (P < 0.0012) and SNX30 (sorting nexin family member 30) (P < 0.013) to be among the top-ranked conserved targets (Supplementary Table 2). Interesting other targets lower in rank, but previously described to be targets of miR-200c (13,15), were JAZF1 (JAZF zinc finger 1 1), DNAJC3 (DnaJ heat shock protein family [Hsp40] member C3), XIAP (X-linked inhibitor of apoptosis), and ZEB1 (zinc finger E-box binding homeobox 1). For these genes, the expression correlation with miR-200c was negative but did not become significant (P > 0.05).
Figure 2.
Description of the miR-200c target identification process and expression of selected targets in human islets. A: Workflow to identify miR-200c target genes in human islets. B: Gene expression of JAZF1, SNX30, and ETV5 in islets from ND (N = 120) and T2D (N = 32) donors. Note that only data for ND and T2D are shown; results for all conditions investigated (ND, IGT, and T2D) can be found in Supplementary Table 3. C: Gene expression of ETV5 in human islets from female (N = 69) and male (N = 116) donors. Data are presented as mean ± SEM. *P < 0.05, **P < 0.01, ***P < 0.01 vs. ND (B) or males (C) with use of linear model analyses adjusted for sex, age, and condition (ND, IGT, T2D). CPM, counts per million.
We next investigated the expression of JAZF1, SNX30, and ETV5 in islets from ND and T2D donors as well as from those with IGT. Multiple regression models were used to estimate the effect of the conditions (T2D, IGT, ND) for each target after donor sex and age were controlled for. In a total of 185 donors, we found reduced expression of JAZF1, SNX30, and ETV5 in islets from T2D donors (Fig. 2B and Supplementary Table 3). Expression of ETV5 was also lower in female compared with male donors (Fig. 2C).
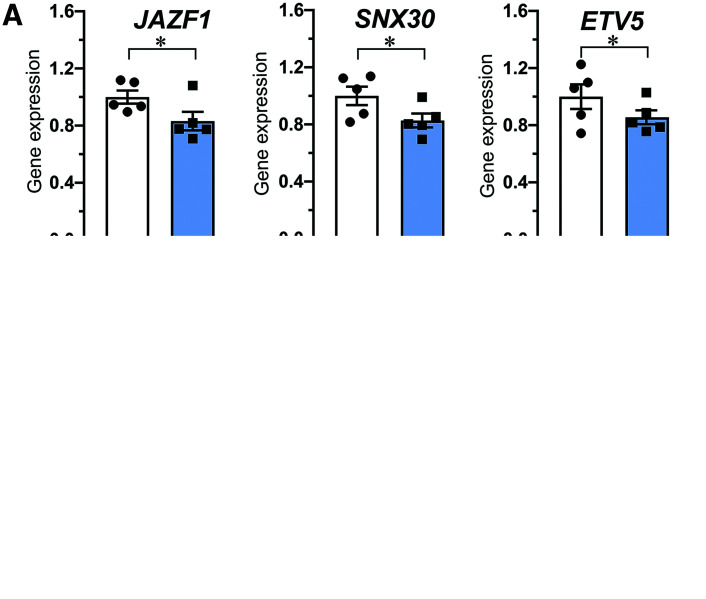
In support of the target results in human islet data we measured reduced expression of JAZF1 and SNX30 in OE200c EndoC-βH1 cells (Fig. 3A) as well as reduced ETV5 gene expression and ETV5 protein level (Fig. 3B–D). We also performed luciferase assay in EndoC-βH1 cells and showed that miR-200c significantly suppresses the expression of a plasmid carrying the ETV5-3′UTR (Fig. 3C). Taken together, qPCR, protein, and luciferase data confirm that the 7meric binding site for miR-200c in ETV5-3′UTR is a true seed site and reduces gene expression.
Figure 3.
Decreased expression of gene targets after miR-200c overexpression and validation of ETV5 as a direct target of miR-200c. A: Gene expression of JAZF1, SNX30, and ETV5 in EndoC-βH1 cells after transfection of cells with control (SCR) and pre–miR-200c (OE200C) as indicated. B: Protein level of ETV5 in EndoC-βH1 cells after transfection as in A. C: Relative luciferase activity in a random 3′UTR control plasmid (CON) and a plasmid with ETV5-3′UTR (ETV5) cotransfected with nontargeting pre-miRNA (SCR) and pre–miRNA-200c (OE200c). Data in B–D are presented as mean ± SEM of N = 4–5 biological replicates. *P < 0.05, ***P < 0.001 vs. SCR with Student paired t test.
Knockdown of ETV5 in Human Islets Reduces Glucose-Stimulated Insulin Secretion
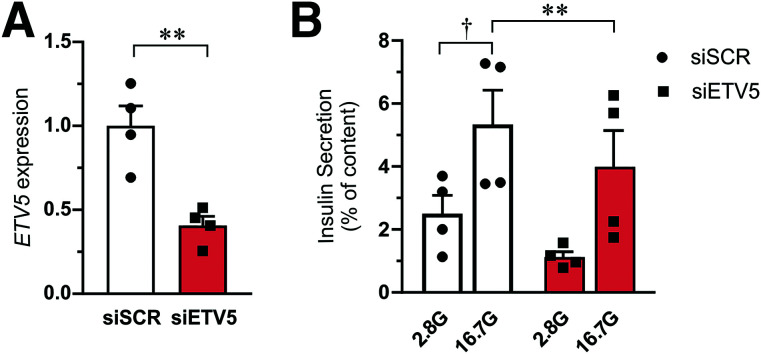
To test whether the effect of miR-200c mediated downregulation of ETV5 on insulin secretion can be recapitulated by direct knockdown of ETV5, we used siRNA against ETV5 (siETV5) in human islets and performed glucose-stimulated insulin secretion (Fig. 4). Insulin secretion stimulated by 16.7 mmol/L glucose was ∼20–30% lower in siETV5-treated human islets as compared with control cells (siSCR).
Figure 4.
Effect of ETV5 on insulin secretion. A: Gene expression of ETV5 in human islets (N = 4 donors) after knockdown of ETV5 (siETV5) as compared with islets transfected with scramble siRNA (siSCR). Expression is normalized to HPRT and PPIA expression. B: Insulin secretion from human islets stimulated with 2.8 mmol/L (2.8G) and 16.7 mmol/L (16.7G) glucose for 1 h. Measurements were performed on islet from the same four donors as in A. Data are presented as mean ± SEM. †P < 0.05, 16.7 mmol/L vs. 2.8 mmol/L glucose; **P < 0.01, siSCR vs. siETV5 with use of ANOVA or paired Student t test.
CBFB Expression Is Regulated by ETV5 and miR-200c
Next, we investigated which genes are regulated by the transcription factor ETV5 in human islets. Recent work on an ETV5 knockout mouse suggested that ETV5 reduces insulin secretion through reduced expression of exocytotic genes (23). In line with these results, our data showed a positive correlation between ETV5 and SNAP25 expression as well as between ETV5 and SYT11 expression in human islets (Supplementary Fig. 1A). Human islets transfected with siETV5 showed lower expression of SNAP25 and SYT11 compared with siSCR control (Supplementary Fig. 1B). However, the reduction in gene expression was not confirmed on a protein level for SNAP25 when investigated in EndoC-βH1 cells after overexpression of miR-200c (Supplementary Fig. 1), which is why we set out to find additional targets of ETV5.
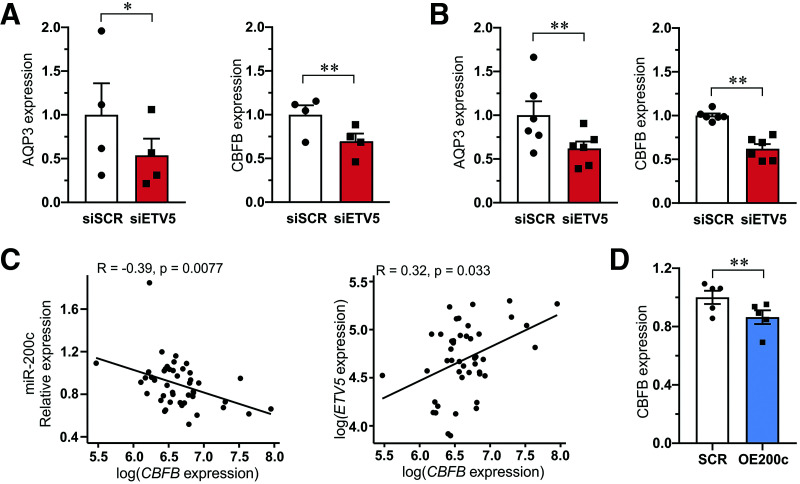
To get a broader overview of potential targets of ETV5, we performed RNA-seq analysis of human islets treated with siETV5 or siSCR. We found 58,434 expressed genes, and 58 genes were significantly differentially expressed (Supplementary Table 4). Among the genes differentially expressed were AQP3 (aquaporin 3) (Padjusted < 2.3E−15), CBFB (core-binding factor subunit β) (Padjusted < 0.00134), KLF13 (Kruppel like factor 13) (Padjusted < 0.00480), PRKD2 (protein kinase D2) (Padjusted < 0.00666), and PLAU (plasminogen activator urokinase) (Padjusted < 0.100), which were selected for validation with qPCR (Fig. 5A and B and Supplementary Fig. 2). Only expression of AQP3 and CBFB was confirmed by qPCR to be reduced in siETV5 human islets and siETV5 EndoC-βH1 cells.
Figure 5.
Validation of top genes regulated by ETV5 and the correlation of CBFB with miR-200c. A and B: Expression of AQP3 and CBFB in siSCR and siETV5 human islets (A) and EndoC-βH1 β-cells (B). Data in A and B are presented as mean ± SEM of four to six experiments. *P < 0.05 and **P < 0.01 siSCR vs. siETV5 with paired Student t test. C: Pearson correlation between miR-200c and CBFB expression in islets from 47 human donors (left) and between ETV5 and CBFB expression in the same donors (right). D: Expression of CFBC in EndoC-βH1 β-cells after transfection with control scramble (SCR) and pre–miR200c (OE200c). Data are presented as mean ± SEM of five biological replicates. **P < 0.01 SCR vs. OE200c using paired Student t test.
We next asked whether miR-200c regulates the expression of CBFB through ETV5 in human islets. Indeed, the expression of CBFB correlated negatively with the expression of miR-200c (Fig. 5C, left) in the smaller cohort of human islets (N = 45) in which we had measured miR-200c expression by qPCR. In this cohort we also found ETV5 expression to positively correlate with CBFB expression (Fig. 5C, right). Moreover, CBFB expression was significantly reduced in EndoC-βH1 cells overexpressing miR-200c (Fig. 5D).
Antagomir miR-200c Improve Glucose-Stimulated Insulin Secretion in Human Islets From T2D Donors
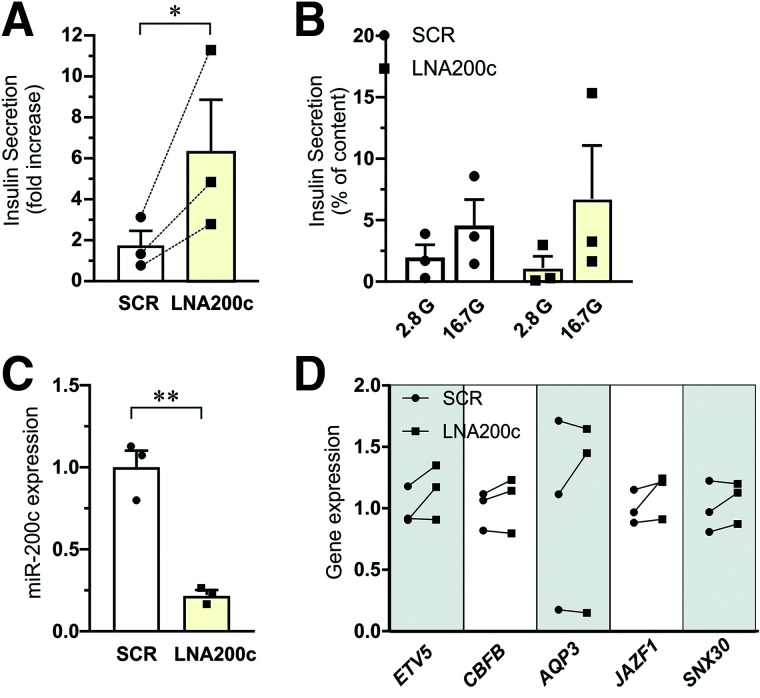
Finally, we examined the possibility of rescuing defective insulin secretion observed in islets from T2D donors using LNA200c. We had access to islets from three donors with T2D. Inhibition of miR-200c by LNA200c significantly increased the fold increase of glucose-stimulated insulin secretion, approximately threefold (Fig. 6A–C). There was a noticeable increase in all three separate experiments. The changes in miR-200c targets expression followed the expected pattern in most donors (Fig. 6D).
Figure 6.
Improvement of insulin secretion by LNA200c in human islets from donors with T2D. Insulin secretion and target gene expression from human T2D donor islets transfected with miRNA inhibitor scramble control (SCR) and miR-200c inhibitor (LNA200c) followed by 1-h incubation at 2.8 mmol/L (2.8G) or 16.7 mmol/L (16.7G) glucose. A: Insulin secretion data expressed as fold increase (16.7 glucose vs. 2.8 glucose). Data are presented as mean ± SEM of N = 3 donors. *P < 0.05 SCR vs. control. The dotted lines in the graph indicate trajectories between SCR and LNA200c of individual donors. B: Insulin secretion data as in A expressed as percentage of insulin content and presented for 2.8 mmol/L and 16.7 mmol/L glucose for SCR and LNA200c islets. Data are presented as mean ± SEM of N = 3 donors. C: Expression of miR-200c after transfection with miRNA inhibitor scramble control (SCR) and miR-200c inhibitor (LNA200c) for 72 h. D: Gene expression of ETV5, CBFB, AQP3, JAZF1, and SNX30 in islets from the same T2D donors as in A–C. Data are expressed as mean ± SEM of N = 3 donors. **P < 0.01,*P < 0.05, SCR vs. LNA200c.
Discussion
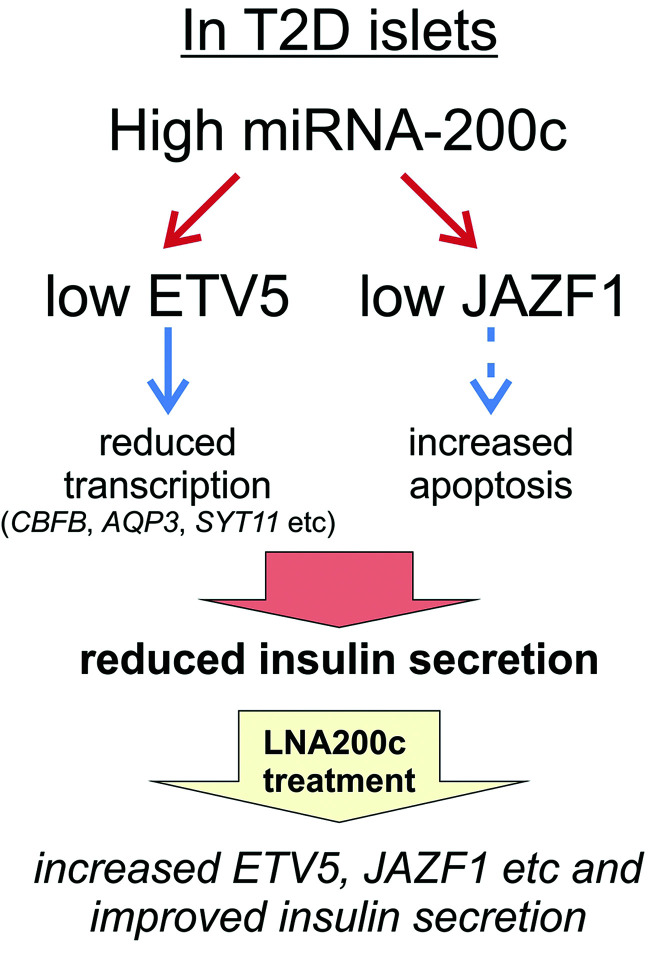
In this study we have identified miR-200c as an miRNA differentially upregulated in human islets from T2D donors. Moreover, we identified ETV5 as an interesting novel target of miR-200c in human islets, together with the identification of previous targets validated in rodent models such as JAZF1. Both increased expression of miR-200c and reduced expression of ETV5 led to reduced glucose-stimulated insulin secretion, a key phenotype of T2D patients. ETV5 is a transcription factor, and through RNA-seq experiments we identified CBFB to be regulated by ETV5 in human islets. Previous work has suggested that miR-200c mainly affects apoptosis. Here we show a novel route by which miR-200c also effects insulin secretion per se, and we put forward a model including these multiple roles of miR-200c to explain how increased levels of miR-200c in islets are part of the pathogenesis of T2D (Fig. 7). Finally, we were able to therapeutically increase insulin secretion in islets from T2D donors using LNA200c.
Figure 7.
A schematic model on how miR-200c can regulate the expression of several genes and how an increased expression of miR-200c in T2D can result in reduced expression of, e.g., ETV5 and JAZF1 and thus impaired insulin secretion. We further suggest that LNA-200c treatment can improve insulin secretion in T2D islets. See text for more details. Dotted line: result of previous study in mice (15,32).
MiRNAs within the miR-200 family are highly expressed in islets of Langerhans (7). This is the first study that shows differential expression of miR-200c in human islets from ND and T2D donors. There was no change in expression of either miR-200a or miR-200b (Fig. 1A). It is obvious from the data that miR-200c is the most abundant among the three, and this might be the reason why we only observed changes in expression of this miRNA in the donors investigated. We identified the novel miR-200c target ETV5 through a method combining miRNA and mRNA expression data in islets from the same human donors and confirmed changes in ETV5 protein levels after overexpression of miR-200c in the human β-cell line EndoC-βH1. The latter data preferably should have been performed in human islets, or even sorted human β-cells, but the limitation of human material and the ethical aspects of using the human islets wisely led us to perform some of the experiments in the human β-cell line.
We identified a novel target of miR-200c in ETV5. ETV5 is a member of the PEA3 (polyomavirus enhancer activator 3) group of the 28 member ETS family (24,25). ETS family transcription factors share a unique ETS DNA binding domain and can either activate or repress several genes to affect many cellular processes (24,26). In the field of diabetes, previous work showed a strong link between ETV5 and human obesity in different populations according to genome-wide association studies (27,28). Moreover, ETV5 knockout mice have impaired insulin release and ETV5 knockdown in insulin-secreting β-cells reduces insulin exocytosis via reduction of the exocytotic proteins Syt9 and Snap25 (23). Here, we show reduced glucose-stimulated insulin release also in human islets after reducing the expression of ETV5. We can confirm a relationship between ETV5 expression and the expression of exocytotic genes in human islets through the identified positive correlation of ETV5 with both SNAP25 and VAMP2 expression. However, only protein levels of SYT11 were reduced after overexpression of miR-200c in EndoC-βH1. Whether this is because the Western blot was performed in EndoC-βH1 and not in human islets or because the overexpression was not enough to reduce the level of SNAP25 protein could be discussed. In all, our data only partly support regulation of exocytosis via SNAP25 by ETV5 and miR-200c. Our RNA-seq analysis of human islets after knockdown of ETV5 instead identified CBFB as one of the top candidates to be regulated by ETV5. CBFB has to our knowledge never been discussed as a regulator of β-cell function. CBFB is demonstrated to be a coactivator and part of the CBF (core binding factor) complex together with RUNX transcription factors. Previous work in other tissues has suggested a role for this complex in differentiation, survival, and growth (29). This route is more in line with previous work on miR-200c targets JazF1 and Zeb1. Their reduced expression has been demonstrated to increase apoptosis (13,15); moreover, Zeb1 regulates epithelial-to-mesenchymal transition and differentiation (14). Further studies are needed to elucidate the exact molecular role of CBFB in human islets and any functional implication on insulin secretion. However, our studies suggest that the reduced insulin secretion observed upon miR-200c overexpression most likely is due to reduced expression of ETV5 and thereby reduced expression of CBFB.
Jazf1 is a target of miR-200c identified in a mouse knockout model (15). In our study we confirmed this finding in human islets and in EndoC-βH1 insulin-secreting cells. This target is highly interesting from a diabetes perspective. First, polymorphism in or near the gene transcribing JAZF1 is associated with increased risk of T2D (30,31). Secondly, it was recently shown that knockdown of JazF1 in mice causes increased endoplasmic reticulum stress and thereby increased susceptibility to β-cell apoptosis (32). T2D is most likely a combination of defect β-cell function and reduced β-cell mass (2,3). Here we have focused mainly on the role of miR-200c in insulin secretion, but interesting future experiments would also include apoptosis measurements and measurements of β-cell differentiation in human islets.
miR-200c is one of the more abundant islet miRNAs and is likely to regulate several important β-cell signaling pathways. Indeed, we found that overexpression of this miRNA regulates the expression of several key genes in the pancreatic β-cells, not only previously described rodent targets such as JAZF1, DNAJC3, XIAP, and ZEB1, but also the novel conserved target ETV5, with a role in the regulation of glucose-stimulated insulin secretion. The multiple regulatory roles of a single miRNA make them unique in their capacity to coordinate a network of genes that need to change their expression simultaneously. Network descriptions of the role of miRNAs also suggest that single gene targets can be regulated by multiple miRNAs (5). In such a scenario, ETV5 expression is regulated not only by miR-200c but also by other miRNAs. Although we have not specifically investigated this possibility here, it points to the complexity of miRNA-mRNA networks (5) where we need other more bioinformatics studies to get full understanding. Our data resolve a minor piece of this network, and we suggest that miR-200c is one of the miRNAs in the β-cell that has the potential to act as the kapellmeister of an important coordinated β-cell gene expression network. Accordingly, increased expression of islet miR-200c in T2D will ultimately reduce β-cell mass as well as impair insulin secretion.
We show that inhibition of miR-200c by LNA200c increased insulin secretion in islets from T2D donors. Unfortunately, we only had access to three donors for this experiment. However, the fold increase was significant and there was a positive trend in all three experiments. Hence, we suggest LNA200c as a potential therapeutic tool in treatment of dysfunctional insulin secretion in T2D. Much is needed before LNA200c can be used in the clinic, but other miRNAs have improved insulin secretion when injected into mice (see, e.g., 8). A natural next step would therefore be to inject LNA200c in a diabetic animal model to confirm improved insulin secretion and lowered blood glucose.
In conclusion, this study has put forward increased miR-200c expression as a potential factor contributing to reduced insulin secretion in T2D. Based on our data in human islets from donors with T2D, we suggest LNA200c as a potential pharmacological tool to improve insulin secretion.
Article Information
Acknowledgments. The authors thank Anna-Maria Veljanovska Ramsay and Britt-Marie Nilsson at the Department of Clinical Sciences Malmö for technical assistance.
Funding. This work is supported by a grant from the Swedish Foundation for Strategic Research (IRC-LUDC; IRC15-0067) and the Swedish Research Council through an SRA grant SFO-EXODIAB (2009-1039). L.E. has support for this project through project grants from the Swedish Research Council (2019-01406), Region Skåne-ALF, the Swedish Diabetes Foundation (DIA2019-454), the Diabetes Wellness Network Sweden, and the European Foundation for the Study of Diabetes (EFSD) - Merck, Sharp and Dome (MSD) program. J.K.O. is supported by the Royal Physiographic Society of Lund through Birgit and Hellmuth Hertz Foundation. E.W. is supported by Cystic Fibrosis Trust (SRC019-CFRD).
Duality of Interest. No potential conflicts of interest relevant to this article were reported.
Author Contributions. L.E. supervised the project. J.K.O. and L.E. designed experiments. J.K.O., A.K., M.N., E.W., S.R., A.W., and J.L.S.E. performed experiments. A.K., J.L.S.E., and L.E. designed and analyzed RNA-seq data. J.K.O., A.K., M.N., E.W., S.R., A.W., J.L.S.E., and L.E. analyzed data. J.K.O. and L.E. wrote the manuscript. All authors reviewed and edited the manuscript and approved the final version of the manuscript. L.E. is the guarantor of this work and, as such, had full access to all the data in the study and takes responsibility for the integrity of the data and the accuracy of the data analysis.
Footnotes
J.K.O. is currently affiliated with Unit of Epigenetics and Diabetes, Lund University Diabetes Centre, Department of Clinical Sciences Malmö, Clinical Research Centre, Lund University, and Skåne University Hospital, Malmö, Sweden.
M.N. is currently affiliated with Department of Endocrinology, Diabetes and Metabolism, Graduate School of Medicine, Nippon Medical School, Tokyo, Japan.
This article contains supplementary material online at https://doi.org/10.2337/figshare.16903927.
References
- 1. Halban PA, Polonsky KS, Bowden DW, et al. β-Cell failure in type 2 diabetes: postulated mechanisms and prospects for prevention and treatment. J Clin Endocrinol Metab 2014;99:1983–1992 [DOI] [PMC free article] [PubMed] [Google Scholar]
- 2. Holman RR, Clark A, Rorsman P. β-Cell secretory dysfunction: a key cause of type 2 diabetes. Lancet Diabetes Endocrinol 2020;8:370. [DOI] [PubMed] [Google Scholar]
- 3. Meier JJ, Bonadonna RC. Role of reduced β-cell mass versus impaired β-cell function in the pathogenesis of type 2 diabetes. Diabetes Care 2013;36(Suppl. 2):S113–S119 [DOI] [PMC free article] [PubMed] [Google Scholar]
- 4. Bartel DP. Metazoan microRNAs. Cell 2018;173:20–51 [DOI] [PMC free article] [PubMed] [Google Scholar]
- 5. Eliasson L, Esguerra JLS. MicroRNA networks in pancreatic islet cells: normal function and type 2 diabetes. Diabetes 2020;69:804–812 [DOI] [PMC free article] [PubMed] [Google Scholar]
- 6. Eliasson L, Regazzi R. Micro(RNA) management and mismanagement of the islet. J Mol Biol 2020;432:1419–1428 [DOI] [PubMed] [Google Scholar]
- 7. LaPierre MP, Stoffel M. MicroRNAs as stress regulators in pancreatic beta cells and diabetes. Mol Metab 2017;6:1010–1023 [DOI] [PMC free article] [PubMed] [Google Scholar]
- 8. Bijkerk R, Esguerra JLS, Ellenbroek JH, et al. In vivo silencing of microRNA-132 reduces blood glucose and improves insulin secretion. Nucleic Acid Ther 2019;29:67–72 [DOI] [PubMed] [Google Scholar]
- 9. Hanna J, Hossain GS, Kocerha J. The potential for microRNA therapeutics and clinical research. Front Genet 2019;10:478. [DOI] [PMC free article] [PubMed] [Google Scholar]
- 10. Elmén J, Thonberg H, Ljungberg K, et al. Locked nucleic acid (LNA) mediated improvements in siRNA stability and functionality. Nucleic Acids Res 2005;33:439–447 [DOI] [PMC free article] [PubMed] [Google Scholar]
- 11. Bartel DP. MicroRNAs: target recognition and regulatory functions. Cell 2009;136:215–233 [DOI] [PMC free article] [PubMed] [Google Scholar]
- 12. Klein D, Misawa R, Bravo-Egana V, et al. MicroRNA expression in alpha and beta cells of human pancreatic islets. PLoS One 2013;8:e55064. [DOI] [PMC free article] [PubMed] [Google Scholar]
- 13. Filios SR, Xu G, Chen J, Hong K, Jing G, Shalev A. MicroRNA-200 is induced by thioredoxin-interacting protein and regulates Zeb1 protein signaling and beta cell apoptosis. J Biol Chem 2014;289:36275–36283 [DOI] [PMC free article] [PubMed] [Google Scholar]
- 14. Title AC, Silva PN, Godbersen S, Hasenöhrl L, Stoffel M. The miR-200-Zeb1 axis regulates key aspects of β-cell function and survival in vivo. Mol Metab 2021;53:101267. [DOI] [PMC free article] [PubMed] [Google Scholar]
- 15. Belgardt BF, Ahmed K, Spranger M, et al. The microRNA-200 family regulates pancreatic beta cell survival in type 2 diabetes. Nat Med 2015;21:619–627 [DOI] [PubMed] [Google Scholar]
- 16. Andersson SA, Olsson AH, Esguerra JL, et al. Reduced insulin secretion correlates with decreased expression of exocytotic genes in pancreatic islets from patients with type 2 diabetes. Mol Cell Endocrinol 2012;364:36–45 [DOI] [PubMed] [Google Scholar]
- 17. Ravassard P, Hazhouz Y, Pechberty S, et al. A genetically engineered human pancreatic β cell line exhibiting glucose-inducible insulin secretion. J Clin Invest 2011;121:3589–3597 [DOI] [PMC free article] [PubMed] [Google Scholar]
- 18. Livak KJ, Schmittgen TD. Analysis of relative gene expression data using real-time quantitative PCR and the 2(-delta delta C(T)) method. Methods 2001;25:402–408 [DOI] [PubMed] [Google Scholar]
- 19. Patro R, Duggal G, Love MI, Irizarry RA, Kingsford C. Salmon provides fast and bias-aware quantification of transcript expression. Nat Methods 2017;14:417–419 [DOI] [PMC free article] [PubMed] [Google Scholar]
- 20. Love MI, Huber W, Anders S. Moderated estimation of fold change and dispersion for RNA-seq data with DESeq2. Genome Biol 2014;15:550. [DOI] [PMC free article] [PubMed] [Google Scholar]
- 21. Fadista J, Vikman P, Laakso EO, et al. Global genomic and transcriptomic analysis of human pancreatic islets reveals novel genes influencing glucose metabolism. Proc Natl Acad Sci USA 2014;111:13924–13929 [DOI] [PMC free article] [PubMed] [Google Scholar]
- 22. Gandasi NR, Yin P, Omar-Hmeadi M, Ottosson Laakso E, Vikman P, Barg S. Glucose-dependent granule docking limits insulin secretion and is decreased in human type 2 diabetes. Cell Metab 2018;27:470–478.e4 [DOI] [PubMed] [Google Scholar]
- 23. Gutierrez-Aguilar R, Kim DH, Casimir M, et al. The role of the transcription factor ETV5 in insulin exocytosis. Diabetologia 2014;57:383–391 [DOI] [PMC free article] [PubMed] [Google Scholar]
- 24. Chen C, Ouyang W, Grigura V, et al. ERM is required for transcriptional control of the spermatogonial stem cell niche. Nature 2005;436:1030–1034 [DOI] [PMC free article] [PubMed] [Google Scholar]
- 25. Lu BC, Cebrian C, Chi X, et al. Etv4 and Etv5 are required downstream of GDNF and Ret for kidney branching morphogenesis. Nat Genet 2009;41:1295–1302 [DOI] [PMC free article] [PubMed] [Google Scholar]
- 26. Sharrocks AD. The ETS-domain transcription factor family. Nat Rev Mol Cell Biol 2001;2:827–837 [DOI] [PubMed] [Google Scholar]
- 27. Thorleifsson G, Walters GB, Gudbjartsson DF, et al. Genome-wide association yields new sequence variants at seven loci that associate with measures of obesity. Nat Genet 2009;41:18–24 [DOI] [PubMed] [Google Scholar]
- 28. Willer CJ, Speliotes EK, Loos RJ, et al.; Wellcome Trust Case Control Consortium; Genetic Investigation of ANthropometric Traits Consortium . Six new loci associated with body mass index highlight a neuronal influence on body weight regulation. Nat Genet 2009;41:25–34 [DOI] [PMC free article] [PubMed] [Google Scholar]
- 29. Blyth K, Cameron ER, Neil JC. The RUNX genes: gain or loss of function in cancer. Nat Rev Cancer 2005;5:376–387 [DOI] [PubMed] [Google Scholar]
- 30. Grarup N, Andersen G, Krarup NT, et al. Association testing of novel type 2 diabetes risk alleles in the JAZF1, CDC123/CAMK1D, TSPAN8, THADA, ADAMTS9, and NOTCH2 loci with insulin release, insulin sensitivity, and obesity in a population-based sample of 4,516 glucose-tolerant middle-aged Danes. Diabetes 2008;57:2534–2540 [DOI] [PMC free article] [PubMed] [Google Scholar]
- 31. Zeggini E, Scott LJ, Saxena R, et al.; Wellcome Trust Case Control Consortium . Meta-analysis of genome-wide association data and large-scale replication identifies additional susceptibility loci for type 2 diabetes. Nat Genet 2008;40:638–645 [DOI] [PMC free article] [PubMed] [Google Scholar]
- 32. Kobiita A, Godbersen S, Araldi E, et al. The diabetes gene JAZF1 is essential for the homeostatic control of ribosome biogenesis and function in metabolic stress. Cell Rep 2020;32:107846. [DOI] [PubMed] [Google Scholar]


