

Abstract
ANKASCIN 568-R is an extract derived from red mold rice (RMR) fermented using Monascus purpureus NTU 568. RMR fermented using M. purpureus NTU 568 prevents cardiovascular diseases and decreases blood lipid levels. This study evaluates the safety of ANKASCIN 568-R, since it has not determined yet. After daily oral ANKASCIN 568-R for 13 consecutive weeks, we evaluated the toxicity tolerance of Sprague-Dawley rats and performed dose formulation analysis on monascin and ankaflavin. The dose formulation analysis showed that ANKASCIN 568-R concentrations were lower than the target concentration and out of range ( ± 15%) at week 8 and on the last dosing day for both monascin (all dose groups) and ankaflavin at the 100 mg/kg dose. The lowest reported concentrations for the low, middle, and high dose formulations were 34.7, 115.2, and 398.1 mg/mL, respectively. We also evaluated the genotoxicity of ANKASCIN 568-R and showed no genotoxicity potential at all ANKASCIN 568-R doses investigated. The no observed adverse effect level of ANKASCIN 568-R was determined to be 796.2 mg/kg/day. This study revealed the first toxicity evaluation data of ANKASICN 568-R, and the data demonstrated ANKASICN 568-R was safe and can be used in daily life.
Abbreviations: AK, ankaflavin; CHO, Chinese hamster ovary; MS, monascin; NOAEL, no observed adverse effect level; RMR, red mold rice; SD, Sprague Dawley
Keywords: ANKASCIN 568-R, Monascus purpureus NTU 568, 13-week oral toxicity, Genotoxicity, Monascin, Ankaflavin
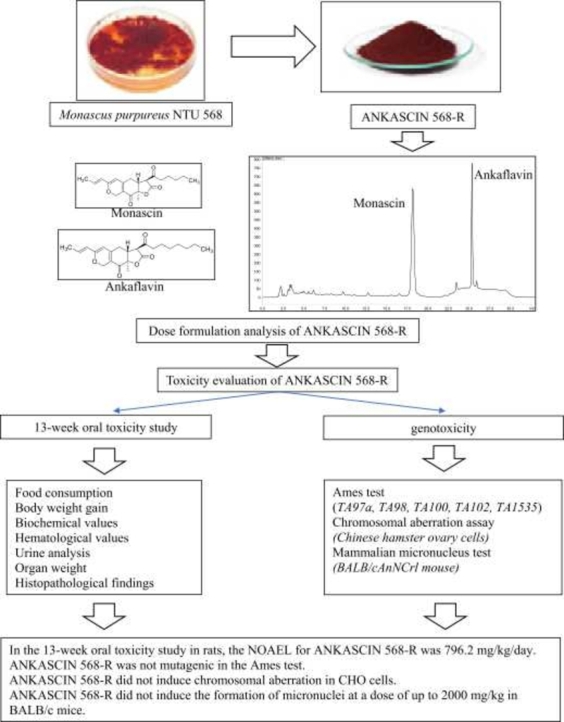
Graphical Abstract
Highlights
-
•
The non-observed-adverse-effect level for ANKASCIN 568-R was 796.2 mg/kg/day.
-
•
ANKASCIN 568-R showed no toxic effects in the 13-week oral toxicity study.
-
•
No genotoxicity markers were observed at all ANKASCIN 568-R doses tested.
-
•
ANKASCIN 568-R did not induce chromosomal aberration in CHO cells.
1. Introduction
Fermented foods have been used in East Asian countries, one of which is red mold rice (RMR), produced by the fermentation of rice using Monascus purpureus. [1].
RMR exhibits various biological activities, such as hypolipidemic, antiatherosclerotic, anticancer, neurocytoprotective, hepatoprotective, antiosteoporotic, antifatigue, antidiabetic, antiobesity, immunomodulatory, anti-inflammatory, antihypertensive, and antimicrobial activities. [2].
The extracts and isolated components of M. purpureus include monacolins, pigments, monascus polysaccharides, flavonoids, and terpenoids, however, only few have potential bioactivity. [2], [3].
The Monascus-fermented metabolite, monacolin K, known as lovastatin, is widely used for the treatment of hypercholesterolemia. However, owing to its side effects and low tolerance, developing new hypolipidemic compounds from Monascus-fermented products is desirable. [4], [5].
RMR fermentation using M. purpureus NTU 568 is superior to that of traditional fermentation methods [6], and has been shown to have better effects on hyperlipidemia [7], type 2 diabetes [8], and neurodegenerative diseases [9].
In addition, we have previously shown that monascin (MS) and ankaflavin (AK), produced by M. purpureus NTU 568, exhibit excellent hypolipidemic effects. By reducing low-density lipoprotein cholesterol and increasing high-density lipoprotein cholesterol contents, MS and AK can regulate blood lipid levels [4], [10], and may therefore serve as novel and potent hypolipidemic agents.
Previous studies have evaluated the safety of RMR fermented by M. purpureus NTU 568 via in vivo 28-day and 90-day oral toxicity tests [6], [11]. Despite the bioactive potential and safety of M. purpureus NTU 568 RMR, no studies on the toxicity potential of ANKASCIN 568-R have been conducted. Therefore, in this study, we evaluate the safety of ANKASCIN 568-R. The no observed adverse effect level (NOAEL) for ANKASCIN 568-R is also determined.
2. Materials and methods
2.1. Study design
According to the Organization for Economic Co-operation and Development (OECD) Guideline 408 [12], we performed a 13-week chronic toxicity test. The study protocol was approved by the Institutional Animal Care and Use Committee (IACUC) (approval number is CTPS-11–010–09).
2.2. Chemicals
Rats were fed corn oil (Sigma-Aldrich, St. Louis, MO, USA) and laboratory autoclavable rodent diet 5010 (PMI® Nutrition International, Inc., St. Louis, MO, USA). For the Ame test, sodium azide, mitomycin C, cyclophosphamide, acridine mutagen ICR 191, 2-nitrofluorene, 2-aminofluorene, and 2-aminoanthracene were used as positive controls (Sigma-Aldrich), while the test sample were prepared with dimethyl sulfoxide (DMSO) (Merck, Hessen, Darmstadt, Germany).
2.3. Cultures
The test strains used in the Ames test, were Salmonella Typhimurium TA98, TA102, TA1535, and TA1537, purchased from Molecular Toxicology Inc. (Boone, NC, USA), except for TA100 which was purchased from the Culture Collection and Research Center, Food Industry Development Institute (Hsin-Chu, Taiwan). Chinese hamster ovary (CHO-K1) cells were used in chromosome aberration assay, supplied from American Type Culture Collection (Rockville, MD, USA).
2.4. ANKASCIN 568-R production
The test sample, ANKASCIN 568-R, was kindly provided by SunWay Biotech Co., Ltd. [Taipei, Taiwan. Batch/Lot No. A002842013012401; physical appearance: red powder; water solubility: slightly soluble; ingredient: red mold fermentation product extract (strain: M. purpureus NTU 568); contains monascin (MS): 41.61 mg/g; ankaflavin (AK): 21.65 mg/g].
2.5. Animals
For the oral toxicity test, we used the Crl:CD Sprague Dawley (SD) rats (approximately 6–7 weeks old), supplied from BioLASCO Taiwan Co., Ltd. (Taipei, Taiwan). The rats body weights were 182–231 g for males and 144–184 g for females before the oral toxicity test. A total of 48 males and 48 females were selected in the experiments and sacrificed after study completion.
For the micronucleus assay, we used BALB/cAnNCrl mice supplied by BioLASCO Taiwan Co., Ltd. The mice were approximately 6 weeks old weighing 21.1–23.4 g for males before testing. A total of 25 male mice were used and sacrificed after study completion.
2.6. Conditions of housing and diet
Animals were housed individually in polycarbonate cages, with 12-hour light/dark cycle and temperature and relative humidity were 21 ± 2 °C and 50 ± 20%, respectively. Laboratory autoclavable rodent diet 5010 was autoclaved and supplied ad libitum throughout the study period. The nutrients analysis is supplied by the manufacturer.
2.7. Dose formulation analysis
On the first dosing day, interim time point (Week 8), and final day (last dosing day), the homogeneity and concentrations of the dose formulations were verified. For homogeneity verification, 1 mL of each sample was collected while the dose formulations were stirring. Homogeneity verification of samples were identified by collecting the top, middle, and bottom layers of the low and high dose formulations. For concentration verification, we collected the middle layer of the sample for all formulations. Each sample was placed into a 15-mL centrifuge tube and stored between − 15 to − 25 °C. The homogeneity and concentrations of the dose formulations were determined by SunWay Biotech Co., Ltd. (Taipei, Taiwan) through MS and AK analysis. If the actual concentration was within 15% of the target concentration, the result of concentrations were acceptable. Results for homogeneity analysis were acceptable if the coefficient of variation of the mean of the average top, middle, and bottom concentrations was ≤ 15%.
2.8. 13-week oral toxicity test
Male and female SD rats were randomized into four treatment groups (12 animals/sex/group; 0, 100, 300, and 1000 mg/kg of ANKASCIN 568-R) and given a daily oral 2 mL/kg dose of the appropriate material, which was prepared in corn oil, for 13 consecutive weeks [13], [14], [15]. The negative control group received the same volume of corn oil with no addition of ANKASCIN 568-R. The test material was suspended in corn oil to obtain 50, 150 and 500 mg/mL concentrations and continuously stirred prior to the preparation of the dose formulations. All animals and food consumption were weighed weekly, and the animals underwent an ophthalmologic examination performed by the study veterinarian during the acclimation period and at the end of the study. On the final day, all surviving animals were randomized, weighed, and anesthetized via carbon dioxide exposure and were exsanguinated and necropsied. After the 13-week oral toxicity test period, blood and urine samples were collected. Blood samples were collected for hematology (RBCs, red blood cells; WBCs, white blood cells; NEUT, neutrophil; LYMPH, lymphocyte; MONO, monocyte; EOS, eosinophil; BASO, basophil; HGB, hemoglobin; HCT, hematocrit; MCV, mean corpuscular volume; MCH, mean corpuscular hemoglobin; MCHC, mean corpuscular hemoglobin concentration; PLT, platelet), coagulation (PT, prothrombin time; APTT, activated partial thromboplastin time) and clinical chemistry parameter (ALP, alkaline phosphatase; ALT, alanine aminotransferase; AST, aspartate aminotransferase; γ-GT, γ-glutamyl transferase; GLU, glucose; T-BIL, total bilirubin; D-BIL, direct bilirubin; CRE, creatinine; BUN, blood urea nitrogen; TP, total protein; ALB, albumin; Na, sodium; K, potassium; Cl, chloride; Ca, calcium; P, phosphorus; CHO, cholesterol; TG, triglycerides; LDH, lactate dehydrogenase; CPK, creatine phosphokinase; UA, uric acid; A/G ratio, albumin/globulin ratio) analyses. Parameters assessed by urinalysis included volume, specific gravity, pH value, urobilinogen levels, appearance, glucose levels, bilirubin levels, ketone levels, protein levels, nitrite levels, blood pressure, and sediment composition. In addition, organ weight measurements (kidneys, liver, testes, brain, heart, spleen, ovaries, adrenals, and thymus), and gross pathological and histopathological examinations were conducted.
2.9. Genotoxicity tests
2.9.1. Ames test
In the Ame test, there were five histidine-requiring S. typhimurium strains. In with and without metabolic activation system (S9), we used ANKASCIN 568-R to induce the tester strains. According to the OECD Guideline 471[16], the maximum dose level for non-cytotoxic substances is 5 mg/plate. The results of the preliminary toxicity test showed that ANKASCIN 568-R was not cytotoxic and induced no precipitation in TA98 and TA100 at a concentration up to 5000 μg/plate without S9. Therefore, the highest dose was determined at 5000 μg/plate of the test material for the Ames test. ANKASCIN 568-R was prepared to 50 mg/mL in DMSO, and then vortexed and centrifuged at 1000 rpm (DuPont Sorvall RT 6000D) for 5 min. After centrifuging, the supernatant was diluted with DMSO to 0.5, 1.5, 5, and 15 mg/mL. We selected the dose at 50, 150, 500, 1500, 5000 μg/plate in both with and without S9, and negative and positive controls were prepared with the same conditions. In cytotoxicity test, the tester strains TA102 and TA1537 were used to observe the cytotoxicity at doses of 500, 1500, 5000 μg/plate without S9. To obtain three analyzable dose levels, the two lower doses (5 and 15 μg/plate) of the test material in these two test strains were tested again. We used 5, 15, 50, 150, and 500 μg/plate without S9 activation for test using TA102 and TA1537.
2.9.2. Chromosomal aberration test
Concentration selection for the chromosome aberration assay was conducted based on the cytotoxicity and solubility results of the preliminary tests. The OECD guideline 473 [17] recommended maximum dose level for non-cytotoxic substances of 5 mg/mL. The highest concentration for the chromosome aberration should produce a cytotoxicity level greater than 50% (IC50); a minimum of three analyzable concentrations is required for a valid test. According to the preliminary test, the maximum concentration used was 1500 μg/mL for the 3 h treatment in the without S9, and 500 μg/mL for the 3 h and 20 h treatments with and without of S9, respectively. On the day of treatment without S9, the test material was freshly prepared with DMSO to 150 mg/mL, vortexed, and centrifuged at 1000 rpm (DuPont Sorvall RT 6000D) for 5 min. The supernatant was collected and diluted with DMSO to 0.5, 1.5, 5, 15, and 50 mg/mL; on the day of treatment with S9, a supernatant solution at 50 mg/mL was prepared using DMSO and then vortexed and centrifuged at 1000 rpm (DuPont Sorvall RT 6000D) for 5 min. The supernatant was filtrated and diluted using DMSO to 0.5, 1.5, 5, and 15 mg/mL followed by the addition of the culture medium at a 1:100 (v/v) ratio to obtain the required final concentrations. The chromosome aberration assay was performed using three treatment schemes (Table 1). In schemes I and III, the exposure times were 3 h and 20 h without S9, respectively. We dissolved the test material in DMSO and prepared 0, 15, 50, 150, 500, and 1500 μg/mL treatment dosages. Meanwhile, in scheme II, the exposure times were 3 h with S9. The test material was prepared with DMSO at 0, 15, 50, 150, and 500 μg/mL. The mitomycin C at 0.33 μg/mL was used for 3 h and 0.2 μg/mL for 20 h in positive controls, respectively, without S9. The Cyclophosphamide at 11.2 μg/mL was then added for 3 h with S9. One percent (v/v) DMSO in medium was used as the negative control. Each control group was included in each test scheme.
Table 1.
ANKASCIN 568-R concentrations used in each treatment scheme of the chromosomal aberration test.
| Treatment scheme | Treatment condition | ANKASCIN 568-R concentration (μg/mL) |
|---|---|---|
| I | -S9, 3 h | 0, 15, 50, 150, 500, 1500 |
| II | +S9, 3 h | 0, 15, 50, 150, 500 |
| III | -S9, 20 h | 0, 15, 50, 150, 500 |
2.9.3. Micronucleus assay
According to the OECD Guideline 474 [18], we designed a study for ANKASCIN 568-R determine its maximum tolerated dose. The dose level of 2000 mg/kg was selected in the BALB/c mice study. We found no toxic effects during the 5-day observation period. According to the preliminary dose-range finding test, the maximum doses were set at 500 mg/kg, 1000 mg/kg, and 2000 mg/kg. All test groups included negative and positive controls, and only male mice were used for the test. For 3 consecutive days, each animal group was fed the test material; the positive control mice received mitomycin C at 1 mg/kg administered once on the third dosing day. Approximately 48 h after the last test material administration, blood was collected from each animal via tail trimming. For determining reticulocytes, the collected blood samples were analyzed under an optical microscope, and micronuclei was determined using a fluorescence microscope. Using 400X magnification, areas of acceptable quality with well spread and stained cells were selected. Two thousand reticulocytes (RETs, 1000 RETs for each slide) were scored under a fluorescence microscope for the presence of micronuclei (MN). Reticulocyte percentages were measured using a flow cytometer (BD FACScan flow cytometer, BD Biosciences, Franklin, NJ, USA).
2.10. Statistical analysis
All statistical analyses were performed using the SigmaStat™ statistical software version 3.0 for Windows™ (Jandel Scientific Inc., San Rafael, CA, USA). When the results of the equal variance test showed data homogeneity, a one-way analysis of variance (ANOVA) was performed. Dunnett’s test was used to compare the treated and control groups when the one-way ANOVA was significant. Analysis was performed separately for each sex. We analyzed the body weights, organ weights (absolute and relative to body and brain weights), food consumption, clinical pathology parameters (except urinalysis) for homogeneity of variance (equal variance test). In order to analyze frequencies of micronucleated reticulocytes, we used the U-test (Mann-Whitney rank sum test) for the treatment group and negative control group (p < 0.05).
3. Results
3.1. 13-Week toxicity study
3.1.1. Dose formulation analysis
The concentrations of MS and AK were determined in the dose formulation analysis shown in Tables 2A and 2B. Neither MS nor AK was detected in vehicle samples. For MS, the differences between the actual mean value and the targeted concentrations on the first dosing day were − 3.19%, − 0.01%, and − 3.63% for the 50, 150, and 500 mg/mL doses, respectively. In addition, data for the interim time point (week 8) suggested differences of − 10.55%, − 8.92%, and − 6.04% for the 50, 150, and 500 mg/mL doses, respectively. Finally, data for the last dosing day showed a difference of − 18.33%, − 12.60%, and − 13.43% for the 50, 150 and, 500 mg/mL doses, respectively. For AK, the differences between the mean value and the targeted concentrations were − 9.37%, − 9.06%, and − 9.50% on the first dosing day, − 23.01%, − 21.21%, and − 15.33% at the interim time point, and − 30.53%, − 23.19%, and − 20.38% on the last dosing day for the 50, 150, and, 500 mg/mL doses, respectively. Except for the concentration of AK at all doses at the interim timepoint and on the last dosing day and the concentration of MS at 50 mg/mL on the last dosing day, the concentrations of all formulations were within the acceptable range (within ± 15%).
Table 2A.
Ratio of the concentration and homogeneity between the mean value and the targeted concentration.
| Concentrationd |
Concentration verificationb |
Homogeneity verificationc |
||||||||||
|---|---|---|---|---|---|---|---|---|---|---|---|---|
| 50 mg/mL |
150 mg/mL |
500 mg/mL |
50 mg/mL | 500 mg/mL | ||||||||
| Actual | Targeted | (%) | Actual | Targeted | (%) | Actual | Targeted | (%) | Coefficient of variation (%) | |||
| MS | Initial day | 2.01 | 2.08 | -3.19 | 6.24 | 6.24 | -0.01 | 20.05 | 20.81 | -3.63 | 2.40 | 3.36 |
| Interim day | 1.86 | 2.08 | -10.55 | 5.68 | 6.24 | -8.92 | 19.55 | 20.81 | -6.04 | 1.44 | 1.92 | |
| Final day | 1.70 | 2.08 | -18.33a | 5.45 | 6.24 | -12.60 | 18.02 | 20.81 | -13.43 | 1.44 | 4.61 | |
| AK | Initial day | 0.98 | 1.08 | -9.37 | 2.96 | 3.25 | -9.06 | 9.80 | 10.83 | -9.50 | 3.70 | 1.57 |
| Interim day | 0.83 | 1.08 | -23.01a | 2.56 | 3.25 | -21.21a | 9.17 | 10.83 | -15.33a | 2.78 | 4.52 | |
| Final day | 0.75 | 1.08 | -30.53a | 2.50 | 3.25 | -23.20a | 8.62 | 10.83 | -20.38a | 9.26 | 3.51 | |
actual concentrations were not within ± 15% of the target concentration.
concentration verification = [(actual value - targeted value) / targeted value] × 100%
homogeneity verification = [standard deviation/mean] × 100%; the coefficient of variation values were within ± 15%
the actual and targeted concentration unit is mg/g
Table 2B.
Calculation of the lowest reported concentrations in final day.
| Concentrationa | Actual value | Targeted value | Concentration calibrationb (%) | The lowest reported concentrations | |
|---|---|---|---|---|---|
| 50 mg/mL | MS | 1.70 | 2.08 | 81.67 | 50 × 0.8167 = 40.8 mg/mL |
| AK | 0.75 | 1.08 | 69.47 | 50 × 0.6947 = 34.7 mg/mLc | |
| 150 mg/mL | MS | 5.45 | 6.24 | 87.40 | 150 × 0.8740 = 131.1 mg/mL |
| AK | 2.50 | 3.25 | 76.80 | 150 × 0.7680 = 115.2 mg/mLc | |
| 500 mg/mL | MS | 18.02 | 20.81 | 86.57 | 500 × 0.8657 = 432.9 mg/mL |
| AK | 8.62 | 10.83 | 79.62 | 500 × 0.7962 = 398.1 mg/mLc | |
the unit of actual and targeted concentration were mg/g
concentration calibration = [(actual value/targeted value] × 100%
choose the lowest data between MS and AK to calculate the lowest reported concentrations
As for the homogeneity verification test (Table 2A), MS samples exhibited precision of 2.40% and 3.36% on the first dosing day, 1.44% and 1.92% at the interim time point, and 1.44% and 4.61% on the last dosing day for the low and high dose formulations (50 mg/mL and 500 mg/mL), respectively. The precision of AK samples for the low and high dose formulations was 3.70% and 1.57% on the first dosing day, 2.78% and 4.52% at the interim time point, and 9.26% and 3.51% on the last dosing day, respectively. The results demonstrated that the dose formulations were homogeneous (within ± 15%). We used the out of 15% range of the final day data to calculate the lowest reported concentrations. Based on the above results, the lowest reported concentrations for the low, middle, and high dose formulations were 34.7, 115.2, and 398.1 mg/mL, respectively (Table 2B).
3.1.2. Clinical signs and observations
One female rat in the 1000 mg/kg/day group had died on Day-56, which was attributed to a gavage dosing accident as determined through gross examination (esophageal perforation). No other mortality related to the administration of the material at any dose level was observed. Furthermore, ophthalmologic examinations did not reveal any negative effects during the acclimation and the dosing periods. During the study period, animal body weight increased according to the normal pattern of the species. Body weight (Fig. 1A and B) and food consumption (Figs. 2A and 2B) remained unchanged for rats receiving the test material during the dosing period. Urinalysis and urinary sediment examination did not reveal any test material-related changes after 13 weeks of administration (unpublished data).
Fig. 1.

The body weight change of male (A) and female (B) rats during ANKASCIN 568-R administration.
Fig. 2.

The food consumption change of male (A) and female (B) rats during ANKASCIN 568-R administration.
3.1.3. Serum biochemistry and hematology
Hematology data (Table 3) were within the normal range; however, the test materials slightly reduced neutrophil (NEUT) percentages in female rats at 100 mg/kg/day groups and increased lymphocyte (LYMPH) percentages in female rats at 100 and 1000 mg/kg/day groups, which was significantly different than the control group (p < 0.05). Serum biochemistry results are listed in Table 4. The Ca levels was significantly elevated compared to the control group, in the male rats at 100 mg/kg/day. All measured rat hematology and biochemistry values were within the normal range, and no test material-related changes were observed after 13 weeks of administration.
Table 3.
Summary of hematology findings in male and female rats.
| Dose (mg/kg) | Males (Mean ± SD) |
Females (Mean ± SD) |
||||||
|---|---|---|---|---|---|---|---|---|
| 0 | 100 | 300 | 1000 | 0 | 100 | 300 | 1000 | |
| RBCs (106/μL) | 9.548 ± 0.501 | 9.287 ± 0.319 | 9.691 ± 0.573 | 9.203 ± 0.530 | 9.025 ± 0.397 | 8.767 ± 0.388 | 8.864 ± 0.442 | 8.872 ± 0.399 |
| HGB (g/dL) | 16.50 ± 0.78 | 15.83 ± 0.86 | 16.97 ± 0.89 | 16.05 ± 0.96 | 16.58 ± 0.70 | 16.09 ± 0.85 | 16.21 ± 0.99 | 16.14 ± 0.66 |
| HCT (%) | 49.12 ± 2.65 | 47.10 ± 2.63 | 50.10 ± 2.95 | 47.60 ± 2.96 | 48.29 ± 1.92 | 46.88 ± 2.43 | 47.53 ± 2.47 | 46.95 ± 2.24 |
| MCV (fL) | 51.47 ± 1.66 | 50.72 ± 2.06 | 51.71 ± 1.53 | 51.77 ± 2.21 | 53.53 ± 1.13 | 53.49 ± 1.77 | 53.63 ± 0.97 | 52.94 ± 1.34 |
| MCH (pg) | 17.31 ± 0.57 | 17.03 ± 0.73 | 17.51 ± 0.56 | 17.43 ± 0.79 | 18.39 ± 0.41 | 18.36 ± 0.78 | 18.29 ± 0.42 | 18.19 ± 0.44 |
| MCHC (g/dL) | 33.63 ± 0.61 | 33.59 ± 0.31 | 33.88 ± 0.44 | 33.68 ± 0.55 | 34.34 ± 0.38 | 34.32 ± 0.47 | 34.10 ± 0.50 | 34.36 ± 0.33 |
| PLT (103/μL) | 1015.8 ± 151.4 | 957.7 ± 126.7 | 971.3 ± 165.6 | 990.8 ± 119.5 | 995.6 ± 90.73 | 950.7 ± 75.5 | 989.7 ± 123.4 | 999.3 ± 55.8 |
| WBCs (103/μL) | 12.225 ± 1.980 | 13.558 ± 1.752 | 12.331 ± 2.933 | 13.023 ± 3.510 | 9.966 ± 2.306 | 11.283 ± 1.583 | 9.158 ± 1.685 | 10.344 ± 1.936 |
| NEUT (%) | 20.08 ± 6.43 | 15.25 ± 3.81 | 20.71 ± 8.39 | 17.93 ± 6.68 | 14.71 ± 4.88 | 10.20 ± 3.55 * | 12.43 ± 3.70 | 10.70 ± 2.76 |
| LYMPH (%) | 73.85 ± 6.36 | 78.92 ± 3.88 | 72.94 ± 8.12 | 75.83 ± 7.04 | 79.67 ± 5.20 | 84.57 ± 3.92 * | 82.13 ± 3.83 | 84.01 ± 3.14 * |
| MONO (%) | 2.43 ± 0.82 | 2.28 ± 0.47 | 2.41 ± 0.58 | 2.40 ± 0.76 | 2.37 ± 0.75 | 2.30 ± 0.69 | 2.43 ± 0.46 | 2.11 ± 0.60 |
| EOS (%) | 1.56 ± 0.49 | 1.32 ± 0.43 | 1.67 ± 0.52 | 1.51 ± 0.34 | 1.39 ± 0.63 | 1.19 ± 0.41 | 1.12 ± 0.35 | 1.18 ± 0.25 |
| BASO (%) | 1.14 ± 0.16 | 1.21 ± 0.20 | 1.32 ± 0.21 | 1.17 ± 0.25 | 1.06 ± 0.17 | 0.97 ± 0.19 | 1.12 ± 0.26 | 1.10 ± 0.27 |
| PT (second) | 12.33 ± 1.17 | 12.08 ± 1.29 | 12.21 ± 1.18 | 12.55 ± 0.77 | 9.74 ± 0.29 | 9.78 ± 0.21 | 9.67 ± 0.15 | 10.00 ± 0.52 |
| APTT (second) | 16.35 ± 1.13 | 16.37 ± 1.27 | 16.21 ± 1.84 | 15.92 ± 1.36 | 14.78 ± 1.37 | 14.58 ± 1.07 | 14.32 ± 1.07 | 16.08 ± 5.80 |
WBCs, white blood cells; RBCs, red blood cells; HGB, hemoglobin; HCT, hematocrit; MCV, mean corpuscular volume; MCH, mean corpuscular hemoglobin; MCHC, mean corpuscular hemoglobin concentration; PLT, platelet; NEUT, neutrophil; LYMPH, lymphocyte; MONO, monocyte; EOS, eosinophil; BASO, basophil; PT, prothrombin time; APTT, activated partial thromboplastin time.
* : p < 0.05.
Table 4.
Summary of serum biochemistry findings in male and female rat.
| Dose (mg/kg) | Males (Mean ± SD) |
Females (Mean ± SD) |
||||||
|---|---|---|---|---|---|---|---|---|
| 0 | 100 | 300 | 1000 | 0 | 100 | 300 | 1000 | |
| ALP (U/L) | 75.6 ± 15.7 | 74.5 ± 8.3 | 75.8 ± 13.4 | 72.8 ± 13.4 | 46.9 ± 9.6 | 43.1 ± 9.9 | 44.8 ± 7.2 | 45.3 ± 10.9 |
| ALT (U/L) | 37.8 ± 4.8 | 33.3 ± 7.1 | 38.7 ± 10.6 | 34.9 ± 8.2 | 32.2 ± 7.5 | 32.2 ± 4.8 | 33.3 ± 11.2 | 26.5 ± 3.2 |
| AST (U/L) | 112.8 ± 17.8 | 107.3 ± 19.1 | 106.3 ± 14.8 | 101.8 ± 21.1 | 106.3 ± 35.1 | 115.1 ± 18.0 | 103.9 ± 18.2 | 96.5 ± 16.1 |
| γ-GT (U/L) | 1.058 ± 0.451 | 1.479 ± 0.428 | 1.041 ± 0.569 | 1.177 ± 0.522 | 1.352 ± 0.943 | 1.494 ± 0.349 | 1.156 ± 0.807 | 1.541 ± 0.607 |
| GLU (mg/dL) | 203.8 ± 34.7 | 249.8 ± 48.6 | 222.8 ± 43.0 | 231.0 ± 54.0 | 208.5 ± 31.5 | 201.5 ± 23.7 | 219.7 ± 37.5 | 206.1 ± 29.2 |
| T-BIL (mg/dL) | 0.020 ± 0.00 | 0.020 ± 0.014 | 0.010 ± 0.000 | 0.013 ± 0.006 | 0.023 ± 0.018 | 0.021 ± 0.010 | 0.025 ± 0.023 | 0.027 ± 0.018 |
| D-BIL (mg/dL) | 0.018 ± 0.008 | 0.020 ± 0.008 | 0.023 ± 0.012 | 0.023 ± 0.005 | 0.016 ± 0.008 | 0.015 ± 0.007 | 0.018 ± 0.011 | 0.025 ± 0.009 |
| CRE (mg/dL) | 0.56 ± 0.05 | 0.53 ± 0.05 | 0.57 ± 0.10 | 0.53 ± 0.10 | 0.58 ± 0.06 | 0.57 ± 0.05 | 0.55 ± 0.05 | 0.55 ± 0.08 |
| BUN (mg/dL) | 16.91 ± 1.43 | 16.96 ± 1.58 | 17.67 ± 3.09 | 17.14 ± 1.52 | 17.71 ± 2.35 | 17.67 ± 2.23 | 15.88 ± 2.11 | 16.44 ± 2.72 |
| TP (g/dL) | 7.01 ± 0.30 | 7.09 ± 0.27 | 7.08 ± 0.33 | 7.09 ± 0.35 | 7.53 ± 0.31 | 7.53 ± 0.65 | 7.74 ± 0.69 | 7.65 ± 0.48 |
| ALB (g/dL) | 3.33 ± 0.09 | 3.33 ± 0.14 | 3.35 ± 0.14 | 3.29 ± 0.14 | 3.70 ± 0.17 | 3.73 ± 0.29 | 3.86 ± 0.32 | 3.80 ± 0.25 |
| A/G ratio | 0.90 ± 0.06 | 0.88 ± 0.06 | 0.89 ± 0.07 | 0.88 ± 0.06 | 0.97 ± 0.05 | 0.98 ± 0.06 | 0.99 ± 0.03 | 0.99 ± 0.08 |
| Na (mEq/L) | 148.9 ± 1.3 | 147.9 ± 1.4 | 148.0 ± 1.5 | 148.3 ± 1.7 | 146.9 ± 1.7 | 146.9 ± 1.5 | 147.4 ± 1.5 | 147.3 ± 1.3 |
| K (mEq/L) | 6.04 ± 0.38 | 6.13 ± 0.44 | 6.23 ± 0.75 | 6.13 ± 0.57 | 6.35 ± 0.56 | 6.50 ± 0.82 | 6.23 ± 0.62 | 6.41 ± 0.59 |
| Cl (mEq/L) | 99.2 ± 1.6 | 98.4 ± 1.8 | 98.8 ± 1.4 | 98.3 ± 2.4 | 99.8 ± 2.3 | 100.3 ± 2.2 | 99.8 ± 1.9 | 100.5 ± 0.9 |
| Ca (mg/dL) | 11.31 ± 0.40 | 12.03 ± 0.60 * | 11.51 ± 0.46 | 11.64 ± 0.71 | 12.20 ± 0.28 | 12.03 ± 2.2 | 12.25 ± 0.70 | 12.23 ± 0.44 |
| P (mg/dL) | 9.34 ± 0.55 | 9.68 ± 0.62 | 9.24 ± 0.60 | 9.64 ± 0.94 | 0.91 ± 0.90 | 8.68 ± 0.95 | 8.47 ± 0.74 | 8.77 ± 0.92 |
| CHO (mg/dL) | 74.3 ± 20.1 | 82.2 ± 27.2 | 70.7 ± 15.8 | 69.6 ± 13.8 | 87.2 ± 15.6 | 82.8 ± 16.6 | 90.3 ± 17.4 | 83.5 ± 12.4 |
| TG (mg/dL) | 53.8 ± 27.8 | 68.2 ± 47.9 | 58.7 ± 36.1 | 49.8 ± 29.2 | 41.4 ± 17.2 | 34.9 ± 12.6 | 50.2 ± 25.6 | 42.8 ± 23.0 |
| LDH (U/L) | 766.3 ± 346.9 | 853.1 ± 385.3 | 688.7 ± 328.1 | 588.4 ± 344.5 | 605.3 ± 443.5 | 895.6 ± 378.4 | 647.9 ± 299.4 | 579.5 ± 215.6 |
| CPK (U/L) | 393.4 ± 170.8 | 440.1 ± 228.0 | 359.5 ± 159.8 | 295.0 ± 162.7 | 342.7 ± 273.8 | 474.2 ± 221.8 | 363.3 ± 170.2 | 308.5 ± 106.3 |
| UA (mg/dL) | 3.36 ± 0.64 | 3.99 ± 1.11 | 3.59 ± 0.78 | 4.00 ± 1.06 | 3.07 ± 0.62 | 3.04 ± 0.74 | 3.53 ± 0.88 | 3.33 ± 0.71 |
ALP, alkaline phosphatase; ALT, alanine aminotransferase; AST, aspartate aminotransferase; γ-GT, γ-glutamyl transferase; GLU, glucose; T-BIL, total bilirubin; D-BIL, direct bilirubin; CRE, creatinine; BUN, blood urea nitrogen; TP, total protein; ALB, albumin; A/G ratio, albumin/globulin ratio; Na, sodium; K, potassium; Cl, chloride; Ca, calcium; P, phosphorus; CHO, cholesterol; TG, triglycerides; LDH, lactate dehydrogenase; CPK, creatine phosphokinase; UA, uric acid.
* : p < 0.05.
3.1.4. Gross pathology, organ weights, and histopathology
During necropsy, gross pathologies were not observed. The organ weights are listed in Table 5. The data showed the organ weights relative to the test material, with no microscopic findings associated with ANKASCIN 568-R administration in the histopathological study.
Table 5.
Organ and body weights of male and female rats.
| Dose (mg/kg) Mean ± SD | Males |
Females |
||||||
|---|---|---|---|---|---|---|---|---|
| 0 | 100 | 300 | 1000 | 0 | 100 | 300 | 1000 | |
| Body (g)a | 547.7 ± 52.3 | 558.5 ± 71.0 | 539.5 ± 60.3 | 561.9 ± 50.9 | 266.9 ± 13.9 | 268.7 ± 31.8 | 282.8 ± 32.1 | 282.3 ± 31.5 |
| Testes (g) | 3.42 ± 0.37 | 3.39 ± 0.23 | 3.58 ± 0.27 | 3.58 ± 0.31 | – | – | – | – |
| Ovaries (g) | – | – | – | – | 0.0856 ± 0.0143 | 0.0868 ± 0.0121 | 0.0854 ± 0.0154 | 0.0905 ± 0.0086 |
| Spleen (g) | 0.86 ± 0.15 | 0.93 ± 0.14 | 0.82 ± 0.11 | 0.88 ± 0.13 | 0.49 ± 0.08 | 0.53 ± 0.10 | 0.53 ± 0.08 | 0.56 ± 0.08 |
| Liver (g) | 16.72 ± 2.14 | 17.94 ± 3.57 | 16.26 ± 2.65 | 17.96 ± 2.47 | 7.78 ± 0.66 | 8.15 ± 1.42 | 8.46 ± 1.25 | 8.48 ± 0.95 |
| Kidneys (g) | 3.95 ± 0.33 | 3.93 ± 0.56 | 3.83 ± 0.46 | 4.01 ± 0.37 | 1.96 ± 0.25 | 2.03 ± 0.22 | 2.12 ± 0.24 | 2.11 ± 0.22 |
| Adrenals (g) | 0.0561 ± 0.0073 | 0.0604 ± 0.0077 | 0.0543 ± 0.0078 | 0.0568 ± 0.0107 | 0.0679 ± 0.0102 | 0.0687 ± 0.0120 | 0.0723 ± 0.0077 | 0.0660 ± 0.0112 |
| Thymus (g) | 0.4680 ± 0.0895 | 0.5081 ± 0.1355 | 0.5388 ± 0.1660 | 0.5012 ± 0.0954 | 0.3107 ± 0.0662 | 0.3150 ± 0.0566 | 0.3300 ± 0.0701 | 0.3365 ± 0.0548 |
| Heart (g) | 1.71 ± 0.13 | 1.75 ± 0.18 | 1.61 ± 0.20 | 1.73 ± 0.17 | 0.98 ± 0.12 | 1.03 ± 0.15 | 1.02 ± 0.13 | 1.17 ± 0.35 |
| Brain (g) | 2.08 ± 0.11 | 2.17 ± 0.14 | 2.11 ± 0.10 | 2.13 ± 0.09 | 1.93 ± 0.09 | 1.89 ± 0.08 | 1.93 ± 0.09 | 19.0 ± 0.12 |
Body weight on Day 92.
3.2. Genotoxicity studies
3.2.1. Ames test
For mutagenicity testing, we treated the cultures with ANKASCIN 568-R at doses of 50, 150, 500, 1500, and 5000 μg/plate with and without S9. Owing to the cytotoxicity observed at higher doses (500, 1500, and 5000 μg/plate) in TA102 and TA1537 without S9, doses of 5, 15, 50, 150, and 500 μg/plate were used in TA102 and TA1537 (Table 6). The mean colony numbers of the negative controls of the five test strains were within the acceptable range in both with and without S9. An induction of a more than 3-fold increase was observed in the number of revertants in concurrent strain-specific positive controls for TA1535 and TA1537 as compared to negative control values. In addition, three strains, TA98, TA100, and TA102 showed more than 2-fold increase in the positive controls. The revertant numbers were increased at ANKASCIN 568-R doses ranging from 50 to 5000 μg/plate for test strains TA98, TA100, and TA1535 without S9. In addition, revertant numbers did not increase in all doses of ANKASCIN 568-R in the test strains with S9 (Table 6). Owing to the cytotoxicity observed in test strains TA102 and TA1537 at high ANKASCIN 568-R doses without S9, we used doses at 5–150 μg/plate in these test strains. The results showed no increase in revertant numbers at ANKASCIN 568-R doses at 5–150 μg/plate in test strains TA102 and TA1537, without S9 (Table 7).
Table 6.
ANKASCIN 568-R mutagenicity in Salmonella typhimurium strains with and without S9 metabolic activation.
| Number of revertants/plate |
||||||||||
|---|---|---|---|---|---|---|---|---|---|---|
| Concentration (μg/plate) | TA98 |
TA100 |
TA102 |
TA1535 |
TA1537 |
|||||
| n | X ± SD | n | X ± SD | n | X ± SD | n | X ± SD | n | X ± SD | |
| Without S9 | ||||||||||
| Negative controla | 3 | 15 ± 2 | 3 | 77 ± 8 | 3 | 314 ± 30 | 3 | 8 ± 3 | 3 | 9 ± 2 |
| Positive controlb | 3 | 371c ± 39 | 3 | 483c ± 26 | 3 | 1226c ± 127 | 3 | 337d ± 33 | 3 | 440d ± 20 |
| 50 | 3 | 12 ± 3 | 3 | 74 ± 13 | 3 | 297 ± 7 | 3 | 12 ± 8 | 3 | 7 ± 3 |
| 150 | 3 | 16 ± 4 | 3 | 74 ± 10 | 3 | 248 ± 4 | 3 | 10 ± 1 | 3 | 8 ± 3 |
| 500 | 3 | 15 ± 5 | 3 | 76 ± 11 | 3 | -e | 3 | 8 ± 2 | 3 | -e |
| 1500 | 3 | 16 ± 3 | 3 | 82 ± 19 | 3 | -e | 3 | 6 ± 3 | 3 | -e |
| 5000 | 3 | 11 ± 1 | 3 | 86 ± 8 | 3 | -e | 3 | 10 ± 5 | 3 | -e |
| With S9 | ||||||||||
| Negative controla | 3 | 28 ± 5 | 3 | 101 ± 9 | 3 | 294 ± 22 | 3 | 13 ± 4 | 3 | 20 ± 5 |
| Positive controlf | 3 | 525c ± 9 | 3 | 501c ± 56 | 3 | 1109c ± 27 | 3 | 268d ± 14 | 3 | 411d ± 32 |
| 50 | 3 | 28 ± 6 | 3 | 101 ± 20 | 3 | 319 ± 34 | 3 | 11 ± 5 | 3 | 20 ± 7 |
| 150 | 3 | 36 ± 4 | 3 | 108 ± 7 | 3 | 307 ± 33 | 3 | 13 ± 2 | 3 | 19 ± 1 |
| 500 | 3 | 38 ± 5 | 3 | 95 ± 11 | 3 | 318 ± 22 | 3 | 14 ± 5 | 3 | 13 ± 4 |
| 1500 | 3 | 36 ± 4 | 3 | 103 ± 12 | 3 | 316 ± 37 | 3 | 14 ± 2 | 3 | 14 ± 5 |
| 5000 | 3 | 29 ± 3 | 3 | 99 ± 19 | 3 | 277 ± 25 | 3 | 13 ± 3 | 3 | 15 ± 2 |
Negative control was dimethyl sulfoxide (DMSO).
Positive controls without S9: 1 μg/plate 2-nitrofluorene for TA98; 1 μg/plate sodium azide for TA100; 125 ng/plate mitomycin C for TA102; 0.4 μg/plate sodium azide for TA1535; 0.5 μg/plate acridine mutagen ICR 191 for TA1537.
Greater than 2-fold negative control spontaneous revertant numbers.
Greater than 3-fold negative control spontaneous revertant numbers.
Pin colonies.
Positive controls with S9: 1 μg/plate 2-aminofluorene for TA98; 4 μg/plate 2-aminofluorene for TA100; 5 μg/plate 2-aminoanthracene for TA102; 1 μg/plate 2-aminoanthracene for TA1535; 2 μg/plate 2-aminoanthracene for TA1537.
Table 7.
Repeated ANKASCIN 568-R mutagenicity test in Salmonella typhimurium strains without S9 metabolic activation.
| Time of test S9 group Concentration (μg/plate) | TA102 |
TA1537 |
||
|---|---|---|---|---|
| n | X ± SD | n | X ± SD | |
| Without S9 | ||||
| Negative controla | 3 | 303 ± 34 | 3 | 11 ± 5 |
| Positive controlb | 3 | 1375c ± 113 | 3 | 424d ± 19 |
| 5 | 3 | 297 ± 3 | 3 | 13 ± 2 |
| 15 | 3 | 298 ± 21 | 3 | 10 ± 3 |
| 50 | 3 | 276 ± 31 | 3 | 12 ± 2 |
| 150 | 3 | 217 ± 12 | 3 | 10 ± 6 |
| 500 | 3 | -e | 3 | -e |
Negative control was dimethyl sulfoxide (DMSO).
Positive controls without S9: 125 ng/plate mitomycin C for TA102; 0.5 μg/plate acridine mutagen ICR 191 for TA1537.
Greater than 2-fold negative control spontaneous revertant numbers.
Greater than 3-fold negative control spontaneous revertant numbers.
Pin colonies.
3.2.2. Chromosomal aberration test
The activities of ANKASCIN 568-R in inducing chromosomal aberrations in test schemes I, II and III were presented in Table 8. At least three analyzable concentrations were obtained for each test scheme as recommended by OECD Guideline #473 [17]. Table 8 summarizes the frequencies of chromosomal aberrations for the three test schemes. The values of aberrant cells were 0.5%, 0%, and 0.5% in the negative controls of test schemes I, II, and III, respectively. The values of aberrant cells were increased in the positive controls (24.5%, 32.5%, and 32.5%, respectively) as compared than negative controls.
Table 8.
Effects of ANKASCIN 568-R on chromosomal aberration induction in Chinese hamster ovary cells after 3 h of treatment in the absence of S9.
| Concentration (μg/mL) | Total metaphase cells | Percentage of aberrant cellsa | Structural aberrations |
Aberrant cells (%) | |||||||
|---|---|---|---|---|---|---|---|---|---|---|---|
| Gb | B | D | R | g | b | e | MA | ||||
| -S9, 3 h (Scheme I) | |||||||||||
| Negative controlc | 200 | 1 | 0 | 0 | 0 | 1 | 2 | 0 | 0 | 0 | 0.5 |
| Positive controld | 200 | 49 | 0 | 0 | 2 | 5 | 8 | 5 | 42 | 1 | 24.5 |
| 15 | 200 | 1 | 0 | 0 | 0 | 0 | 0 | 0 | 1 | 0 | 0.5 |
| 50 | 200 | 5 | 1 | 0 | 1 | 0 | 5 | 2 | 1 | 1 | 2.5 |
| 150 | 200 | 0 | 0 | 0 | 0 | 0 | 0 | 0 | 0 | 0 | 0 |
| 500 | 200 | 3 | 0 | 0 | 0 | 0 | 2 | 0 | 3 | 0 | 1.5 |
| 1500 | 200 | Fewer metaphases | |||||||||
| -S9, 20 h (Scheme II) | |||||||||||
| Negative controlc | 200 | 0 | 0 | 0 | 0 | 0 | 1 | 0 | 0 | 0 | 0 |
| Positive controle | 200 | 65 | 2 | 0 | 3 | 2 | 9 | 7 | 62 | 2 | 32.5 |
| 5 | 200 | 1 | 0 | 0 | 1 | 0 | 2 | 0 | 0 | 0 | 0.5 |
| 15 | 200 | 0 | 0 | 0 | 0 | 0 | 0 | 0 | 0 | 0 | 0 |
| 50 | 200 | 2 | 2 | 0 | 0 | 1 | 4 | 0 | 1 | 0 | 1 |
| 150 | 200 | 0 | 5 | 0 | 0 | 0 | 2 | 0 | 0 | 0 | 0 |
| 500 | 200 | Fewer metaphases | |||||||||
| +S9, 3 h (Scheme III) | |||||||||||
| Negative controlc | 200 | 1 | 1 | 0 | 0 | 1 | 1 | 0 | 0 | 0 | 0.5 |
| Positive controlf | 200 | 65 | 0 | 0 | 2 | 5 | 5 | 5 | 65 | 4 | 32.5 |
| 5 | 200 | 1 | 1 | 0 | 0 | 0 | 3 | 1 | 0 | 0 | 0.5 |
| 15 | 200 | 1 | 0 | 0 | 0 | 0 | 1 | 0 | 1 | 0 | 0.5 |
| 50 | 200 | 1 | 1 | 0 | 0 | 1 | 3 | 0 | 0 | 0 | 0.5 |
| 150 | 200 | 2 | 0 | 0 | 1 | 0 | 3 | 1 | 0 | 0 | 1 |
| 500 | 200 | Fewer metaphases | |||||||||
Aberrant cells were calculated excluding gaps.
G: chromosome gap; B: chromosome break; D: dicentric; R: ring; g: chromatid gap; b: chromatid break; e: exchange; MA: multiple aberrations.
Negative control was 1% DMSO in McCoy’s 5 A medium.
Positive control received 0.33 μg/mL of mitomycin C (MMC).
Positive control received 11.2 μg/mL of cyclophosphamide (CPP).
Positive control received 0.2 μg/mL of MMC.
3.2.3. Micronucleus assay
We determined the ratio of reticulocytes to total erythrocytes (polychromatic erythrocytes, PCE/(PCE + normochromatic erythrocytes, NCE)) for each individual rat, and the mean ± S.D. for each group is presented in Table 9. The ratio of PCE/(PCE+NCE) indicates the effect of the test material on erythropoiesis. The average ratio of PCE/(PCE+NCE) for the negative control group was 3.79%. At the 500, 1000, and 2000 mg/kg dosages of ANKASCIN 568-R, the ratios were 3.74%, 3.72%, and 3.47%, respectively. There were no significant changes in PCE/(PCE+NCE) treated with ANKASCIN 568-R compared with the control group. The values of micronucleated reticulocytes, represented as MN/1000 RETs for individual animals, and the mean ± S.D. for each group are shown in Table 9. A total of 2000 reticulocytes were calculated, and the mean frequency of micronucleus induction in the negative control group at approximately 48 h after the last ANKASCIN 568-R administration was 2.0 ± 0.4; this was within the acceptable range. The mean MN/1000 RETs in the positive control group was 28.1 ± 2.2 at approximately 48 h after the treatment, which was significantly higher than the negative control group (p < 0.05). At approximately 48 h after the last test material administration, the mean frequencies of micronucleus induction at 500, 1000, 2000 mg/kg for ANKASCIN 568-R were 2.3 ± 0.7, 3.0 ± 0.7, and 2.6 ± 1.1 MN/1000 RETs, respectively.
Table 9.
Effects of ANKASCIN 568-R on the percentages of reticulocytes and the frequencies of micronucleated reticulocytes in BALB/c mice.
| Dose (mg/kg) | Micronucleus rate (MN/1000 RETs) | PCE/ (PCE + NCE) (% reticulocytes) |
|---|---|---|
| 0 (Negative control)a | 2.0 ± 0.4 | 3.79 ± 0.61 |
| 1 (Positive control)b | 28.1 ± 2.2c | 2.15 ± 0.36 |
| 500 | 2.3 ± 0.7 | 3.74 ± 0.41 |
| 1000 | 3.0 ± 0.7 | 3.72 ± 0.44 |
| 2000 | 2.6 ± 1.1 | 3.47 ± 0.50 |
cGroup Mean ± S.D. was calculated from the mean data of each animal.
MN: micronuclei.
RET: reticulocytes.
PCE: polychromatic erythrocytes.
NCE: normochromatic erythrocytes.
Negative control: Corn oil.
Positive control: 1 mg/kg mitomycin C (MMC).
The group mean frequency of MN/1000 RETs was significantly higher than that of the negative control group (p ≦ 0.05, U-test).
4. Discussion
ANKASCIN 568-R is an extract from Monascus purpureus NTU 568 fermented product with potential activity against hyperlipidemia; hence, understanding its toxicity is essential to ensure the safety of users. Therefore, we conducted this study to evaluate its toxicity and genotoxicity over 13 weeks.
In the oral toxicity study, one female rat receiving ANKASCIN 568-R at 1000 mg/kg/day was found dead on day 56 because of a gavage dosing accident by gross examination (esophageal perforation). The animal presented with hypoactivity, chromodacryorrhea, hunched posture, pale mucous membrane, piloerection, dyspnea and red colored stain on forepaws and nose from D52 to D56. Grossly, there were perforation of the esophagus near the thoracic inlet with test material-like material attached, yellow discoloration of pleura, fibrin covering the heart, lung, and pleura, and approximately 5 mL of dark red thoracic fluid filling the thoracic cavity. Microscopically, round particles that were birefringent under polarized light were noted in the above tissues and considered most likely to be the test material. Therefore, no mortality related to the test material was observed.
Dose-dependent salivation was observed in both sexes at 100 mg/kg/day or higher with no mortality related effects by test material. Salivation was not considered an adverse effect. In addition, audible respiration was discovered in two female rats at 300 mg/kg/day. This was assessed as occasional and most likely related to the dosing procedures. Sporadically observed soft feces in one male rat at a dose of 100 mg/kg/day and hair loss at various doses in both sexes were regarded incidental changes and not related with test material.
Food consumption was significant decreased in males at 100 mg/kg/day group during week 1 and at 300 mg/kg/day group during week 11. As these changes were sporadic and did not show dose-dependence, they were not considered to be test material-related. Therefore, no differences were detected in body weight, or food intake between these groups at any time point.
Regarding hematology and serum biochemistry, data of the neutrophil (NEUT) and lymphocyte (LYMPH) were not compared with negative control, since these changes were within the laboratory’s historical range (NEUT in female: 4.70–21.30%; LYMPH in female: 66.51–92.01%) and showed no dose dependence, and hence were not relevant. Furthermore, Ca was slightly elevated in male rats of 100 mg/kg/day group, and reached statistical significance compared to the control group. As this change was within the laboratory’s historical range (Ca in males: 9.64–13.28 mg/dL) and did not show dose dependence, it was not relevant.
The liver hernia into the thoracic cavity was observed in a single male rat and was considered as congenital abnormality. Mild focal white discoloration of the liver was observed in a single male rat. There were no correlations of microscopic results, and this focal finding was considered to be toxicologically irrelevant in relation to ANKASCIN 568-R administration.
Brown discoloration of the heart, with the attachment of a substance resembling the test material, and irregular surfaces of right lung lobes, with fibrin deposition, were observed in a female rat at an ANKASCIN 568-R dose of 1000 mg/kg/day, correlating with granulomatous inflammation of the heart, mixed cell inflammation of the aorta, and mononuclear cell inflammation of the lungs. The death of the female rat was considered to be most likely due to a dosing accident, which was in line with the type and distribution of lesions observed. In the other test animals, other microscopic changes were considered spontaneous background changes common in this species, incidental, toxicologically irrelevant or biologically insignificant due to low incidence grade or a lack of dose response.
In addition, organ weight fluctuations without the corresponding gross pathological or histopathological changes were irrelevant unless simultaneous dose-dependency and concurrent organ weight and organ weight/body weight ratio changes were observed in the same direction. Therefore, test material was not associated with changes observed during gross and histopathology examination.
Genotoxicity tests, including the Ames test, chromosomal aberration assay, and mammalian micronucleus test, have been commonly used for safety evaluations [6], [19], [20].
Under the Ames test conditions, both with and without S9, treatment with ANKASCIN 568-R did not increase the values of revertants over spontaneous revertants in the five tester S. typhimurium strains at all test doses. ANKASCIN 568-R was not mutagenic in the S. typhimurium reverse mutation analysis.
Chromosomal aberrations induced by ANKASCIN 568-R were analyzed using three test schemes. Few cells in metaphase were observed at 1500 μg/mL in scheme I, and 500 μg/mL in schemes II and III. No more than 3% of chromosome aberrant cells were observed at any tested concentration for all three schemes; therefore, statistical analysis was not conducted.
Under the assay conditions, ANKASCIN 568-R did not induce chromosomal aberrations in the CHO cells both with and without S9.
In the micronucleus assay, statistical analysis of individual animal data was performed using the U-test, and the results of the micronucleus assay performed in BALB/c mice indicated that ANKASCIN 568-R did not cause a mutagenic response in mouse peripheral blood at 2000 mg/kg.
ANKASCIN 568-R was administered once daily by gavage to rats for 13 consecutive weeks. No adverse effects were observed through clinical observations, ophthalmological examinations, body weight and food consumption analyses, or microscopic and clinical pathology examinations. The results of the safety evaluation for ANKASCIN 568-R are similar to those fermented products obtained from M. purpureus NTU 568. [6], [11].
Regarding the dose formulation analysis, the lowest reported concentrations for the low, middle, and high dose formulations were 34.7, 115.2, and 398.1 mg/mL, respectively. Thus, the dose levels were adjusted to 69.4, 230.4, and 796.2 mg/kg/day for oral toxicity testing, and the value of the NOAEL was determined to be 796.2 mg/kg/day under the conditions of this study.
In conclusion, this study resulted the first toxicity evaluation data of ANKASICN 568-R, and the data demonstrated that ANKASICN 568-R was safe. ANKASICN 568-R is a natural extract and can be used in the development of dietary ingredient in the future. Thus, this is an important safety assessment for clinical studies of ANKASICN 568-R. In addition, monascin and ankaflavin were the major active materials in ANKASICN 568-R. There is currently no separate toxicity test data, and it can be studied in the future.
CRediT authorship contribution statement
Che-Wei Lin: Writing – original draft, Writing – review & editing, Resources. Hsiao-Lin Chen: Conceptualization, Methodology, Supervision. Yu-Hui Yang: Methodology, Validation, Investigation. Ya-Yuan Chen: Methodology, Validation, Supervision. Ya-Wen Hsu: Conceptualization, Writing – original draft, Writing – review & editing. Tzu-Ming Pan: Conceptualization, Investigation, Resources, Supervision, Writing – review & editing.
Declaration of Competing Interest
The authors declare that they have no known competing financial interests or personal relationships that could have appeared to influence the work reported in this paper.
Acknowledgments
The research grant and ANKASCIN 568-R were provided by SunWay Biotech Co., Taipei, Taiwan (No. T68213001-GN). We thank the Center of Toxicology and Preclinical Sciences QPS Taiwan, New Taipei City, Taiwan, for assistance in the experimental design and execution of the study.
References
- 1.Patel S. Functional food red yeast rice (RYR) for metabolic syndrome amelioration: a review on pros and cons, World. J. Microbiol. Biotechnol. 2016;32:87. doi: 10.1007/s11274-016-2035-2. [DOI] [PubMed] [Google Scholar]
- 2.Zhu B., Qi F., Wu J., Yin G., Hua J., Zhang Q., Qin L. Red yeast rice: a systematic review of the traditional uses, chemistry, pharmacology, and quality control of an important Chinese folk medicine. Front. Pharmacol. 2019;10:1449. doi: 10.3389/fphar.2019.01449. [DOI] [PMC free article] [PubMed] [Google Scholar]
- 3.Li J.J., Zhong X.J., Wang X., Yang X.M., Yue J.Y., Zhang X., Liu J.C., Wang K.Q., Shang X.Y. Polyhydroxylated sterols from Monascus purpureus-fermented rice. Steroids. 2020;154 doi: 10.1016/j.steroids.2019.108546. [DOI] [PubMed] [Google Scholar]
- 4.Lee C.L., Wen J.Y., Hsu Y.W., Pan T.M. The blood lipid regulation of Monascus-produced monascin and ankaflavin via the suppression of low-density lipoprotein cholesterol assembly and stimulation of apolipoprotein A1 expression in the liver. J. Microbiol. Immunol. Infect. 2018;51:27–37. doi: 10.1016/j.jmii.2016.06.003. [DOI] [PubMed] [Google Scholar]
- 5.Nguyen T.P.T., Garrahan M.A., Nance S.A., Seeger C.E., Wong C. Assimilation of cholesterol by Monascus purpureus. J. Fungi. 2020;6:352. doi: 10.3390/jof6040352. [DOI] [PMC free article] [PubMed] [Google Scholar]
- 6.Hsu L.C., Hsu Y.W., Hong C.C., Pan T.M. Safety and mutagenicity evaluation of red mold dioscorea fermented from Monascus purpureus NTU 568. Food Chem. Toxicol. 2014;67:161–168. doi: 10.1016/j.fct.2014.02.033. [DOI] [PubMed] [Google Scholar]
- 7.Lee C.L., Tsai T.Y., Wang J.J., Pan T.M. In vivo hypolipidemic effects and safety of low dosage Monascus powder in a hamster model of hyperlipidemia. Appl. Microbiol. Biotechnol. 2006;70:533–540. doi: 10.1007/s00253-005-0137-0. [DOI] [PubMed] [Google Scholar]
- 8.Chen C.L., Pan T.M. Effects of red mold dioscorea with pioglitazone, a potentially functional food, in the treatment of diabetes. J. Food Drug Anal. 2015;23:719–728. doi: 10.1016/j.jfda.2015.04.013. [DOI] [PMC free article] [PubMed] [Google Scholar]
- 9.Lee C.L., Kuo T.F., Wang J.J., Pan T.M. Red mold rice ameliorates impairment of memory and learning ability in intracerebroventricular amyloid β-infused rat by repressing amyloid β accumulation. J. Neurosci. Res. 2007;85:3171–3182. doi: 10.1002/jnr.21428. [DOI] [PubMed] [Google Scholar]
- 10.Lee C.L., Kung Y.H., Wu C.L., Hsu Y.W., Pan T.M. Monascin and ankaflavin act as novel hypolipidemic and high-density lipoprotein cholesterol-raising agents in red mold dioscorea. J. Agric. Food Chem. 2010;58:9013–9019. doi: 10.1021/jf101982v. [DOI] [PubMed] [Google Scholar]
- 11.Yu C.C., Wang J.J., Lee C.L., Lee S.H., Pan T.M. Safety and mutagenicity evaluation of nanoparticulate red mold rice. J. Agric. Food Chem. 2008;56:11038–11048. doi: 10.1021/jf801335u. [DOI] [PubMed] [Google Scholar]
- 12.OECD, Test No. 408: Repeated Dose 90-Day Oral Toxicity Study in Rodents. OECD Guidelines for the Testing of Chemicals, Section 4, Organization for Economic Co-Operation and Development Publishing, Paris. 1998. 10.1787/9789264070707-en. [DOI]
- 13.Jeong J., Bae K., Kim J., Choi C., Na C., Park M., Kim Y., Seo C.S., Kim S.J. A 13-week repeated oral dose toxicity study of ChondroT in Sprague-Dawley rats. BMC Complement. Altern. Med. 2019;19:367. doi: 10.1186/s12906-019-2773-4. [DOI] [PMC free article] [PubMed] [Google Scholar]
- 14.Jonker D., Lina B.A.R., Kozianowski G. 13-week oral toxicity study with isomaltulose (Palatinose®) in rats. Food Chem. Toxicol. 2002;40:1383–1389. doi: 10.1016/S0278-6915(02)00106-0. [DOI] [PubMed] [Google Scholar]
- 15.Lina B.A.R., Messinger H., Bär A. 13-week oral toxicity study of vinyl laurate in rats. Regul. Toxicol. Pharmacol. 2015;71:101–107. doi: 10.1016/j.yrtph.2014.10.015. [DOI] [PubMed] [Google Scholar]
- 16.OECD, Test No. 471: Bacterial Reverse Mutation Test. OECD Guidelines for the Testing of Chemicals, Section 4, Organization for Economic Co-Operation and Development Publishing, Paris. 1997. 10.1787/9789264071247-en,. [DOI]
- 17.OECD, Test No. 473: In Vitro Mammalian Chromosomal Aberration Test, OECD Guidelines for the Testing of Chemicals, Section 4, Organization for Economic Co-Operation and Development Publishing, Paris. 1997. 10.1787/9789264264649-en,. [DOI]
- 18.OECD, Test No. 474: Mammalian Erythrocyte Micronucleus Test. OECD Guidelines for the Testing of Chemicals, Section 4, Organization for Economic Co-Operation and Development Publishing, Paris. 1997. 10.1787/9789264264762-en,. [DOI]
- 19.Gao Y., Chen X., Li C., Wang H., Tian J., Fu F. Toxicological evaluation of, red rice yeast extract, Xuezhikang: Acute, 26-week chronic and genotoxicity studies. Regul. Toxicol. Pharmacol. 2020;114 doi: 10.1016/j.yrtph.2020.104654. [DOI] [PubMed] [Google Scholar]
- 20.Penga K.Z., Zhang S.Y., Zhou H.L. Toxicological evaluation of the flavonoid-rich extract from Maydis stigma: Subchronic toxicity and genotoxicity studies in mice. J. Ethnopharmacol. 2016;192:161–169. doi: 10.1016/j.jep.2016.07.012. [DOI] [PubMed] [Google Scholar]