Abstract
The effect of inoculum size (N0) on antimicrobial action has not been extensively studied in in vitro dynamic models. To investigate this effect and its predictability, killing and regrowth kinetics of Staphylococcus aureus and Escherichia coli exposed to monoexponentially decreasing concentrations of trovafloxacin (as a single dose) and ciprofloxacin (two doses at a 12-h interval) were compared at N0 = 106 and 109 CFU/ml (S. aureus) and at N0 = 106, 107, and 109 CFU/ml (E. coli). A series of pharmacokinetic profiles of trovafloxacin and ciprofloxacin with respective half-lives of 9.2 and 4 h were simulated at different ratios of area under the concentration-time curve (AUC) to MIC (in [micrograms × hours/milliliter]/[micrograms/milliliter]): 58 to 466 with trovafloxacin and 116 to 932 with ciprofloxacin for S. aureus and 58 to 233 and 116 to 466 for E. coli, respectively. Although the effect of N0 was more pronounced for E. coli than for S. aureus, only a minor increase in minimum numbers of surviving bacteria and an almost negligible delay in their regrowth were associated with an increase of the N0 for both organisms. The N0-induced reductions of the intensity of the antimicrobial effect (IE, area between control growth and the killing-regrowth curves) were also relatively small. However, the N0 effect could not be eliminated either by simple shifting of the time-kill curves obtained at higher N0s by the difference between the higher and lowest N0 or by operating with IEs determined within the N0-adopted upper limits of bacterial numbers (IE′s). By using multivariate correlation and regression analyses, linear relationships between IE and log AUC/MIC and log N0 related to the respective mean values [(log AUC/MIC)average and (log N0)average] were established for both trovafloxacin and ciprofloxacin against each of the strains (r2 = 0.97 to 0.99). The antimicrobial effect may be accurately predicted at a given AUC/MIC of trovafloxacin or ciprofloxacin and at a given N0 based on the relationship IE = a + b [(log AUC/MIC)/(log AUC/MIC)average] − c [(log N0)/(log N0)average]. Moreover, the relative impacts of AUC/MIC and N0 on IE may be evaluated. Since the c/b ratios for trovafloxacin and ciprofloxacin against E. coli were much lower (0.3 to 0.4) than that for ampicillin-sulbactam as examined previously (1.9), the inoculum effect with the quinolones may be much less pronounced than with the β-lactams. The described approach to the analysis of the inoculum effect in in vitro dynamic models might be useful in studies with other antibiotic classes.
The inoculum effect with its expected reduction of antimicrobial action at higher starting inocula has not been extensively studied in in vitro dynamic models (2, 4, 5, 10, 11). Only two of these studies quantified the inoculum-induced changes in the time-kill curves by calculating either the areas under the bacterial count-time curves (AUBC [5]) or the areas between the control growth and the killing and regrowth curves (IE [4]). Moreover, only one study was aimed at both ascertainment of the inoculum effect and also examination of its predictability (5). Due to the similar slopes of the AUBC versus logarithm of inoculum size (log N0) plots, which were established with five strains of Escherichia coli exposed to the same dose of ampicillin-sulbactam, AUBC was shown to be quite predictable at a given N0 (5). Furthermore, the time-kill curves observed at a higher N0 (N02) might be superimposed on those at a lower N0 (N01) simply by shifting the former curves to account for the difference between log N01 and log N02. This allowed the conclusion that an increase of the starting inoculum does not induce any qualitative (or unpredictable) reductions in the antimicrobial action of ampicillin-sulbactam (5).
The present study was designed to examine the above approach to inoculum effects on the antimicrobial action of trovafloxacin and ciprofloxacin against Staphylococcus aureus and E. coli in an in vitro dynamic model.
MATERIALS AND METHODS
Antimicrobial agents and bacterial strains.
Trovafloxacin mesylate and ciprofloxacin lactate powders were kindly provided by Roerig, a division of Pfizer, and by Bayer AG, respectively, and clinical isolates of S. aureus and E. coli were used in the study. Susceptibility testing was performed in duplicate in Ca2+- and Mg2+-supplemented Mueller-Hinton broth at an inoculum size of 106 CFU/ml at 24 h postexposure. The respective MICs of trovafloxacin for S. aureus and E. coli were 0.15 and 0.25 μg/ml and those of ciprofloxacin were 0.3 and 0.12 μg/ml.
In vitro dynamic model, simulated pharmacokinetic profiles, and starting inocula.
A previously described dynamic model (8) was used in the study. The operation procedure, reliability of simulations of the quinolone pharmacokinetic profiles, and high reproducibility of the time-kill curves provided by the model have been reported elsewhere (7).
A series of monoexponential profiles that mimic single-dose administration of trovafloxacin and two doses of ciprofloxacin administered with a 12-hour interval were simulated. The simulated half-lives (9.25 h for trovafloxacin and 4.0 h for ciprofloxacin) were consistent with values reported for humans: 7.2 to 9.9 h (12, 14) and 3.2 to 5.0 h (1, 9, 13), respectively. In experiments with S. aureus the simulated areas under the concentration-time curve (AUC)/MIC ratios for trovafloxacin and ciprofloxacin were 58, 116, 233, and 466, and 116, 233, 466, and 932 (μg · h/ml)/(μg/ml), respectively. In experiments with E. coli the respective AUC/MICs were 58, 116, and 233, and 116, 233, and 466 (μg · h/ml)/(μg/ml). Two different inoculum sizes that approached approximately 106 and 109 CFU/ml were designed for S. aureus, and three inoculum sizes, 106, 107, and 109 CFU/ml, were designed for E. coli. With ciprofloxacin, the designed AUC/MICs reflect the sum of two AUC/MICs provided by the two doses of the quinolone administered at 12-h intervals taking into account the residual concentrations at the end of the first interval.
Duration of the experiments and quantitation of bacterial growth and killing.
The duration of the experiments was defined in each case as the time until antibiotic-exposed bacteria reached the maximum numbers observed in the absence of antibiotic (control growth). In all cases experiments were stopped when bacteria exposed to the quinolones reached numbers ≥1011 CFU/ml. Since the experiments that simulated low AUC/MIC ratios met this requirement earlier than those simulating a high AUC/MIC ratio, the duration of the former experiments was shorter than the latter: the lower the AUC/MIC ratio, the shorter the observation period.
In each experiment 0.1-ml samples were withdrawn from bacteria-containing media in the central unit throughout the observation period, at first every 30 min, later hourly, then every 3 hours, and during the last 6 to 7 h, again hourly. These samples were subjected to serial 10-fold dilutions with chilled, sterile 0.9% NaCl and were plated in duplicate on Mueller-Hinton agar. After overnight incubation at 37°C the resulting bacterial colonies were counted, and the numbers of CFUs/milliliter were calculated. The limit of detection was 102 CFU/ml (7).
Quantitative evaluation of the antimicrobial effect.
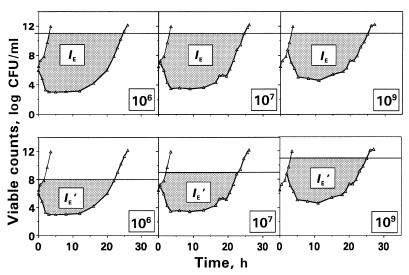
The antimicrobial effect was expressed by its intensity (IE) as described by the area between control growth and bacterial killing-regrowth curves from the zero point, the moment of drug input into the model, up to the time when viable counts on the regrowth curve are close to maximum values observed without drug (3). The upper limit of bacterial numbers, i.e., the cutoff level in the regrowth and control growth curves used to determine the IE was 1011 CFU/ml (Fig. 1).
FIG. 1.
Schematic presentation of the IE and IE′ determinations applied to the kinetics of killing and regrowth of E. coli exposed to trovafloxacin (AUC/MIC = 58 [μg · h/ml]/[μg/ml]). IE (or IE′) describes the dashed area between the control growth (thin lines) and killing and regrowth (bolded lines) curves at the same cutoff level of 1011 CFU/ml (IE determination) or at different cutoff levels (IE′ determination).
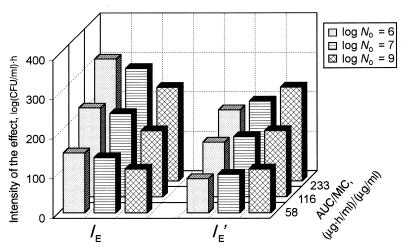
Since the microorganisms are able to grow up to the same numbers (1011 to 1012 CFU/ml), regardless of the N0, the ranges of possible increase in bacterial numbers at different N0s are deliberately unequal: the higher N0, the more narrow the range. For example, at N0 = 109 CFU/ml the microorganisms are allowed to grow by 2 to 3 logs only, whereas at N0 = 106 they are able to grow by 5 to 6 logs. To account for this circumstance, the control growth and time-kill curves observed at N0 = 106, 107, and 107 CFU/ml were limited from above by levels of 108, 109, and 1011 CFU/ml, respectively, and the respective fragments of IE (IE′) were determined within a specific range for each N0 (Fig. 1).
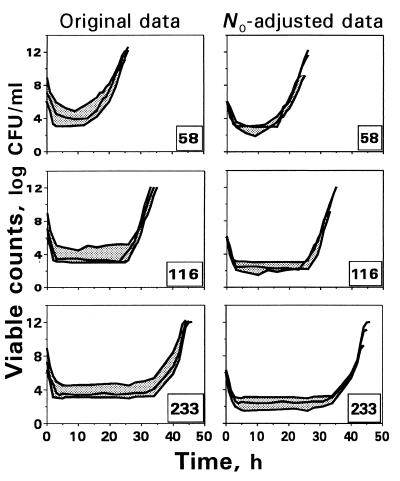
To reveal the possible net effect of inoculum size, i.e., to examine whether qualitative changes in the time-kill curves occur at high N0s, these curves were shifted by the differences between N0 = 107 and 109 CFU/ml and the minimal N0 (106 CFU/ml). The respective difference in N0 was subtracted from each point on the time-kill curves obtained at the higher inocula (5).
Linear regression analysis of the relationships between log N0 and IE related to the respective mean value for each microorganism and each AUC/MIC was performed by using STATISTICA software (version 4.3; StatSoft, Inc.). The same software was used for multivariate correlation and regression analyses of the relationships between IE and log AUC/MIC and log N0 normalized by the respective mean values for each paired quinolone-bacterial strain. To evaluate the relative impacts of N0 and AUC/MIC on the observed antimicrobial effect, coefficients c and b were compared at the respective members of the multiple regression
 |
1 |
where Y is IE, and X1 and X2 are log AUC/MIC and log N0 related to their mean values [(log AUC/MIC)average and (log N0)average], respectively.
Previously reported data on the antimicrobial effects of ampicillin-sulbactam on different strains of E. coli (5) were reassessed in a similar manner. To make the results comparable, the areas between the control growth and the time-kill and regrowth curves (ABBC) (6) were calculated within the 8-h observation period designed in the earlier study. The ABBC estimates were used as the endpoints for multiple correlation and regression analyses.
RESULTS
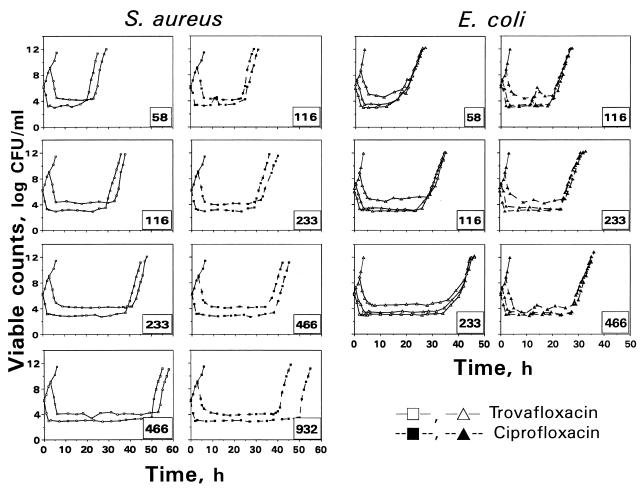
The time courses of viable counts that reflect killing and regrowth of S. aureus and E. coli exposed to monoexponentially decreasing concentrations of trovafloxacin and ciprofloxacin as well as the respective control growth curves are shown in Fig. 2. As seen in the figure, at all the AUC/MIC ratios studied an increase of the starting inoculum resulted in higher absolute numbers of surviving microorganisms. With both strains, the effect of the inoculum was relatively weak, although the inoculum-induced changes in killing of E. coli were more noticeable than those for S. aureus.
FIG. 2.
The kinetics of killing and regrowth of S. aureus and E. coli exposed to two quinolones at N0 = 106 and 109 CFU/ml (S. aureus) and at N0 = 106, 107, and 109 CFU/ml (E. coli). The number in the right corner of each plot indicates the simulated AUC/MIC (in [micrograms × hours/milliliters]/[micrograms/milliliters]).
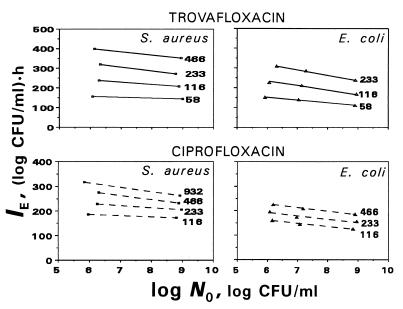
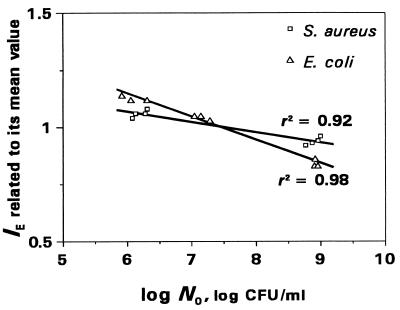
These minor changes are illustrated by the IE versus log N0 plots presented in Fig. 3. As seen in the figure, all the plots slope gently, with slightly smaller slopes for S. aureus than those for E. coli and which in turn are dependent on the AUC/MIC ratios. Since a specific plot was inherent in each of the simulated AUC/MIC ratios, a direct comparison of the inoculum effects for the two microorganisms and the two antibiotics is difficult. To suppress the AUC/MIC-induced differences in the position of the IE-log N0 plots, the IEs determined at each AUC/MIC were related to the respective mean values of IE. For example, being AUC/MIC independent, the relationships between normalized IEs of trovafloxacin and log N0 are distinctly different for S. aureus and E. coli (Fig. 4). As seen in the figure, the effect of the inoculum is more noticeable in the latter case. Similar AUC/MIC-independent relationships were established with ciprofloxacin (r2 = 0.90 and 0.96, respectively), although the differences between the strains were less pronounced (data not shown).
FIG. 3.
Inoculum-dependent changes in the quinolone antimicrobial effects expressed by IEs. The number at each plot indicates the simulated AUC/MIC (in [micrograms × hours/milliliter]/[micrograms/milliliter]).
FIG. 4.
Inoculum-dependent changes in the antimicrobial action of trovafloxacin against S. aureus and E. coli as expressed by the normalized IEs.
To examine qualitative changes in the time-kill curves at higher N0s, a procedure of superimposing those curves observed at N0 = 107 and 109 CFU/ml was applied. Figure 5 shows both original and the N0-adjusted time-kill curves reflecting trovafloxacin effects on E. coli at different AUC/MICs. As seen in the figure, the subtraction of the differences in N0 from each point on the time-kill curves obtained at N0 = 107 and 109 CFU/ml provides only a weak reduction in the area between the upper and the lower curves, especially at higher AUC/MICs. In no case did the use of the curve-shifting procedure provide superimposed time-kill curves. Similar results were obtained with ciprofloxacin and E. coli (data not shown). This is consistent with the results of the IE and IE′ determination (Fig. 6). As seen in the figure, unlike IE, which reflects a systematic reduction in the antimicrobial effect at higher N0s, the IE′ (a fragment of IE within the upper limit corrected by the N0) shows even more pronounced effects at N0 = 107 and 109 CFU/ml than those at N0 = 106 CFU/ml. Similar findings were also obtained when comparing the IE′s of ciprofloxacin. Thus, the two examined procedures provide a misinterpretation of the net effects of inoculum with the quinolones.
FIG. 5.
An attempt to superimpose the time-kill curves of E. coli exposed to trovafloxacin by shifting them to account for the difference in the starting inocula. The number in the right corner of each plot indicates the simulated AUC/MIC (in [micrograms × hours/milliliter]/[micrograms/milliliter]).
FIG. 6.
Comparison of the inoculum-induced changes in IE and IE′ reflecting the antimicrobial action of trovafloxacin against E. coli at different N0s and AUC/MICs.
To predict the antimicrobial effects at different inocula and AUC/MICs, the IEs of trovafloxacin and ciprofloxacin against both S. aureus and E. coli as well as the ABBCs reflecting the antimicrobial action of ampicillin-sulbactam against different strains of E. coli were subjected to multivariate correlation and regression analyses. High correlation coefficients were established in each case (Table 1), demonstrating a good correspondence between the observed IEs (or ABBCs) and their estimates calculated by using equation 1 (see Materials and Methods). Such an equation allows not only the accurate prediction of the antimicrobial effect at a given AUC/MIC and a given N0 but also the establishment of the relative impact of these two contributors as expressed by the c/b ratio on the observed effect. These ratios for trovafloxacin and ciprofloxacin against S. aureus (0.2 to 0.3) and E. coli (0.3 to 0.4) are much less than that for ampicillin-sulbactam (1.9). Thus, the effect of inoculum on the antimicrobial action of these quinolones is relatively less pronounced than that for the β-lactam antibiotic studied.
TABLE 1.
Coefficients of equation 1 and the correlation coefficients
| Bacterial strain(s) | Antibiotic | a | b | c | r2 |
|---|---|---|---|---|---|
| S. aureus | Trovafloxacin | −194 | 546 | 92.6 | 0.99 |
| Ciprofloxacin | 16.6 | 308 | 89.9 | 0.97 | |
| E. coli | Trovafloxacin | −136 | 494 | 155 | 0.99 |
| Ciprofloxacin | 28.7 | 245 | 99.0 | 0.99 | |
| E. coli spp. | Ampicillin-sulbactam | 42.3 | 15.7 | 30.1 | 0.97 |
DISCUSSION
This study suggests that the inoculum effect on the antimicrobial action of trovafloxacin and ciprofloxacin is relatively weak, and it is less pronounced than that of ampicillin-sulbactam against E. coli. Unlike the β-lactams (5), a simple procedure of shifting the time-kill curves obtained at higher inoculum sizes by the difference in the starting inocula did not provide superimposed curves and, in fact, overestimates the net effect of inoculum. The same applies to operating with the inoculum-corrected upper limits for the IE determination (IE′s): rather than remaining constant, the IE′s rise systematically with increasing N0. Similar paradoxical results were obtained by using the differences between log N0 and the logarithm of minimal numbers of bacteria after exposure to the quinolones (Δ log Nmin; data not shown).
Like the AUBC versus log N0 plots for E. coli strains with different susceptibilities exposed to the same AUC of ampicillin-sulbactam, i.e., at different AUC/MIC ratios, the IE-log N0 plots established with trovafloxacin and ciprofloxacin were also distinctly dependent on the simulated AUC/MIC (Fig. 3). To simultaneously account for the impact of inoculum size and AUC/MIC ratio on the antimicrobial effect, multiple regressions were established relating the IE (with the quinolones) or ABBC (with the β-lactams) to both log AUC/MIC and log N0 by using multivariate correlation and regression analyses. These regressions may be useful not only to accurately predict the antimicrobial effect at a given AUC/MIC and a given N0 but also to evaluate the relative contributions of these two factors. By comparing the coefficients at the AUC/MIC and N0 terms in the regression equation, the relative impact of the inoculum size on the effects of trovafloxacin and ciprofloxacin against E. coli was shown to be much less substantial than with ampicillin-sulbactam. The described approach to the evaluation of competitive influences of antibiotic concentration (AUC or dose) and inoculum on the antimicrobial effect might be useful for other antimicrobials and microorganisms.
ACKNOWLEDGMENT
This study was supported by Roerig, a division of Pfizer.
REFERENCES
- 1.Bergan T, Thorsteinsson S B. Pharmacokinetics and bioavailability of ciprofloxacin. In: Neu H C, Weuta H, editors. Proceedings of the 1st International Ciprofloxacin Workshop. Current Clinical Practice Series 34. Amsterdam, The Netherlands: Elsevier Science Publishers B. V. (Excerpta Medica); 1986. pp. 111–121. [Google Scholar]
- 2.Blaser J. Interactions of antimicrobial combinations in vitro: the relativity of synergism. Scand J Infect Dis. 1991;74(Suppl.):71–79. [PubMed] [Google Scholar]
- 3.Firsov A A, Chernykh V M, Navashin S M. Quantitative analysis of antimicrobial effect kinetics in an in vitro dynamic model. Antimicrob Agents Chemother. 1991;34:1312–1317. doi: 10.1128/aac.34.7.1312. [DOI] [PMC free article] [PubMed] [Google Scholar]
- 4.Firsov A A, Nazarov A D, Chernykh V M. Advances in science and engineering. Vol. 17. Moscow, Russia: VINITI Publishers; 1989. Pharmacokinetic approaches to rational antibiotic therapy; pp. 1–228. . (In Russian.) [Google Scholar]
- 5.Firsov A A, Ruble M, Gilbert D, Savarino D, Manzano B, Medeiros A A, Zinner S H. Net effect of inoculum size on antimicrobial action of ampicillin-sulbactam: studies using an in vitro dynamic model. Antimicrob Agents Chemother. 1997;41:7–12. doi: 10.1128/aac.41.1.7. [DOI] [PMC free article] [PubMed] [Google Scholar]
- 6.Firsov A A, Savarino D, Ruble M, Gilbert D, Manzano B, Medeiros A A, Zinner S H. Predictors of effect of ampicillin-sulbactam against TEM-1 β-lactamase-producing Escherichia coli in an in vitro dynamic model: enzyme activity versus MIC. Antimicrob Agents Chemother. 1996;40:734–738. doi: 10.1128/aac.40.3.734. [DOI] [PMC free article] [PubMed] [Google Scholar]
- 7.Firsov A A, Shevchenko A A, Vostrov S N, Zinner S H. Inter- and intraquinolone predictors of antimicrobial effect in an in vitro dynamic model: new insight into a widely used concept. Antimicrob Agents Chemother. 1998;42:659–665. doi: 10.1128/aac.42.3.659. [DOI] [PMC free article] [PubMed] [Google Scholar]
- 8.Firsov A A, Vostrov S N, Shevchenko A A, Cornaglia G. Parameters of bacterial killing and regrowth kinetics and antimicrobial effect examined in terms of area under the concentration-time curve relationships: action of ciprofloxacin against Escherichia coli in an in vitro dynamic model. Antimicrob Agents Chemother. 1997;41:1281–1287. doi: 10.1128/aac.41.6.1281. [DOI] [PMC free article] [PubMed] [Google Scholar]
- 9.Hoffken G, Lode H, Prinzing C, Borner K, Koeppe P. Pharmacokinetics of ciprofloxacin after oral and parenteral administration. Antimicrob Agents Chemother. 1985;27:375–379. doi: 10.1128/aac.27.3.375. [DOI] [PMC free article] [PubMed] [Google Scholar]
- 10.Sanfilippo A, Mazzoleni L. Antibacterial activity of aminosidine and of beta-lactamic antibiotics. Farm Ed Prat. 1974;29:21–26. [PubMed] [Google Scholar]
- 11.Satta G, Cornaglia G, Foddis G, Pompei R. Evaluation of ceftriaxone and other antibiotics against Escherichia coli, Pseudomonas aeruginosa, and Streptococcus pneumoniae under in vitro conditions simulating those of serious infections. Antimicrob Agents Chemother. 1988;32:552–560. doi: 10.1128/aac.32.4.552. [DOI] [PMC free article] [PubMed] [Google Scholar]
- 12.Teng R, Harris S C, Nix D E, Schentag J J, Foulds G, Liston T E. Pharmacokinetics and safety of trovafloxacin (CP-99,219), a new quinolone antibiotic, following administration of single oral doses to healthy male volunteers. J Antimicrob Chemother. 1995;36:385–394. doi: 10.1093/jac/36.2.385. [DOI] [PubMed] [Google Scholar]
- 13.Wise R, Lister D, McNulty C A M, Griggs D, Andrews J M. The comparative pharmacokinetics of five quinolones. J Antimicrob Chemother. 1986;18(Suppl. D):71–81. doi: 10.1093/jac/18.supplement_d.71. [DOI] [PubMed] [Google Scholar]
- 14.Wise R, Mortiboy D, Child G, Andrews G M. Pharmacokinetics and penetration into inflammatory fluid of trovafloxacin (CP-99,219) Antimicrob Agents Chemother. 1996;40:47–49. doi: 10.1128/aac.40.1.47. [DOI] [PMC free article] [PubMed] [Google Scholar]


