

Abstract
Epigenetic programs are dysregulated in acute myeloid leukemia (AML) and help enforce an oncogenic state of differentiation arrest. To identify key epigenetic regulators of AML cell fate, we performed a differentiation-focused CRISPR screen in AML cells. This screen identified the histone acetyltransferase KAT6A as a novel regulator of myeloid differentiation that drives critical leukemogenic gene expression programs. We show that KAT6A is the initiator of a newly-described transcriptional control module in which KAT6A-catalyzed promoter H3K9ac is bound by the acetyllysine reader ENL, which in turn cooperates with a network of chromatin factors to induce transcriptional elongation. Inhibition of KAT6A has strong anti-AML phenotypes in vitro and in vivo, suggesting that KAT6A small molecule inhibitors could be of high therapeutic interest for mono or combinatorial differentiation-based treatment of AML.
Keywords: Acute myeloid leukemia, epigenetics, CRISPR screen, KAT6A, H3K9ac
Introduction
Acute myeloid leukemia (AML) is one of the most deadly hematological malignancies, and the majority of diagnosed patients will die from their disease (1,2). Chemotherapy is standard-of-care, but therapeutic regimens have not changed dramatically in several decades and are often poorly tolerated (3). Accordingly, there is an outstanding need for novel AML treatments.
Though genetically heterogenous, all AMLs are characterized by differentiation blockade, which enables their continual self-renewal and proliferation (4–6). While chemotherapy aims to eliminate AML cells by directly inducing cell death or cell cycle arrest, differentiation therapy provides an alternative in which self-renewal is depleted by inducing myeloid maturation programs, thereby extinguishing proliferation (4). This approach is curative in the promyelocytic AML subtype (APL) and promising in IDH-mutant AMLs, but has not been successful in other subtypes (4,7–9). To expand the applicability of differentiation therapy, it is critical to understand the mechanisms regulating AML cell fate decisions.
Epigenetic regulators are of marked importance for sustaining the transcriptional programs that drive AML differentiation arrest (10,11). In particular, numerous recent studies have highlighted the critical role of enhancer regulation in AML transcriptional control (12–15). For example, the acetyllysine-binding “reader” protein BRD4 is essential for maintaining the active state of enhancers and super enhancers that regulate expression of AML oncogenes such as MYC (16–19). In contrast, the H3K4me1/2 histone demethylase LSD1/KDM1A silences genes driving myeloid differentiation by inactivating their enhancers (20–24). However, while AML enhancer regulation has been studied in depth in recent years, comparatively fewer studies are focusing on the equally important process of promoter state regulation.
A recent breakthrough in AML promoter regulation was made by parallel studies that identified the YEATS domain protein ENL/MLLT1 as an H3K9ac and H3K27ac histone acetyllysine reader that promotes oncogenic transcription in AML (25,26). These studies uncovered an elegant chromatin regulatory “module” in which promoter-bound ENL recruits the Super elongation complex (SEC) to help release paused RNA Pol II and drive transcription of MYC and other AML oncogenes. While these studies showed how “reading” of promoter states can provide instructions for transcriptional elongation, the critical initiators of this module – the “writers” that provide acetyl substrates for ENL binding – remain to be identified.
CRISPR screening has emerged as an exciting method for using genetic screening logic to identify regulators of diverse phenotypes in mammalian cells (27,28). Several CRISPR “dropout” screens have been performed to identify regulators of AML cell survival and proliferation (29–32). Though effective for studies of cell growth and survival, these screens may miss the most critical regulators of AML cell fate.
Here, we designed a positive selection gain-of-differentiation CRISPR screen to identify chromatin regulators whose inhibition induces therapeutic differentiation of AML cells. This screen identified the H3K9 acetyltransferase KAT6A/MYST3/MOZ as a critical driver of AML stemness and proliferation. Through a combination of experimental and bioinformatic approaches, we show that KAT6A collaborates with ENL to drive a MYC-centric gene expression program by providing promoter H3K9ac for ENL binding. This work establishes an actionable KAT6A/ENL axis with implications for non-APL AML differentiation therapy.
Results
Epigenetic-focused CRISPR-Cas9 Screen Identifies KAT6A as an AML differentiation regulator
To identify novel epigenetic regulators of AML differentiation arrest, we designed a CRISPR-Cas9 screen based on selection of CD11b, a surface marker of myeloid differentiation (Figure 1A). We chose to use the human U937 cell line due to its large dynamic range of CD11b level and strong response to known differentiation-inducers such as LSD1 inhibitors (21), making it a robust model for initial identification of differentiation regulators. We transduced Cas9-expressing U937 cells with a custom sgRNA library targeting 904 chromatin regulators and RNA binding proteins. Nine days after transduction, cells were isolated by fluorescence-activated cell sorting (FACS) based on surface CD11b expression. Live CD11b-high (most differentiated), CD11b-low (least differentiated) and unsorted reference (bulk) groups were collected and deep-sequenced to measure sgRNA representations (Figure S1A–C and Supplementary Table 1). Comparing CD11b-high and CD11b-low groups, we identified 73 and 56 genes significantly enriched in each population, respectively, using the MAGeCK robust ranking algorithm (RRA) (33) (Figure 1B, Figure S1D and Supplementary Table 2). Strikingly, the top 14 hits identified in the CD11b-high group (corresponding to genes whose loss induces differentiation) all belong to genes encoding two protein complexes: The Mediator complex and LSD1/KDM1A-CoREST complexes, both of which are well-established repressors of AML differentiation (19–22). Other hits included EP300 and DOT1L, which have also been shown to have important roles in AML (34–36). These results confirm the validity of the screen and suggest that other high-scoring hits may represent novel differentiation regulators of significant importance for AML.
Figure 1. CRISPR-Cas9 screen identifies KAT6A as a differentiation regulator in AML.
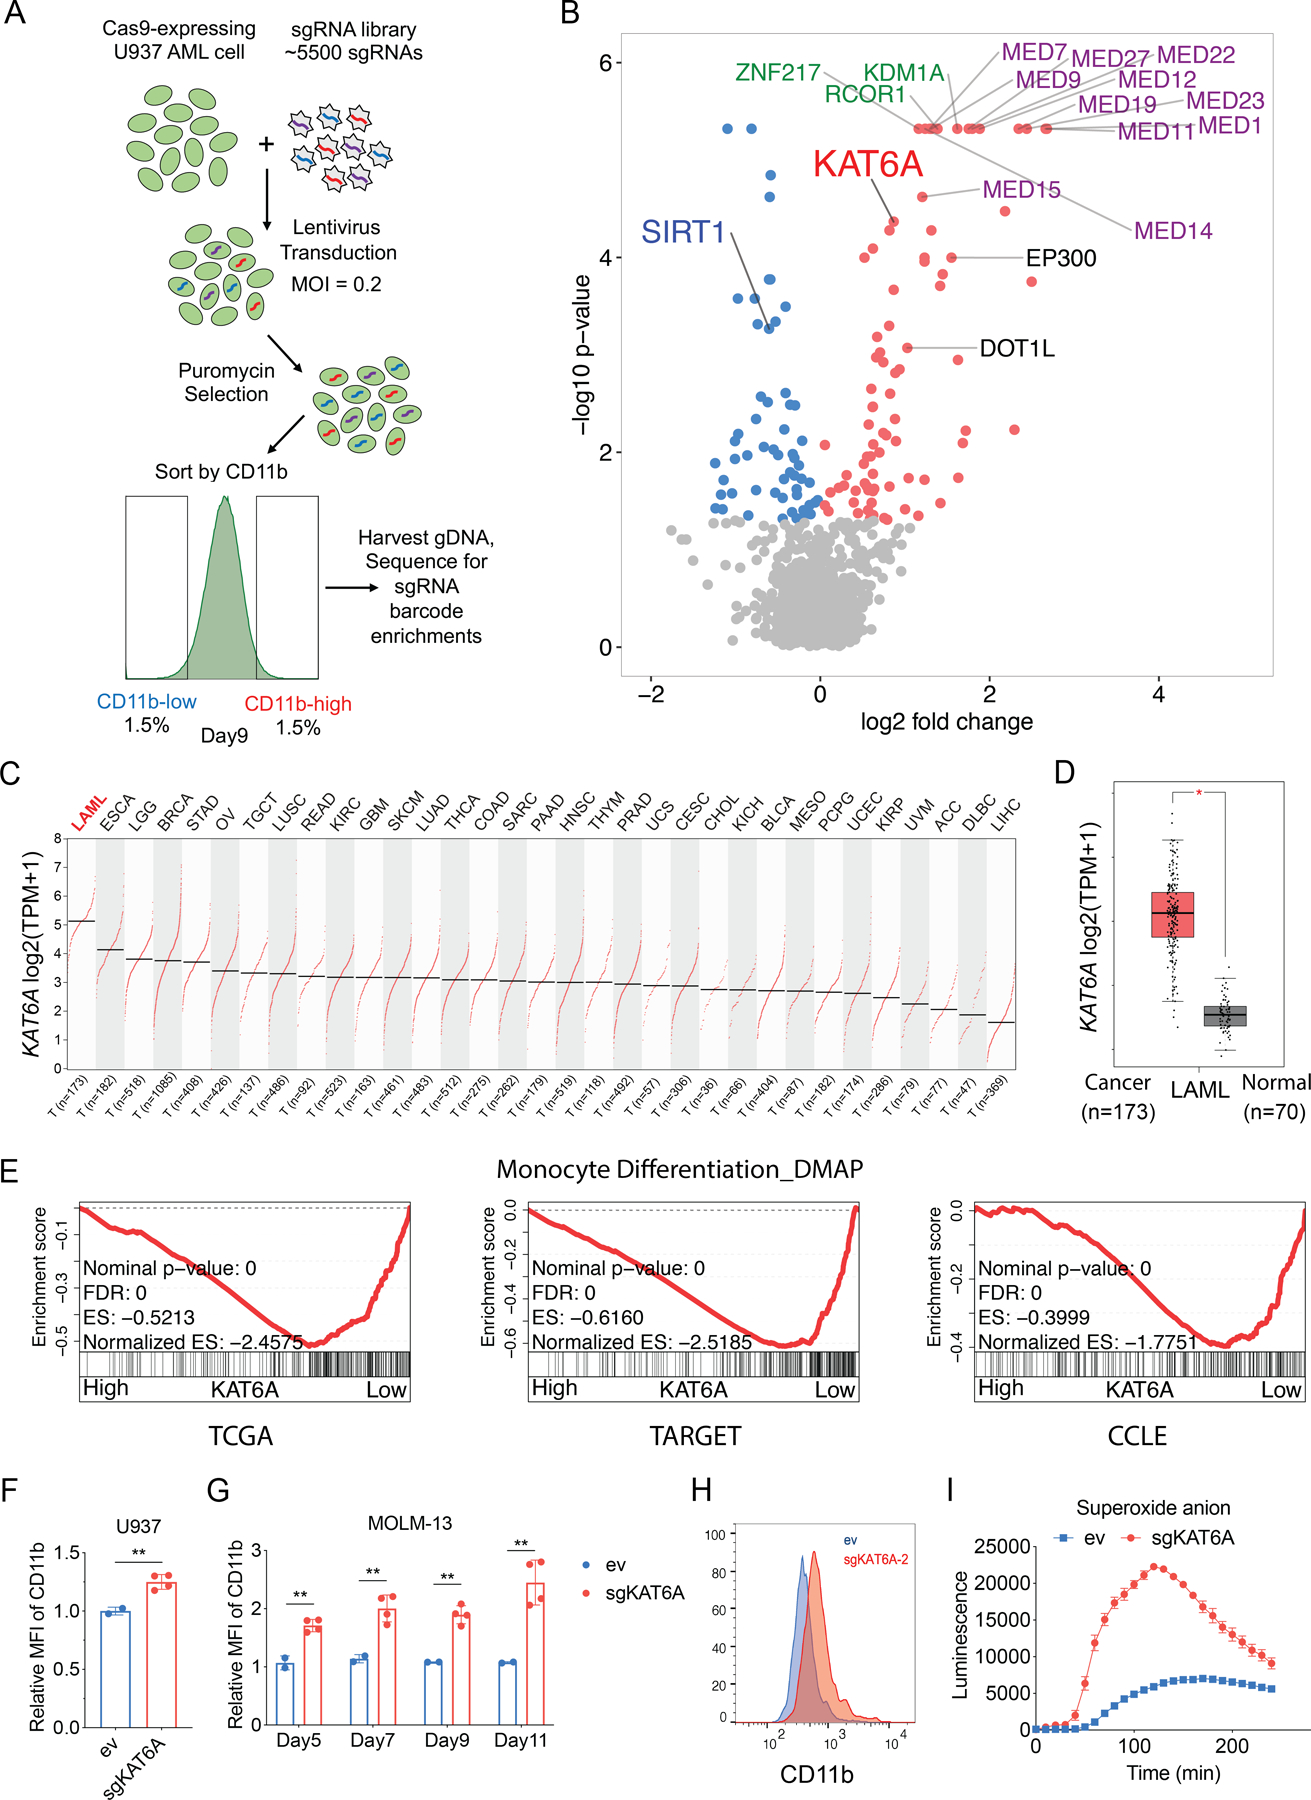
A, Schematic outline of CRISPR-Cas9 screen. MOI, multiplicity of infection; gDNA, genomic DNA. B, Volcano plot showing the top hits enriched in CD11b-low (blue) or CD11b-high (red) populations, with p-value < 0.05. Several top hits in Mediator complex (purple) and LSD1-CoREST complex (green) are highlighted. C, KAT6A expression levels in cancer types from TCGA, using the GEPIA online server. TPM, transcripts per million. T: tumor/cancer. D, Box plot comparing KAT6A expression levels between AML samples (from TCGA dataset) and matched normal samples (from TCGA and GTEx projects), using the GEPIA online server. E, Leading edge plot showing the enrichment of a monocyte differentiation gene set based on Gene Set Enrichment Analysis (GSEA) of KAT6A high-expressing (top 20%) and KAT6A low-expressing (bottom 20%) AML samples from TCGA (left), TARGET (center), and CCLE (right) datasets. FDR, false discovery rate. ES, enrichment score. F, Surface expression of CD11b after lentiviral transduction of empty vector (ev) and sgRNAs targeting KAT6A (sgKAT6A-1 and sgKAT6A-2) in U937 cells on Day 9 (n=2–4 in each group). MFI, mean fluorescence intensity. G, Surface expression of CD11b after lentiviral transduction of empty vector (ev) and sgRNAs targeting KAT6A (sgKAT6A-1 and sgKAT6A-2) in MOLM-13 cells on indicated days (n=2–4 each group). H, Representative flow cytometry histogram of surface CD11b expression in MOLM-13 cells on Day 9. I, Functional change in myeloid differentiation in MOLM-13 cells as measured by superoxide anion production. Statistical differences were calculated using unpaired Student’s t-test (D and F) and Multiple t-test (G). All error bars represent mean ± s.d (standard deviation), and p<0.05 was considered statistically significant, * indicates p<0.05, ** p<0.01, and *** p< 0.001. See also Figure S1.
We focused on the histone acetyltransferase KAT6A, a hit that has not been studied in-depth in AML. Not only was KAT6A among the top scoring genes in the differentiated (CD11b-high) group, SIRT1 – a deacetylase that can remove the same modifications catalyzed by KAT6A – was among the top hits in the undifferentiated (CD11b-low) group (Figure 1B and Figure S1E). As these two enzymes with opposing functions scored in the opposite phenotypic groups, we suspect that KAT6A/SIRT1-controlled histone acetylation might play an important role in regulating AML differentiation.
KAT6A (also known as MOZ, MYST3) is a MYST family histone acetyltransferase that can catalyze H3K9ac, H3K14ac, and H3K23ac (37,38). Interestingly, chromosomal translocations that fuse KAT6A to other genes (such as CREBBP/TIF2/EP300) are found to be driver events in AML (39–41). However, the function of wildtype KAT6A in AML has not been reported. To gain insight into whether KAT6A has a role in AML development and differentiation arrest, we first analyzed RNA-seq data from the TCGA (42) and TARGET (43) clinical cancer sample datasets, as well as from cancer cell lines and normal human tissue using the CCLE (Cancer Cell Line Encyclopedia) (44) and GTEx (Gene-tissue Expression) (45) databases, respectively. Analyzing TCGA data, we found that KAT6A has the highest expression in acute myeloid leukemia (LAML) across all cancer types (Figure 1C). Integrating GTEx and TCGA data, we also found that KAT6A expression is significantly higher in AML compared to matched normal tissue (Figure 1D). We then investigated transcriptional correlations between KAT6A and myeloid differentiation programs. Intriguingly, in the TCGA, TARGET, and CCLE databases, we observed that KAT6A high-expressing AML samples strongly repress the monocyte differentiation gene expression signature (46) (Figure 1E). These results are consistent with a role for KAT6A in promoting AML via opposing myeloid differentiation.
We next validated the screen results in multiple human AML cell lines with diverse genetic alterations: U937 (CALM-AF10 translocation), MOLM-13 and NOMO-1 (both MLL-AF9 translocation), MV4;11 (MLL-AF4 translocation), HL-60 (MYC amplified), and OCI-AML3 (DNMT3A and NPM1 mutation). Depletion of KAT6A by sgKAT6A was confirmed by sequencing of KAT6A locus (Figure S1F) and qPCR of KAT6A expression (Figure S1G). In all cases, surface expression of CD11b was increased upon depletion of KAT6A, indicating that screen results were not unique to U937 cells and that KAT6A may contribute to the AML differentiation block in a broad spectrum of AML backgrounds (Figure 1F–H, Figure S1H). Upregulation of surface CD86 was also confirmed following loss of KAT6A (Figure S1I–J). To validate functional cellular differentiation, we also observed a strong induction of superoxide anion production following KAT6A depletion (Figure 1I).
Together, these results suggest that KAT6A is a newly identified AML differentiation regulator.
Loss of KAT6A impairs AML stemness and proliferation in vitro and in vivo
To further confirm the role of KAT6A in blocking differentiation, we employed more functional assays for mitotic capacity and self-renewal. First, we tested whether KAT6A is a proliferation requirement in AML cells using negative-selection long-term growth competition assays. Human AML cell lines were transduced with GFP-expressing sgRNA vectors, and the ratio of GFP+ (transduced) to GFP- (non-transduced reference) cells was determined over three weeks (Figure 2A). Intriguingly, we found that in all three MLL-rearranged (MLL-r) cell lines used, sgKAT6A expressing cells were dramatically outcompeted by KAT6A-wildtype (WT) cells. The phenotype in MLL-r cells was even stronger than in U937 cells that were used for the screen, in which sgKAT6A expressing cells were outcompeted significantly but more gradually. In OCI-AML3 and HL-60 cells, which are also MLL wildtype, KAT6A depletion had minimal effects of proliferation. This is in line with results from a recently published series of genome-wide CRISPR-Cas9 screens in 14 human AML cell lines (30) in which loss of KAT6A, along with several other subunits of the KAT6A complex, was significantly more deleterious in MLL-r compared to MLL wildtype AML cells (Figure S2A).
Figure 2. KAT6A is required for AML growth in vitro and in vivo.
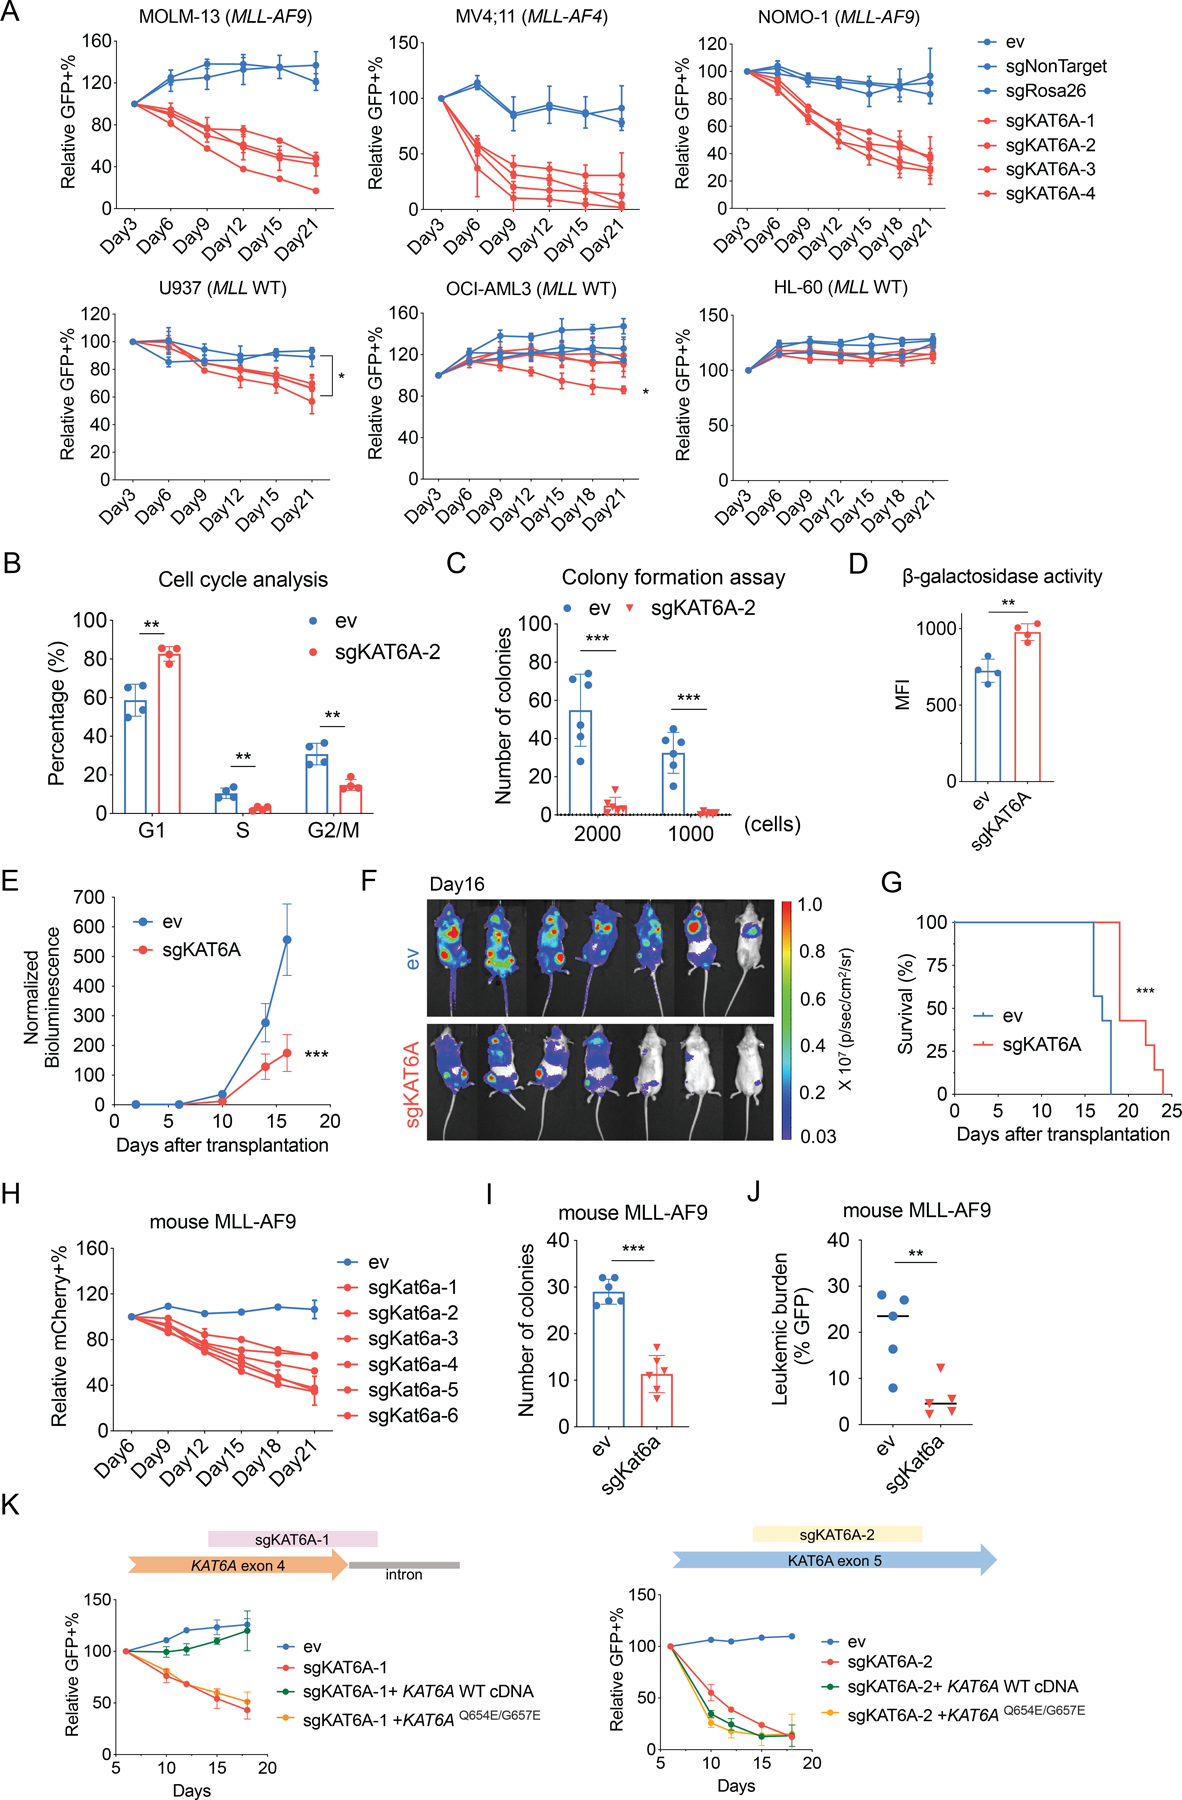
A, Negative-selection competition assay showing the percentage of GFP+ ev or sgKAT6A-transduced cells over time, normalized to Day3 (n=2–3 each group). B, Cell cycle analysis after 7 days of ev or sgKAT6A-2 transduction in MOLM-13 cells (n=4 each group). C, Count of colonies formed by 2000 or 1000 MOLM-13 cells after ev or sgKAT6A-2 transduction (n=6 each group). D, Senescence-associated β-galactosidase activity in MOLM-13 cells measured by flow cytometry (n=4 each group). MFI, mean fluorescence intensity. E, Quantification of bioluminescence of mice transplanted with ev or sgKAT6A MOLM-13-luc cells over time, normalized to Day2 (n=7 each group). F, Bioluminescent images of mice transplanted with ev or sgKAT6A MOLM-13-luc cells on Day16 (n=7 each group). G, Kaplan-Meier survival plot of mice transplanted with ev or sgKAT6A MOLM-13-luc cells (n=7 each group). H, Negative-selection competition assay showing the percentage of mCherry+ ev or sgKat6a-transduced cells over time, normalized to Day6 (n=2 each group). I, Count of colonies formed by 1000 mouse MLL-AF9 cells after ev or sgKat6a-6 transduction (n=6 each group). J, Leukemia burden quantified by the ratio of GFP+ mouse MLL-AF9 cells in the bone marrow of mice 3 weeks post transplantation (n=5 each group). K, Negative-selection competition assay in MOLM-13 cells showing the percentage of GFP+ ev or sgKAT6A-transduced cells normalized to Day 6, following overexpression of indicated KAT6A cDNA constructs. Statistical differences were calculated using two-way ANOVA with multiple comparisons (A and E), Multiple t-test (B and C), unpaired Student’s t-test (D, I, and J), and log-rank test (G). Error bars in (E) represent mean ± s.e.m. (standard error of mean), and error bars in all other panels represent mean ± s.d. p<0.05 was considered statistically significant, * indicates p<0.05, ** p<0.01, and *** p< 0.001. See also Figure S2.
We evaluated the role of KAT6A in MLL-r AML in more depth. Consistent with the proliferation phenotypes, we found that loss of KAT6A induced cell cycle arrest (Figure 2B) and moderately elevated apoptosis levels in the MLL-r cell lines MOLM-13 and MV4;11 (Figure S2B). Importantly, KAT6A depletion also markedly impaired clonogenic potential of MOLM-13 cells, confirming the importance of KAT6A in self-renewal (Figure 2C). KAT6A is known to inhibit senescence via the INK4A-ARF pathway (47,48). Consistent with these studies, we also observed that loss of KAT6A induced an increase in β-galactosidase activity – a marker of senescence (Figure 2D).
We then tested the effect of KAT6A depletion on AML progression in vivo. We transduced luciferase-GFP-labeled MOLM-13 cells with mCherry-linked sgKAT6A or empty vector constructs, and 48 hours later isolated successfully transduced cells (GFP+ mCherry+) via FACS and injected them into sublethally irradiated NSG mice. Leukemic burden was then quantified every 2–4 days by in vivo bioluminescent imaging (BLI). Up to 6 days post-injection, no differences in disease progression were observed between mice receiving control and KAT6A-knockout (KO) cells, suggesting their equivalent engraftment and initial in vivo growth (Figure S2C). However, after day 6, KAT6A-KO cell growth slowed significantly, and disease burden lagged progressively more behind mice receiving control cells until endpoints were reached (Figure 2E–F). Notably, leukemia cells recovered from sgKAT6A mice at the experiment endpoint were found to be around 70% mCherry negative, corresponding to non-transduced, KAT6A-WT cells (Figure S2D). In contrast, only less than 5% of the originally injected cells were mCherry negative (cells that inadvertently passed the mCherry positive FACS gate). This suggests that disease burden in sgKAT6A mice was in fact primarily generated by more rapidly-growing KAT6A-WT cells. Ultimately, KAT6A depletion significantly extended mouse survival (Figure 2G), confirming that the importance of KAT6A in AML is conserved in vivo.
To expand our findings to primary mouse models, we also validated the role of KAT6A in Cas9-expressing mouse MLL-AF9 cells, a cell line generated by retroviral transduction of Mll-Af9 fusion gene in mouse bone marrow cells. Similar to human MLL-r cells, sgKat6a mouse cells were outcompeted by WT cells in competition assay (Figure 2H) and showed impaired clonogenic potential (Figure 2I), while an MLL-WT mouse primary cell model Cas9-AML1-ETO (49) is not sensitive to KAT6A depletion (Figure S2E). After in vivo transplantation of mouse MLL-AF9 cells, we also observed remarkable delay in leukemia progression in mice receiving Kat6a-KO cells. (Figure 2J).
Taken together, these results suggest that KAT6A is important for maintaining AML both in vitro and in vivo.
Enzymatic function of KAT6A is required for AML growth
As an acetyltransferase, the role of KAT6A in AML could be dependent on its enzymatic activity, its structural function, or both. To test the importance of KAT6A catalytic activity, we attempted to rescue the sgKAT6A proliferation phenotype with cDNA expression of wildtype KAT6A or catalytic dead KAT6AQ654E/G657E in which the Q654E and G657E point mutations completely abrogate KAT6A acetyltransferase activity (50). We found that WT KAT6A, but not mutant KAT6AQ654E/G657E, fully rescued the growth defect of cells expressing a KAT6A sgRNA that only targeted endogenous protein by spanning an exon-intron junction (Figure 2K and Figure S2F). As expected, neither WT or mutant KAT6Arescued the phenotype of a KAT6A sgRNA that targeted both the endogenous and exogenous protein. These results demonstrate that acetyltransferase activity is essential for KAT6A to maintain AML growth.
Loss of KAT6A disrupts MYC-related transcriptional programs
We sought to understand the molecular mechanism underlying KAT6A-controlled AML growth and differentiation. Given the importance of KAT6A acetyltransferase activity and the role of histone acetylation in gene activation, we hypothesized that KAT6A might be driving AML oncogene expression via histone acetylation.
To identify potential transcriptional targets of KAT6A, we performed RNA-sequencing (RNA-seq) of KAT6A-WT versus KAT6A-KO MOLM-13 cells (Figure S3A). Among the significantly down-regulated genes following KAT6A depletion, we found several of the most critical drivers of leukemogenesis, including MYC, MYB, and FLT3, as well as other more recently identified genes of interest such as the MLL-fusion target gene LAMP5 (51) (Figure 3A). Consistent with the induction of myeloid differentiation (Figure 1G), we also observed up-regulation of ITGAM (gene encoding CD11b), CSF1R, and CD86. On the pathway level, Gene set enrichment analysis (GSEA) revealed a gain of myeloid differentiation-related signatures (46,52) and loss of the leukemia stem cell (LSC) signature (53) upon KAT6A KO (Figure 3B and Figure S3B). In line with the observed growth defects, the most dramatically down-regulated gene sets included cell cycle-related gene signatures and MYC target genes, with the most repressed signature overall being the combined hallmark MYC targets gene set (NES = −3.718; Figure 3C and Figure S3C). Finally, motif analysis predicted enrichment of MYC and E2F DNA binding motifs in promoters of those down-regulated genes, while motifs of hematopoietic transcription factors PU.1 and IRF8 were enriched in up-regulated gene promoters, consistent with myeloid lineage maturation (Figure 3D and Figure S3D).
Figure 3. Loss of KAT6A disrupts MYC-related transcriptional programs.
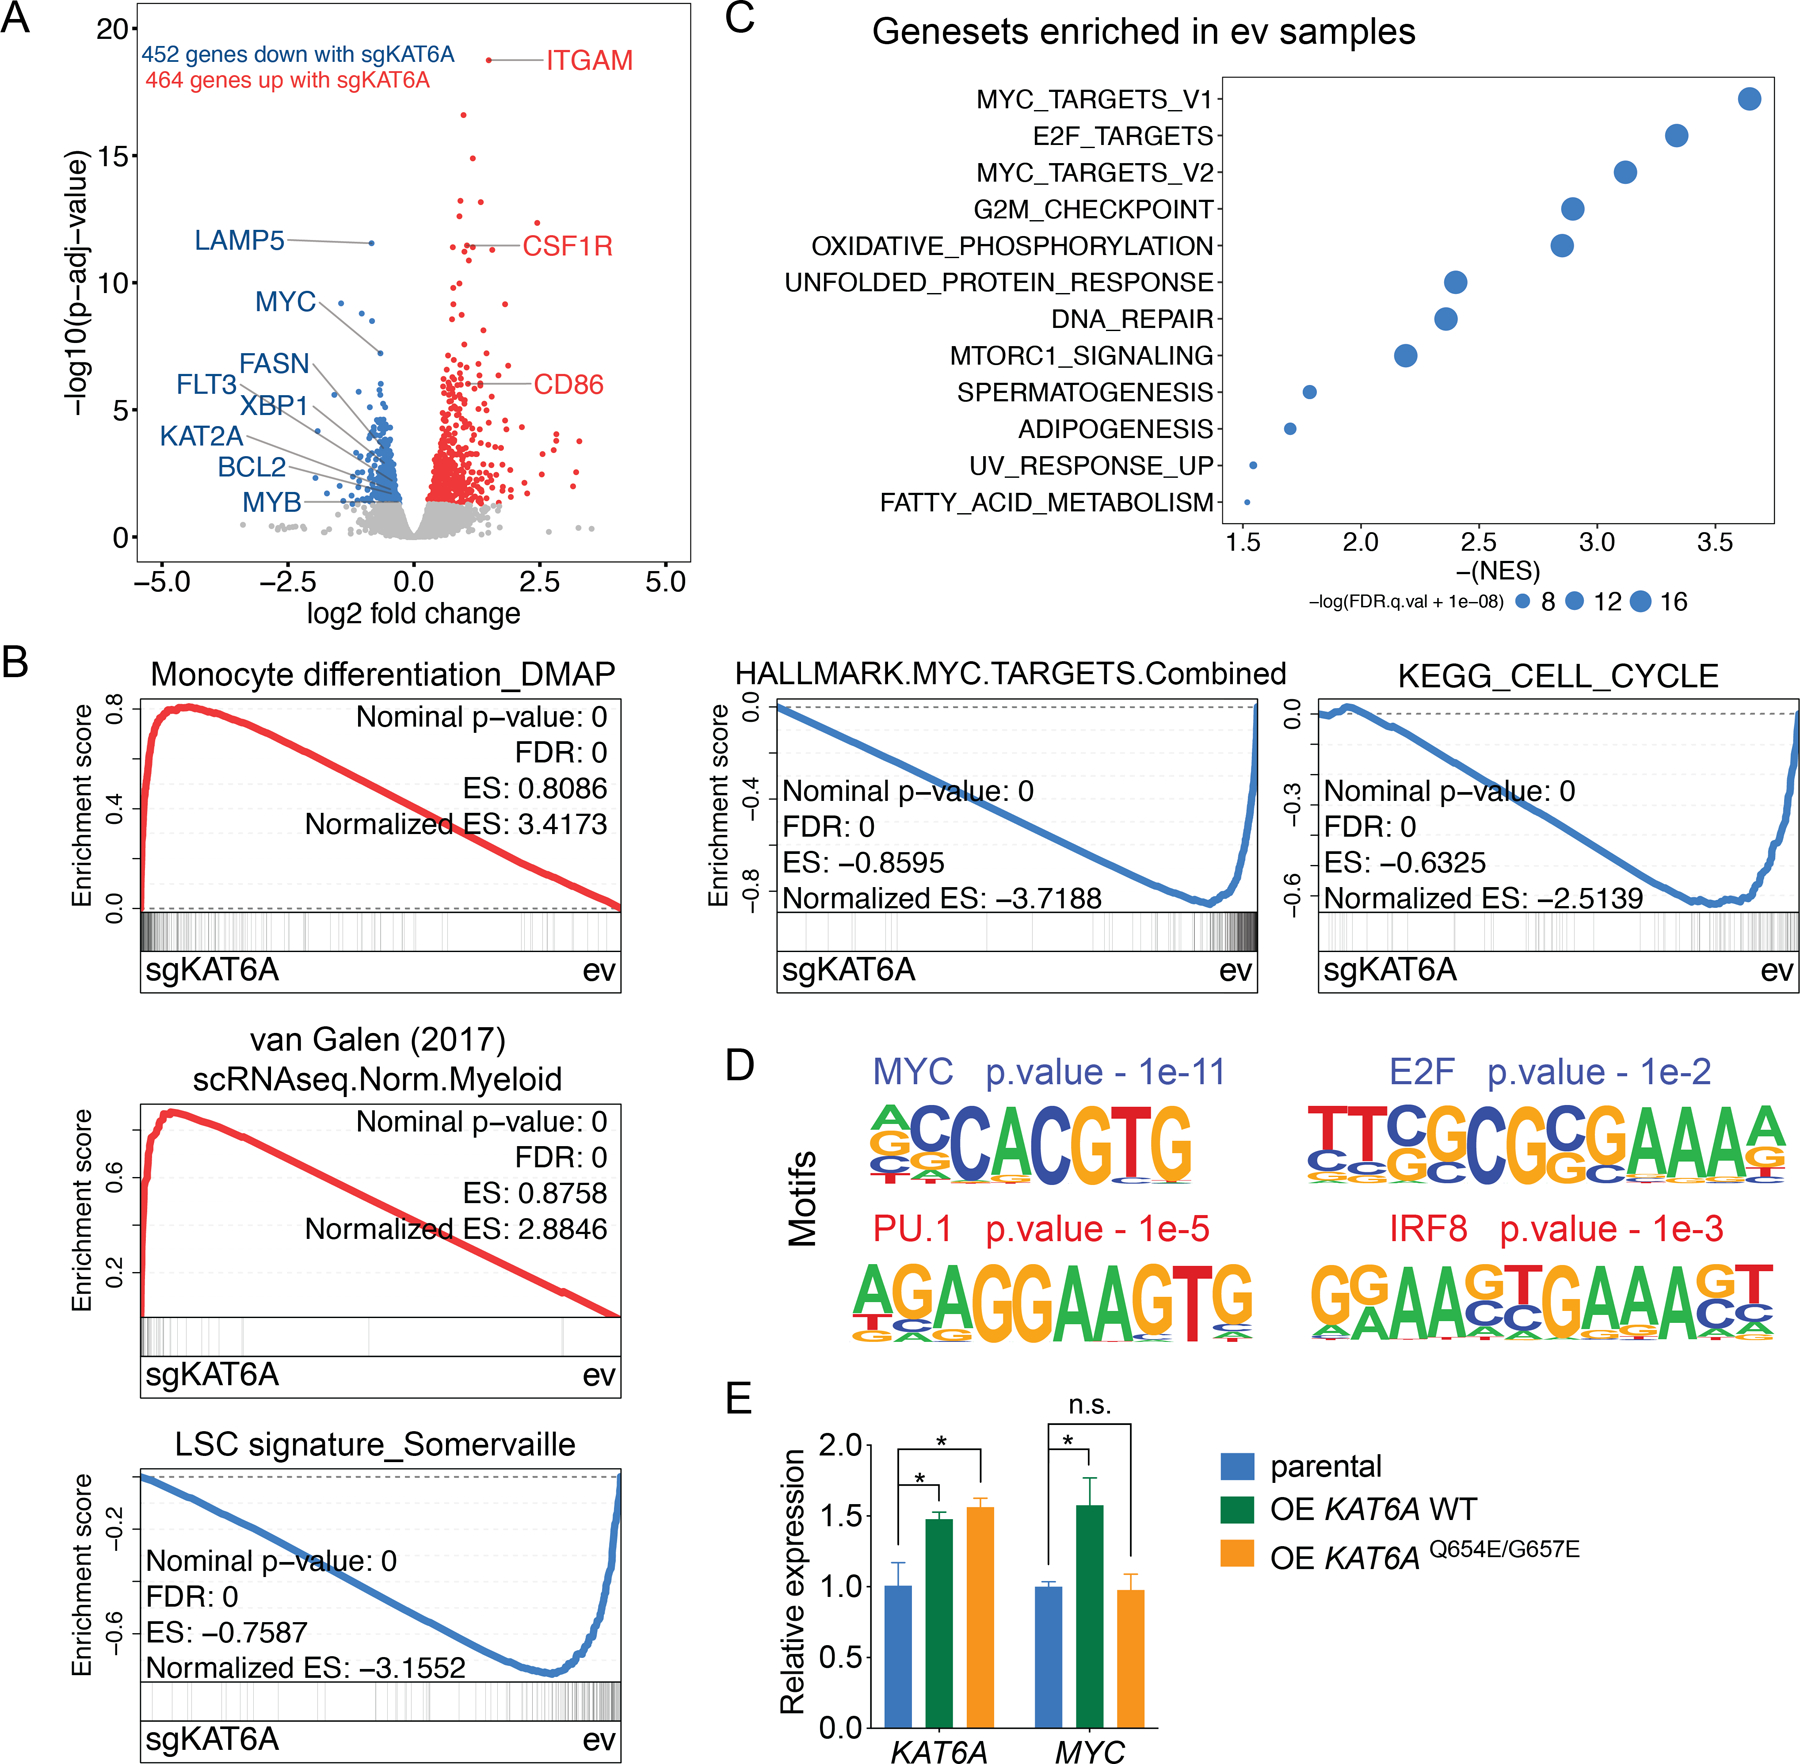
A, Volcano plot showing the differentially expressed genes between ev and sgKAT6A-2 transduced MOLM-13 cells 5 days post viral transduction. Genes with p.adj< 0.05 are highlighted (blue: genes down-regulated in sgKAT6A cells, red: genes up-regulated in sgKAT6A cells). B, Leading edge plot showing the enrichment of indicated gene sets based on GSEA (blue: gene set enriched in ev cells, red: gene set enriched in sgKAT6A cells). C, Top enriched hallmark gene sets in ev cells based on GSEA (top). Representative leading-edge plots of combined hallmark MYC target (V1+V2) gene set (bottom-left), and KEGG cell cycle gene set (bottom-right). D, Top transcription factor motifs enriched in transcription start site (TSS) regions (−1Kb to +300bp) of sgKAT6A down-regulated genes (blue) and sgKAT6A up-regulated genes (red). E, mRNA expression of KAT6A and MYC in parental MOLM-13 cells or with indicated constructs. OE, overexpression. Statistical differences were calculated using one-way ANOVA with multiple comparisons (E). All error bars represent mean ± s.d. and p<0.05 was considered statistically significant, * indicates p<0.05, n.s. not significant. See also Figure S3.
As our RNA-seq data suggest that KAT6A may help drive a critical MYC-focused transcriptional program, we aimed to further confirm KAT6A-mediated activation of MYC with orthogonal methods. First, we inhibited KAT6A via shRNA knockdown in several cell lines and observed MYC downregulation in all cases, including in non-MLL-r U937 cells, indicating that MYC regulation by KAT6A is not due to sgRNA off-target effects, and is not limited to MOLM-13 cells (Figure S3E–F). Western blot also showed MYC downregulation on protein level following KAT6A depletion (Figure S3G). Overexpression of MYC in KAT6A-KO cells partially rescued the growth phenotype (Figure S3H). We then tested whether exogenous overexpression of KAT6A would further upregulate MYC. Indeed, we found that overexpression of WT KAT6A, but not catalytic dead KAT6AQ654E/G657E, increased MYC expression (Figure 3E).
Consistent with the results in human cell lines, in mouse MLL-AF9 cells, Kat6a-KO also resulted in downregulation in Myc expression (Figure S3I).
Given that MYC is a master transcription factor in promoting leukemogenesis, these results suggest that MYC activation may represent a key mechanism by which KAT6A sustains oncogenic gene expression programs in AML.
KAT6A regulates H3K9ac on key leukemogenic genes
KAT6A can catalyze H3K9ac, H3K14ac, and H3K23ac (38). We wondered which, if any, of these histone acetylation modifications are involved in KAT6A-regulated leukemogenic gene expression. Western blots showed a modest global reduction of H3K9ac upon KAT6A depletion, but no apparent changes in H3K14ac and H3K23ac (Figure 4A and Figure S4A). To investigate locus-specific histone acetylation dynamics, we performed Chromatin Immunoprecipitation sequencing (ChIP-seq) of each of these histone modifications in WT and KAT6A-KO MOLM-13 cells (Figure S4B, C and Supplementary Table 3). We also performed HA-KAT6A ChIP-seq in WT cells to identify KAT6A direct binding sites (Supplementary Table 4). We found that HA-KAT6A binding is extremely specific (>90% of peaks) to promoters (Figure 4B), and highly overlapping with H3K9ac, H3K14ac, and H3K23ac peaks (Figure 4C). However, while co-occurrence of HA-KAT6A and these three modifications was common, the enrichment magnitude of H3K9ac at HA-KAT6A binding sites was far stronger than that of H3K14ac or H3K23ac (Figure 4C). Notably, H3K9ac was also the most responsive to KAT6A-KO at HA-KAT6A binding sites (Figure 4D). 245 H3K9ac peaks that overlapped HA-KAT6A peaks were decreased upon KAT6A-KO, and only 6 were increased. In contrast, fewer than 20 such H3K14ac or H3K23ac peaks were changed upon KAT6A depletion (Figure 4D). Furthermore, HA-KAT6A was highly enriched at genomic loci that lost H3K9ac following depletion of KAT6A, but showed no enrichment at regions where H3K9ac increased (Figure S4D).
Figure 4. KAT6A regulates H3K9ac on key leukemogenic genes.
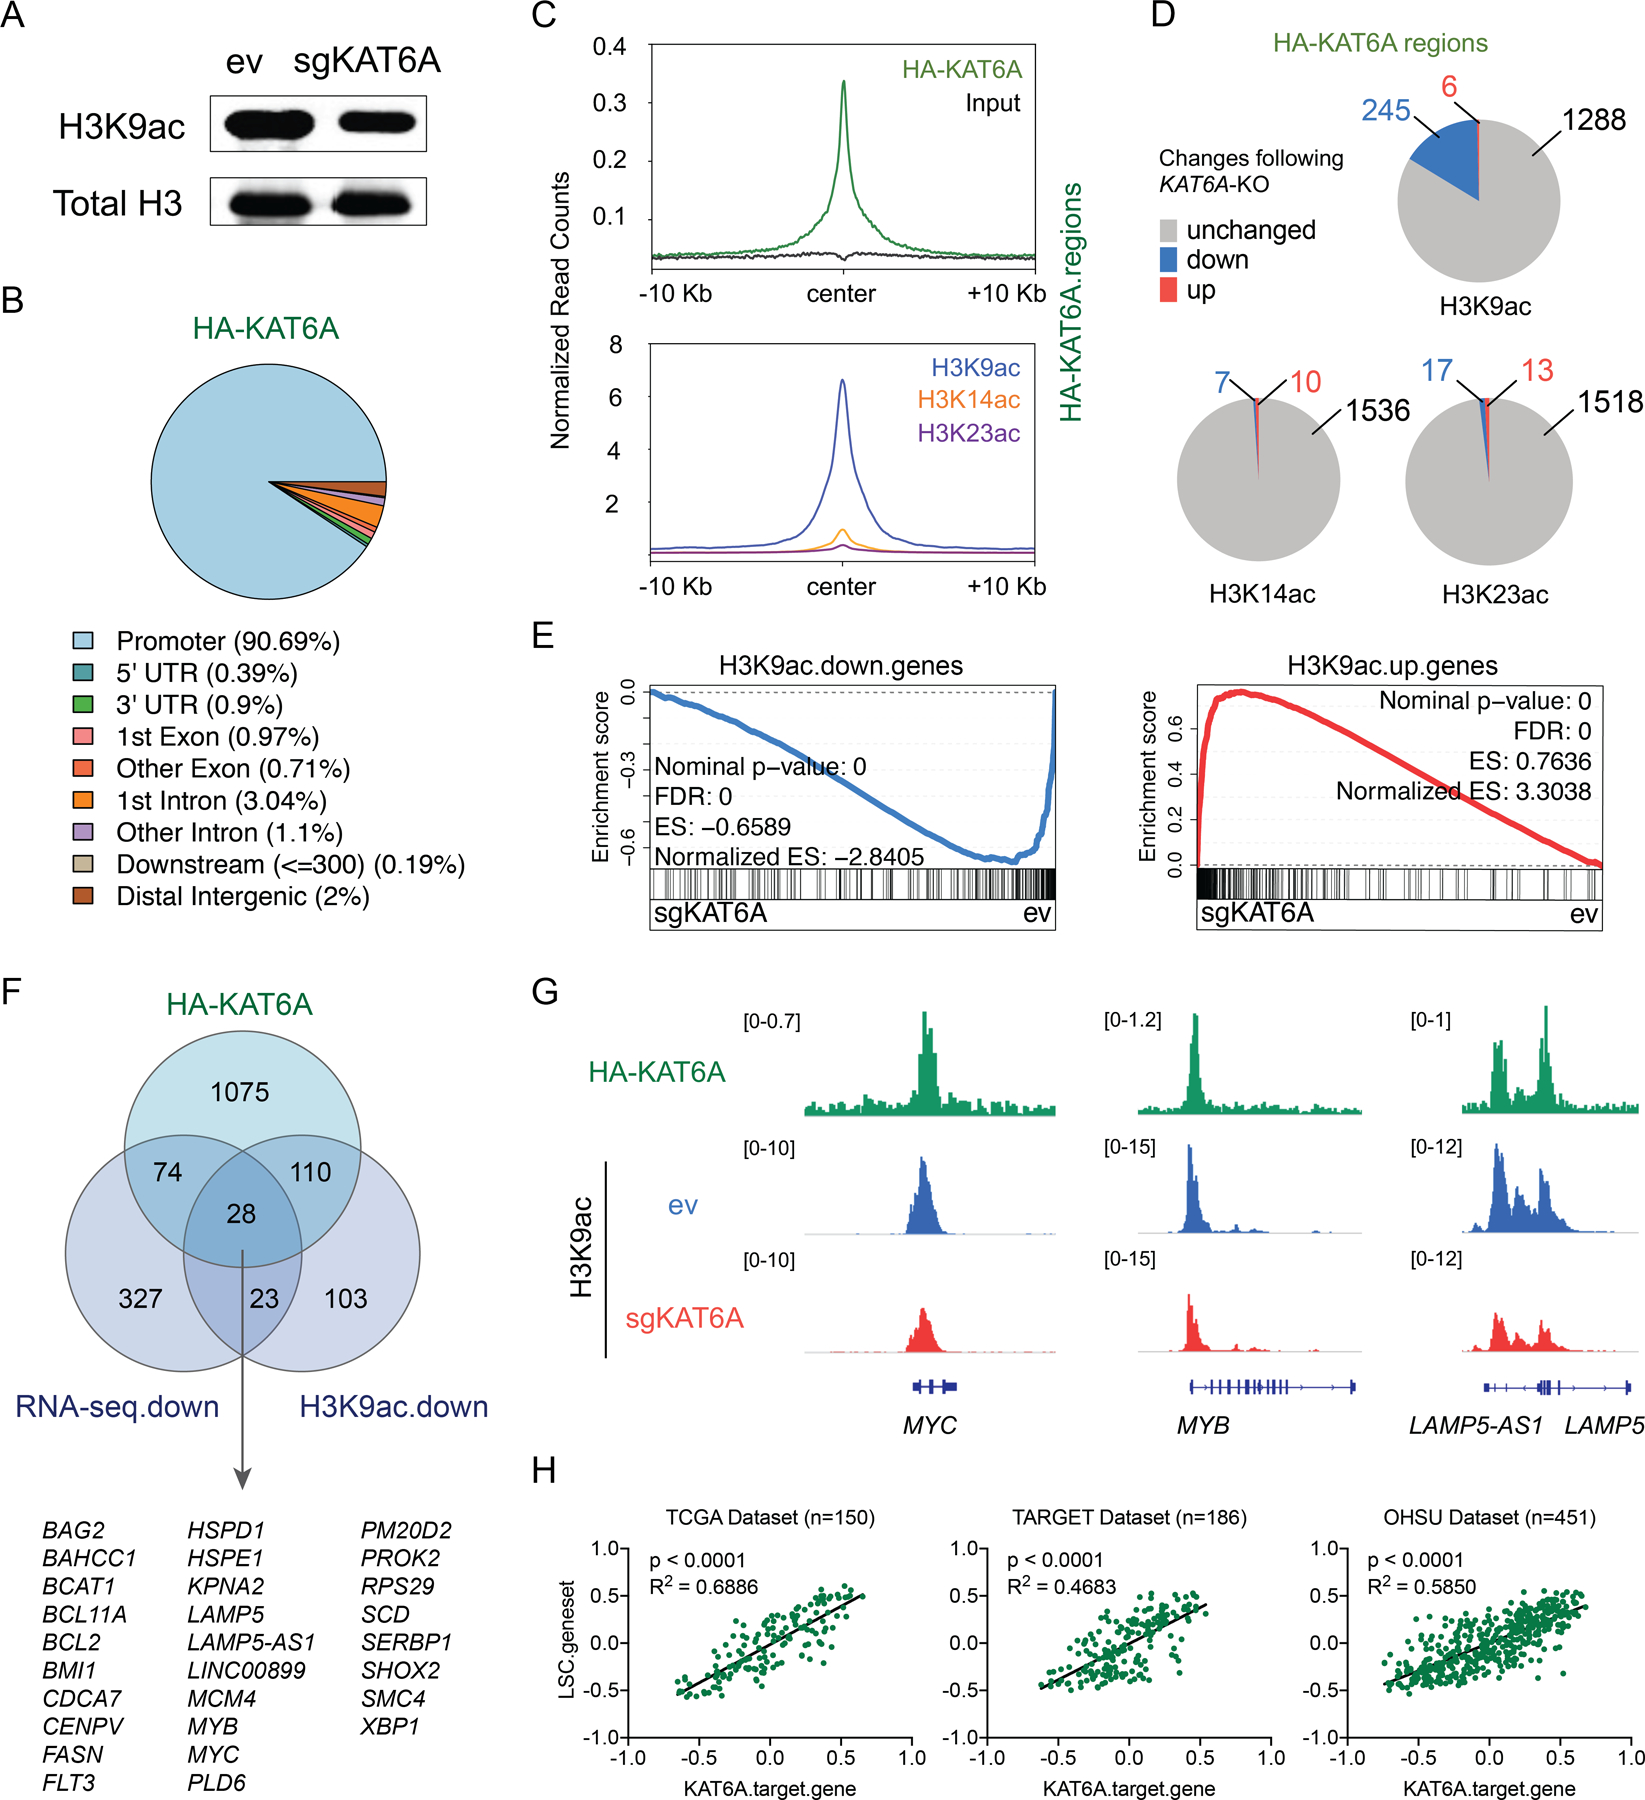
A, Western blot of H3K9ac and total H3 in ev and sgKAT6A-2 transduced MOLM-13 cells 5 days post viral transduction. B, Pie chart showing genomic annotations of HA-KAT6A ChIP-seq peaks. C, Distribution of normalized ChIP-seq reads for HA-KAT6A (up) and indicated histone marks (bottom) centered on HA-KAT6A peaks. D, Pie charts showing changes (p<0.05) of histone acetylation marks at genomic regions where HA-KAT6A intersects with histone acetylation marks. E, Leading edge plot showing the enrichment of genes associated with H3K9ac down-regulated or up-regulated regions based on GSEA of ev and sgKAT6A samples. F, Venn diagram showing the overlap of HA-KAT6A bound genes, genes downregulated with sgKAT6A (p.adj<0.05) and genes associated with H3K9ac down-regulated regions (p<0.05). G, Genome tracks showing HA-KAT6A and H3K9ac ChIP-seq occupancy at indicated gene loci. H, Pearson’s correlation of sample-wise KAT6A target gene set enrichment scores and LSC gene set enrichment scores calculated by Gene Set Variation Analysis (GSVA). Each dot represents one sample from TCGA, TARGET, or OHSU datasets. See also Figure S4.
We next investigated the relation between acetylation dynamics and transcription. Upon KAT6A depletion, we found that loss or gain of H3K9ac – but not H3K14ac or H3K23ac - was strongly associated with transcriptional downregulation or upregulation, respectively (Figure 4E and Figure S4E). We then identified gene pathways (54) and transcription factor binding motifs associated with H3K9ac dynamics. Cell cycle regulators and MYC activity, as well as E2F and MYC motifs, were enriched in genes losing H3K9ac in response to KAT6A-KO. Genes gaining H3K9ac also showed dramatic enrichment of myeloid differentiation signatures and related TF motifs, such as PU.1, IRF8, and several ETS factors (Figure S4F–G), consistent with transcriptional changes following KAT6A deletion. Together, these findings strongly implicate H3K9ac, rather than H3K14ac or H3K23ac, as the key catalytic target of KAT6A in its role as a driver of stemness and proliferation gene expression programs in AML.
To define the potential KAT6A direct target genes, we focused on 28 genes that meet all three criteria: HA-KAT6A direct binding, loss of H3K9ac upon KAT6A depletion, and transcriptional down-regulation upon KAT6A depletion (Figure 4F). This “core KAT6A target gene set” was markedly enriched for key leukemogenic genes, including MYC, MYB, and LAMP5 (Figure 4F). Additional manual inspection uncovered strong trends in other key KAT6A targets not initially identified in this core gene set, such as HOXA9 and MEIS1. We further confirmed through qPCR that KAT6A regulates these genes as well (Figure S4H). Notably, H3K9ac reductions were almost exclusively observed at promoters of these KAT6A target genes, rather than distal regulatory elements (Figure 4G, Figure S4C and Figure S4I). We then explored the relevance of this core gene set to AML in the clinical context, and we found a remarkably strong correlation between expression levels of KAT6A target genes and LSC (leukemia stem cell) genes (53) in TCGA, TARGET, and OHSU (55) patients (Figure 4H). Importantly, the core KAT6A target gene set and LSC gene set have only two overlapping genes (Figure S4J), indicating that this correlation is not due to the presence of shared genes, but is indeed a real interrelationship between two independent gene sets. Finally, we also found that KAT6A target gene levels are inversely correlated with cell differentiation status in a genetically defined, dox-induced AML differentiation model (56) (Figure S4K).
Collectively, these data suggest that KAT6A drives expression of a core oncogenic program through maintaining promoter H3K9ac.
The H3K9ac reader ENL is a downstream effector of KAT6A
To further understand the function of KAT6A in AML, we explored the Cancer Dependency Map (DepMap) (57,58), a database of results from genome-wide CRISPR/Cas9 and RNAi dropout (proliferation/survival) screens performed in hundreds of cancer cell lines. We queried KAT6A co-dependencies, which are genes with high correlation to KAT6A in degree of essentiality (i.e. dropout scores) across all cell lines. High co-dependency is suggestive of common functionality, such as membership in the same protein complex or signaling pathway. Encouragingly, the top KAT6A co-dependency in the CRISPR screen database was BRPF1, which encodes the core structural component of the KAT6A complex. KAT6B, a homolog of KAT6A, was also among the top KAT6A co-dependent genes (Figure 5A). Intriguingly, among the top KAT6A co-dependencies in both the CRISPR and RNAi screen databases we found MLLT1 (ENL) (Figure 5A and Figure S5A), a protein that binds H3K9ac, H3K27ac, and other histone acyl modifications, and is essential in maintaining oncogenic gene expression in AML (25,26). As ENL “reads” H3K9ac and sustains MYC expression in leukemia cells, this finding implicates the possibility of a “writer-reader” module in which KAT6A provides the H3K9ac that is bound by ENL to promote transcription at oncogene promoters.
Figure 5. The H3K9ac reader ENL is a downstream effector of KAT6A.
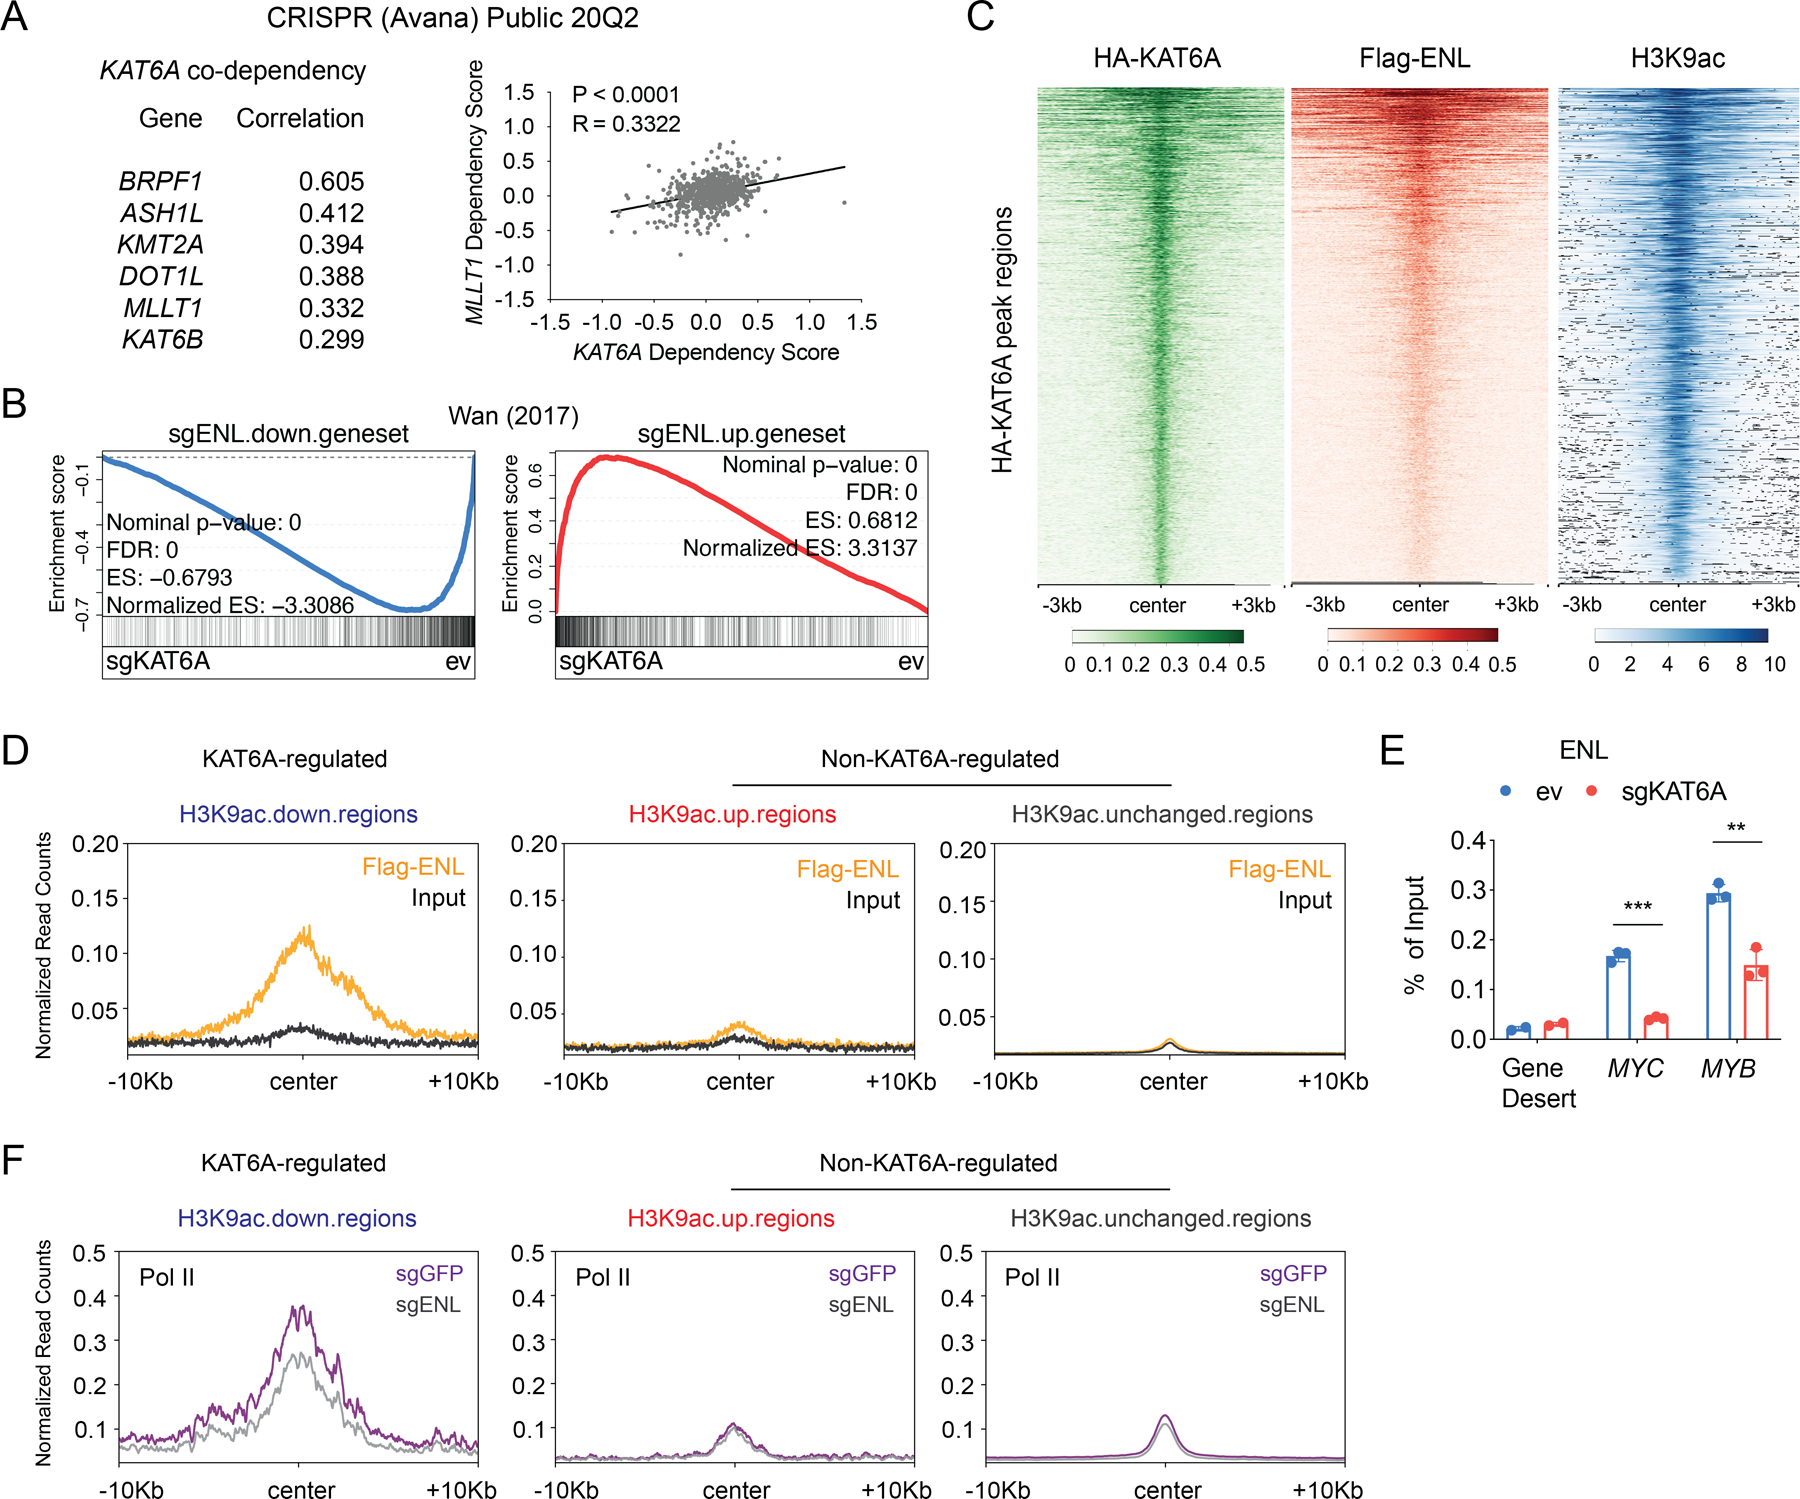
A, Cancer dependency map (DepMap) CRISPR Public 20Q2 dataset showing the top co-dependent genes with KAT6A and their Pearson’s correlation scores (left). Correlation of KAT6A and MLLT1 (ENL) dependency scores are presented (right). Each dot represents a cell line. B, Leading edge plot showing the enrichment of genes down-regulated or up-regulated by sgENL in MOLM-13 cells (data from GSE80774) based on GSEA of ev and sgKAT6A samples. C, Heatmaps showing ChIP-seq signals of HA-KAT6A, Flag-ENL (data from GSE80779), and H3K9ac centered on HA-KAT6A peaks in MOLM-13 cells. D, Distribution of normalized ChIP-seq reads for Flag-ENL in MOLM-13 cells (data from GSE80779) centered on H3K9ac down-regulated, up-regulated, or unchanged regions. E, ChIP-qPCR of ENL at gene desert, MYC (TSS+1Kb) and MYB (TSS+2Kb) loci after 5 days of ev and sgKAT6A-2 transduction in MOLM-13 cells. F, Distribution of normalized ChIP-seq reads for RNA Pol II with sgGFP or sgENL in MOLM-13 cells (data from GSE80779) centered on H3K9ac down-regulated, up-regulated, or unchanged regions. Statistical differences were calculated using Multiple t-test (E). All error bars represent mean ± s.d. and p<0.05 was considered statistically significant, * indicates p<0.05, ** p<0.01, and *** p< 0.001. See also Figure S5.
If KAT6A and ENL function cooperatively in AML, we would expect them to regulate similar genes and co-localize at key oncogenic loci. To test this hypothesis, we integrated our RNA-seq and ChIP-seq data with published ENL epigenomic datasets, as MOLM-13 cells were used in both cases. We first interrogated RNA-seq data and found that loss of ENL and KAT6A induce highly concordant transcriptional changes (Figure 5B). We then investigated chromatin occupancy, and found that HA-KAT6A, Flag-ENL, and H3K9ac are all strongly co-localized on chromatin (Figure 5C). In fact, nearly half (567/1334) of the Flag-ENL peaks are overlapping with HA-KAT6A-localized genomic regions, representing a remarkable degree of “writer-reader” colocalization (Supplementary Tables 4, 5, 6). It is possible that, as an H3K9ac reader, ENL may co-localize with any set of H3K9ac peaks. To determine if ENL binding is specific to KAT6A-regulated H3K9ac, we analyzed Flag-ENL binding at H3K9ac loci that either decreased after KAT6A KO (i.e., KAT6A-regulated H3K9ac) or increased/unchanged after KAT6A KO (i.e., non-KAT6A-regulated H3K9ac). We found that Flag-ENL was highly enriched at loci that lost H3K9ac upon KAT6A depletion but showed no enrichment at regions where H3K9ac were increased/unchanged after KO (Figure 5D). This suggests that ENL preferentially binds the subset of H3K9ac that is regulated by KAT6A.
We next tested whether ENL is dependent on KAT6A-catalyzed H3K9ac for chromatin binding. In accordance with our model, ChIP-seq revealed strong global loss of H3K9ac and ENL at KAT6A-binding sites following KAT6A depletion (Figure S5B). Besides global changes, we then used ChIP-qPCR to confirm our findings at key target genes MYC and MYB, and found marked reduction of ENL at both genes in KAT6A-KO cells (Figure 5E). These results suggests that ENL is evicted from chromatin upon loss of KAT6A-catalyzed H3K9ac.
ENL recruits transcriptional machinery to chromatin, and previous work (25) showed that loss of ENL reduces local RNA Pol II chromatin binding. We investigated whether KAT6A-regulated H3K9ac may initiate this program. We integrated Pol II ChIP-seq data from sgENL (ENL knockout) and sgGFP (ENL wildtype) MOLM-13 cells into our H3K9ac ChIP-seq datasets. We found that ENL depletion led to reduced Pol II binding at KAT6A-binding sites (Figure S5B). Intriguingly, reduction of Pol II binding occurred only at KAT6A-regulated H3K9ac regions, but other H3K9ac loci are minimally affected (Figure 5F). These results suggest a model in which KAT6A catalyzes promoter H3K9ac that is bound by ENL, which subsequently recruits Pol II to sustain AML oncogene expression and block differentiation.
Accordingly, we propose a “KAT6A-ENL-Pol II” axis that highlights the role of promoter H3K9ac in AML transcriptional control.
KAT6A influences a network of MLL-r AML-related chromatin and transcription regulators
Several lines of evidence suggest that a broader network of MLL-r AML-related transcriptional regulators may be ultimately dependent on KAT6A and its catalysis of H3K9ac. First, ENL, proposed here as downstream of KAT6A, recruits multiple MLL-r AML-related chromatin factors to oncogenic loci, such as CDK9 and DOT1L-catalyzed H3K79me2 and H3K79me3 (25,26,59). Second, several MLL-r AML-related factors were also found among the top five KAT6A co-dependencies in the DepMap, including KMT2A (MLL1), DOT1L and ASH1L (36,60) (Figure S5C). Finally, as shown earlier, MLL-r AMLs are more dependent on KAT6A than MLL-WT AMLs (Figure 2A and Figure S2A).
To investigate whether KAT6A may help orchestrate this MLL-r transcriptional control network, we tested whether the ENL-recruited factors CDK9, H3K79me2, and H3K79me3 co-localize with KAT6A-regulated H3K9ac. Indeed, all three were strongly enriched at KAT6A-regulated H3K9ac loci but had minimal binding at non-regulated H3K9ac loci (Figure S5D). Further, as with Pol II, ENL depletion reduced the binding of these factors only at these KAT6A-regulated H3K9ac loci, but not at non-target H3K9ac (Figure S5D).
To ensure our findings were not unique to our integration of the Wan et al. dataset, we performed similar analyses using data from an independent study (61). We integrated our data with ChIP-seq and RNA-seq data related to MLL1/MLL-AF9, Menin, DOT1L, and DOT1L-catalyzed H3K79me2 in MOLM-13 cells. In accordance with previous results, we found that all four factors were strongly co-localized at KAT6A-regulated H3K9ac regions, but not at non-regulated H3K9ac loci (Figure S5E). We then analyzed RNA-seq data from VTP50469, which inhibits the Menin-MLL interaction, and the DOT1L inhibitor EPZ5676 in MOLM-13 cells (Supplementary Table 7). Consistent with our model, both inhibitors induce transcriptional changes that are highly similar to those resulting from KAT6A depletion (Figure S5F).
Finally, we asked whether our model of KAT6A/H3K9ac-based transcriptional control was supported in clinical AML samples. A key feature of our model is the convergence of KAT6A, ENL, and other MLL-r AML-related factors in regulation of AML oncogenic programs. To test whether these factors may operate in unison in clinical AML, we clustered patients of the TCGA, TARGET, and OHSU datasets according to their enrichment of the LSC signature, monocyte differentiation signature, and differential gene expression signatures from KAT6A-KO, ENL-KO, EPZ5676 (DOT1L inhibitor), VTP50469 (Menin inhibitor) treatment. In accordance with predictions, enrichment scores of all four gene inhibition signatures correlated strongly with each other. Further, enrichment of the monocyte maturation signature correlated with inhibition of all four genes, while enrichment of the LSC signature correlated with activation of all four genes (Figure S5G).
Taken together, these data are consistent with a model in which the KAT6A-ENL histone acetylation write-read module cooperates with MLL-r-related chromatin factors to drive leukemogenic gene expression programs.
WM-1119 treatment inhibits the KAT6A-mediated transcriptional program and AML growth
Our findings suggest that KAT6A may represent a novel target of interest for pro-differentiation therapeutics in non-APL AML. While previously considered “undruggable,” breakthrough work recently provided the first-in-class KAT6A/B inhibitor WM-8014 and its derivative WM-1119 (48). These inhibitors render us the opportunity to explore their efficacy in AML models. As in vivo use of these inhibitors is challenging, we focused on surrogate in vitro assays for proof of principle.
To determine whether the inhibitors yield similar results as genetic knockout of KAT6A, we tested their effects on differentiation, proliferation, and clonogenic potential. In addition to using human AML cell lines, we also tested responses in primary cells from several genetically defined mouse MLL-AF9 models, to ensure our results are not unique to cell culture-adapted cell lines. In virtually all assays, inhibitor responses phenocopied results from genetic inhibition of KAT6A. Treatment of inhibitors significantly or near-significantly increased CD11b in all cells assayed, and reduced EdU positivity in the MLL-AF9 models MOLM-13, MV4;11, and RN2 (MLL-AF9/NRasG12D) (62). Additionally, WM-1119 treatment impaired colony formation ability in MOLM-13, MV4;11, and NOMO-1 cells, and almost fully abolished it in RN2 and the MLL-r-like ER-HOXA9 and ER-HOXB8 (63,64) primary mouse cell models (Figure 6A–C and Figure S6A–C). Similar to genetic knockout, WM-1119 treatment also induced superoxide anion production (functional differentiation) and β-galactosidase activity (senescence) in MOLM-13 cells (Figure S6D–E).
Figure 6. Treatment with WM-1119 inhibits KAT6A-mediated transcriptional program and AML growth.
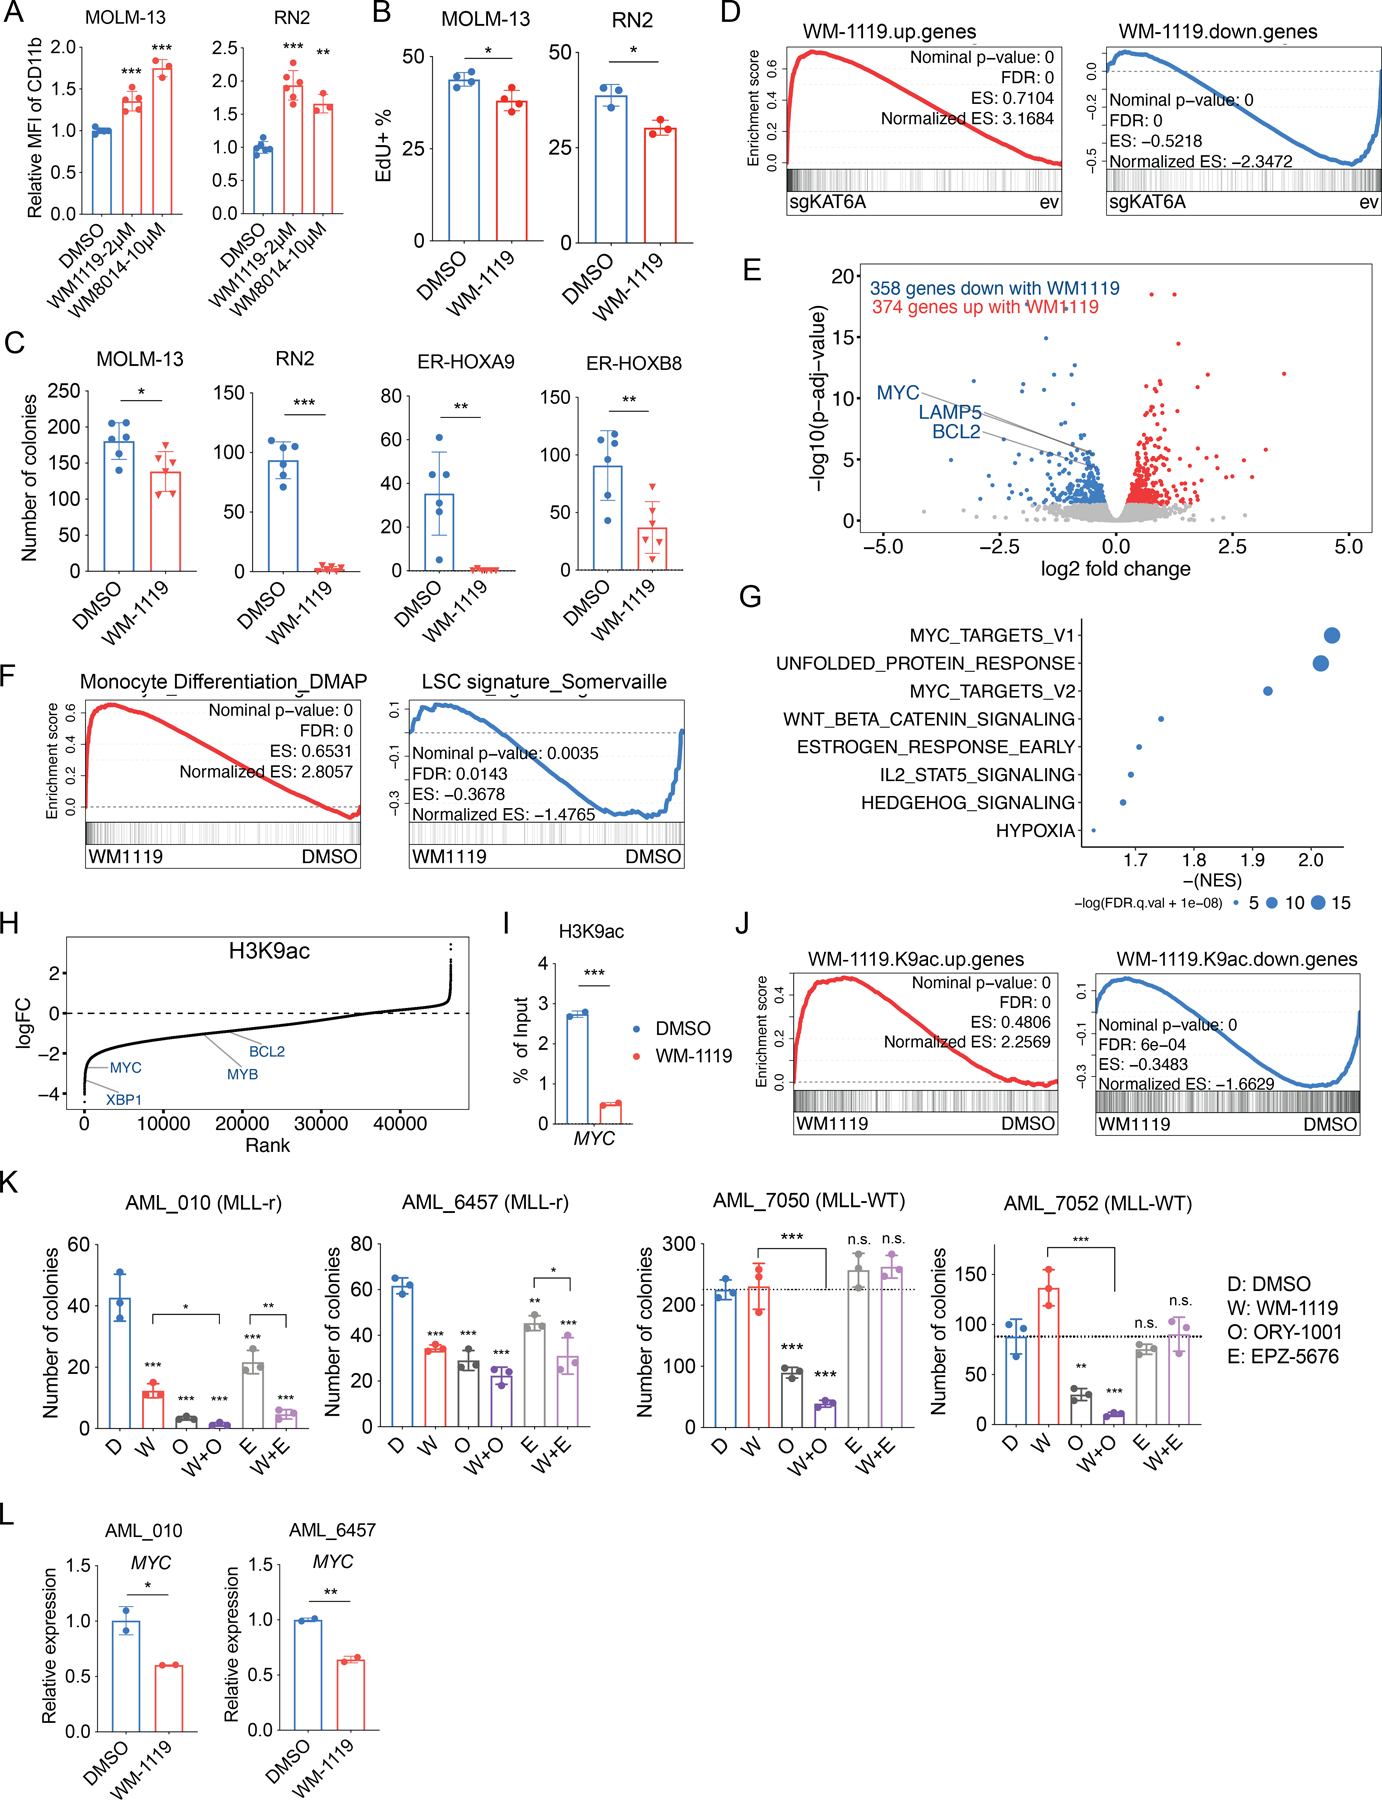
A, Surface expression of CD11b after 4 days treatment of indicated chemicals in MOLM-13 and RN2 cells (n=3–6 each group). B, Percentage of EdU+ cells after 4 days treatment of DMSO or WM-1119 in MOLM-13 and RN2 cells (n=4 each group). C, Count of colonies formed by 1000 cells with DMSO or WM-1119 treatment. (n=6 each group). D, Leading edge plot showing the enrichment of genes up-regulated or down-regulated with 4 days treatment of WM-1119 based on GSEA of ev and sgKAT6A MOLM-13 cells. E, Volcano plot showing the differentially expressed genes between DMSO and WM-1119 treated MOLM-13 cells. Genes with p.adj< 0.05 are highlighted (blue: genes down-regulated with WM-1119, red: genes up-regulated with WM-1119). F, Leading edge plot showing the enrichment of indicated gene sets based on GSEA of DMSO and WM-1119 treated MOLM-13 cells. G, Top enriched hallmark gene sets in DMSO treated MOLM-13 cells based on GSEA. H, Waterfall plot of changes in H3K9ac ChIP-seq signal at the indicated proximal genes after 4 days of WM-1119 treatment in MOLM-13 cells. logFC, log fold change. I, ChIP-qPCR of H3K9ac at a gene desert or the MYC locus after 4 days treatment of DMSO or WM-1119 in MOLM-13 cells. J, Leading edge plot showing the enrichment of genes associated with H3K9ac up-regulated or down-regulated regions following WM-1119 treatment, based on GSEA of RNA-seq data from DMSO and WM-1119 treated MOLM-13 cells. K, Count of colonies formed by primary human AML cells after indicated chemical treatment (n=3 technical replicate each group). L, mRNA expression of MYC after 3 days of WM-1119 treatment in primary human AML cells. Statistical differences were calculated using one-way ANOVA with multiple comparisons (A and K), and unpaired Student’s t-test (B, C, I and L). All error bars represent mean ± s.d. and p<0.05 was considered statistically significant, * indicates p<0.05, ** p<0.01, and *** p< 0.001. Treatment with WM-1119 are 4μM, if not indicated otherwise. See also Figure S6.
Transcriptional changes mediated by WM-1119 were also determined in human MOLM-13 and mouse ER-Hoxa9 cells. The responses again phenocopied those of KAT6A-KO cells, in which marked downregulation of MYC/Myc and LSC signatures were observed (Figure 6D–G and Figure S6F–H). Interestingly, although ChIP-seq of WM-1119-treated cells revealed locus-specific H3K9ac loss on leukemogenic genes similar to KAT6A-KO (Figure 6H–J), global levels of H3K9ac remained mostly unchanged (Figure S6I–J). Rather, histone mass-spectrometry of MOLM-13 cells treated with WM-1119 revealed dramatic loss of H3K23ac (Figure S6I), which is likely due to the effect of co-targeting KAT6B (65,66).
Finally, we tested the combinatorial efficacy of WM-1119 and other anti-AML agents already in clinical trials, including SAHA (HDAC inhibitor) (67), EPZ-5676 (DOT1L inhibitor) (68), 5-Aza (69), Decitabine (DNA methylation inhibitors) (70), SNDX-5613 (Menin-MLL inhibitor, ongoing trial NCT04065399) and ORY-1001 (LSD1 inhibitor, ongoing trial EudraCT 2018–000482-36). Using surface CD11b level as a readout, we found that drug responses were potentiated by WM-1119, and that combination with ORY-1001 appeared the most potent (Figure S6K). Cell viability assessment showed a stronger synergy between WM-1119 and ORY-1001/EPZ-5676/SNDX-5613 (Figure S6L). We confirmed the efficacy of the WM-1119/ORY-1001 combination in colony formation assays, in which self-renewal was depleted synergistically by inhibitor co-treatment (Figure S6M).
The clinical relevance of WM-1119 inhibitor was also evaluated by ex vivo culturing of primary human AML cells. In the colony formation assays of the primary cells, MLL-r subtype patients AML (AML-010 and AML-6457) were sensitive to WM-1119 treatment, and the response were further potentiated by ORY-1001/EPZ-5676 treatment. On the contrary, MLL-WT patients AML (AML-7050 and AML-7052) were insensitive to WM-1119 treatment (Figure 6K). This is consistent with the drug sensitivity observed in AML cell lines (Figure S6N). On a molecular level, we confirmed that WM-1119 reduced MYC expression and H3K9ac level in MLL-r primary AML samples (Figure 6L and Figure S6O).
Together, these results suggest that KAT6A inhibitor, alone or in combination with other inhibitors, represents a promising therapeutic strategy for treatment of AML.
Discussion
AMLs are described as being “addicted” to selected oncogenic transcription programs, and these programs require support from chromatin regulators to maintain their hyperactive state (71). Accordingly, epigenetic dysregulation is a hallmark characteristic of AML, and mutations in epigenetic regulators are dramatically overrepresented in the AML genome (42). However, the coopting of wild type proteins to support aberrant transcriptional programs has only been increasingly appreciated in recent years. Identification of such chromatin regulators is of high interest, as they typically represent more attractive therapeutic targets than their associated transcription factors.
The KAT6A (MOZ) translocation MOZ-TIF2 has been long known as rare driver event in AML (72), but a function for wild type KAT6A in leukemia differentiation has not been previously reported. Here, we found that wild type KAT6A is a novel dependency in AML that drives oncogene expression by regulating promoter H3K9ac levels. Notably, several other MYST family histone acetyltransferases (HATs) have been shown to promote AML oncogenesis. Most recently, HBO1/KAT7 was shown to support leukemia stem cell (LSC) activity through acetylation of H3K14 at target genes, promoting elevated transcriptional elongation of key oncogenes such as Hoxa9 (73). MOF/KAT8 was also implicated in MLL-r AML, in which its catalysis of H4K16ac was shown to drive expression of genes involved in DNA damage repair (74). These and related reports suggest that multiple HATs are required for AML oncogenesis, but may play diverse and distinct roles in transcriptional regulation.
Recent works (25,26) identified the H3K9ac and H3K27ac binding functionality of the YEATS domain protein ENL and uncovered the importance of H3K9ac “reading” by ENL at promoters of AML oncogenes such as MYC. However, the writer responsible for H3K9ac in this context remained unknown. Here, we propose that KAT6A is the key H3K9 acetyltransferase that provides substrate for ENL binding in AML. As ENL recruits transcriptional activation and elongation machinery, KAT6A and ENL appear to function in tandem as a writer-reader “module” dedicated to facilitating the later stages of transcriptional activation of MYC, MYB¸ and other prominent regulators of AML cell fate (Figure S6P). A similar histone acetylation writer-reader “module” has also been described in AML, but on the level of enhancer regulation. H3K27ac is a critical mark of active enhancers, and it has been proposed that the p300/CBP HATs catalyze H3K27ac at MYC enhancers in AML cells, leading to recruitment of the acetyllysine reader BRD4 to promote high levels of transcription (35). These findings suggest that MYC can be regulated by multiple such transcriptional modules, all of which are of high therapeutic interest.
In addition to the KAT6A-ENL writer-reader module, we speculate that the H3K9 deacetylase SIRT1 may be a potential “eraser” in this process. Opposite to KAT6A, repression of SIRT1 induced a more “stem-like” AML state in our screen (Figure 1B). Further, a recent study showed that MLL-r leukemias employ DOT1L to prevent SIRT1 binding and maintain high promoter H3K9ac levels at AML oncogenes (75). As we have found an H3K9ac-dependent interrelationship between KAT6A, ENL and other MLL-r transcriptional regulators such as DOT1L (Figure S5), it is possible that an additional function of this network is to cooperatively antagonize SIRT1-mediated H3K9 deacetylation.
We identified KAT6A via a screen for regulators of AML differentiation, and expression of the “core KAT6A target gene set” is highly correlated with expression of the LSC signature in AML patients and cell lines. However, the KAT6A target genes and the LSC genes are largely non-overlapping, suggesting that KAT6A may in fact regulate other upstream drivers of the LSC program, rather than the LSC genes themselves. Interestingly, this is in line with a network-based analysis that predicted KAT6A as a potential master regulator upstream of the LSC gene regulatory model (76). Consistent with this possibility, we observed the most high-confidence direct KAT6A targets to include MYC and MYB, which are themselves thought to upregulate genes driving AML stemness and proliferation. It will be important in future studies to understand the KAT6A gene regulatory network in greater detail.
KAT6A may represent an actionable target of potential therapeutic interest in AML. Importantly, while KAT6A influences HSC activity, its loss in the hematopoietic system of adult mice is tolerated (77–79). Further, in the Dependency Map database, KAT6A knockout is not detrimental to the growth of most cell types. While KAT6A has been a challenging small molecule inhibitor target, development of the WM-1119 and WM-8014 inhibitors that compete for KAT6A/B acetyl-coA binding represents a promising breakthrough. Improvements in inhibitor in vivo bioavailability will be needed to leverage their full potential. It will also be important to further determine the responsiveness of AMLs of different subtypes and mutational backgrounds to KAT6A inhibition. Our findings suggest that MLL-r AMLs may be the most sensitive to KAT6A loss. However, some non-MLL-r AML cell models had varying degrees of responsiveness as well.
KAT6A inhibitors may also be effective in combinatorial treatment schemes. Notably, development of ENL YEATS domain inhibitors would present the possibility of targeting both writer and reader of the described H3K9ac-focused AML transcriptional control module. Alternatively, as both KAT6A and BRD4 appear to promote MYC expression, their dual inhibition may represent a new method for more potent targeting of the MYC regulatory program. Another combinatorial possibility would entail targeting both drivers of stemness and proliferation as well as repressors of differentiation. Indeed, targeting of KAT6A and LSD1 showed marked promise in our preliminary combination treatment assays. It will next be of importance to test such possibilities in robust pre-clinical AML models.
In summary, we have identified a novel oncogenic transcriptional regulatory mechanism in AML that is driven by the histone acetyltransferase KAT6A. KAT6A is actionable and may serve as an attractive new therapeutic target for differentiation-based AML treatment.
Methods
Mice
NOD/SCID/gamma (NSG) mice used in this study were 6-week female NSG mice purchased from The Jackson Laboratory (005557) and maintained in the mouse facility at the School of Veterinary Medicine at the University of Pennsylvania.
C57BL/6J mice used in this study were 8-week female mice purchased from The Jackson Laboratory (000664) and maintained in the mouse facility at the Center of Comparative Medicine, Massachusetts General Hospital. All mouse procedure protocols utilized in study this were in accordance with, and with the approval of, the Institutional Animal Care and Use committee (IACUC). All mouse experiment procedures used in this study were performed following the National Institutes of Health guidelines.
Cells
Human AML cell lines (U937, MOLM-13, MV4;11, NOMO-1, MOLM-14, HL-60, OCI-AML3, and KG-1a) and mouse RN2 AML cell line (a gift from Dr. Christopher Vakoc at Cold Spring Harbor Laboratories) were cultured in RPMI (Corning, 10–041-CV) with 10% FBS (Life Technologies, 16000044) and 1% Penicillin Streptomycin (Gibco, 15–140-122). Mouse ER-HOXA9 and ER-HOXB8 cells were cultured in RPMI (Corning, 10–041-CV) with 10% FBS (Life Technologies, 16000044), 1% Penicillin Streptomycin (Gibco, 15–140-122), 1% - 2% stem cell factor (SCF) conditioned media (generated from a Chinese hamster ovary (CHO) cell line that stably secretes SCF), and 0.5 µM β-estradiol (Fisher Scientific MP021016562). Mouse LSK-MLL-AF9 cells (a gift from Dr. Francois Mercier at McGill University) were cultured in RPMI (Corning, 10–041-CV) with 10% FBS (Life Technologies, 16000044), 1% Penicillin Streptomycin (Gibco, 15–140-122), 1% - 2% stem cell factor (SCF) conditioned media (generated from a Chinese hamster ovary (CHO) cell line that stably secretes SCF), and 10 ng/mL IL-3 (Stemcell Technologies, 78042.1).
Mouse MLL-AF9 cells were generated through the following procedures: A female Cas9-GFP mouse (CAT#: 024828) was purchased from Jackson laboratories and bone marrow was harvested from the femurs. Mononuclear bone marrow cells were collected by Ficoll-paque plus density gradient centrifugation and placed into culture (RPMI, with 10% FBS, 1% Pen/Strep, SCF, IL3, and IL6, all at 10 ng/mL). Approximately 36 hours later, 250,000 cells (500 μL) were transduced with MSCV-based retrovirus expressing MLL/AF9-IRES-GFP (1 mL). This was done by spinfection (1000G, 22 degrees, 90 minutes) in the presence of polybrene (8 μg/mL). 3 ml of media (RPMI with 10% FBS, 1%P/S, SCF 1% conditioned media, and 5 ng/mL IL-3) was added following the spinfection. The following day a half-media change was performed to further dilute out the polybrene. At approximately 4-weeks, the transduced cells had formed an immortalized population of GFP(+) cells expressing MLL/AF9. 5 million cells were injected (retroorbital) into a sub-lethally (450 cGy) irradiated mouse to establish a primary leukemia. Moribund mice were euthanized and bone marrow leukemia cells collected for future experiments, maintained in culture in the same media containing SCF and IL-3. Mouse Cas9-AML1-ETO cell line was a gift from Dr. Stephen Nimer.
All cell lines were tested for mycoplasma contamination (and all confirmed mycoplasma negative) routinely, including upon each unfreeze and then at least monthly during periods of continued culture. Testing was performed using the Universal Mycoplasma Detection Kit (ATCC, 30–1012K) according to the manufacturer’s instructions.
Bone marrow or peripheral blood mononuclear cells from patients with AML (AML_6457, 7050, 7052) were obtained from the Stem Cell and Xenograft Core (SCXC) facility at the University of Pennsylvania. Samples were obtained by the Core after written informed consent. The Stem Cell and Xenograft Core tissue bank is approved as University of Pennsylvania IRB protocol 703185 which is renewed annually. All samples are collected and distributed in accordance with recognized ethical guidelines as outlined by the Belmont Report and the U.S. Common Rule.
AML_010 (AML_2017_010) were obtained with written informed consent at Thomas Jefferson University Hospital in accordance with the Declaration of Helsinki and Institutional Review Board approved protocol (IRB protocol #17D.083).
Human primary AML cells were cultured in IMDM (Gibco, 12440–053) with 2% FBS (Life Technologies, 16000044) and 1% Penicillin Streptomycin (Gibco, 15–140-122) at a concentration of 2 million cells/mL. 3 days post drug treatment, live cells were isolated through Fluorescence activated cell sorting (FACS) for RNA preparation and qPCR analysis.
Virus packaging and transduction
For lentivirus packaging, the target vector and pCMV-VSV-G and pCMV-dR8.2 dvpr lentiviral packaging plasmids (gifts from Dr. Bob Weinberg at the Massachusetts Institute for Technology), Addgene plasmid # 8454 and Addgene plasmid # 8455) were co-transfected into 293T cells (Clontech, 632180) using PEI reagent (Polysciences, 23966–1). Lentiviral particles were collected 48 and 72 hours after transfection, filtered and added to target cells with 8μg/mL polybrene (Sigma, TR-1003-G). For retrovirus packaging, the target vector was transfected into the GPG29 packaging cell line using Lipofectamine 2000 (Invitrogen). Retroviral particles were collected 72–96 hours after transfection, filtered and added to target cells with 8μg/mL polybrene (Sigma, TR-1003-G). Transduced cells were then selected by appropriate antibiotics or cell sorting 48 hours after infection.
CRISPR-Cas9 mediated gene targeting
The Cas9-expression vector, lentiCas9-Blast, was a gift from Dr. Feng Zhang at the Broad Institute of Harvard and MIT (Addgene plasmid # 52962). Cas9 protein was introduced to human AML cell lines by lentiviral transduction and selected with 10 µg/mL Blasticidin (Thermo, R21001). The sgRNA-expression vectors, LRG (Lenti_sgRNA_EFS_GFP) (Addgene plasmid # 65656) and LRCherry2.1 (Addgene plasmid # 108099), were gifts from Christopher Vakoc. Cells were transduced with sgRNA lentivirus and sorted for GFP+ cells 48 hours following transduction (except for negative-selection competition assay). CRISPR sgRNA sequences used were:
sgKAT6A-1: CATACCACTGTTGCCACAGT; sgKAT6A-2: TTCGAGTGAAGGCCTTACGG;
sgKAT6A-3: CTCATCTCCTGTGCCGACTG; sgKAT6A-4: TTAGTGTTGAGCCGATAAAG;
sgKat6a-1: TGCAGCTCCTGTCGTGACCA; sgKat6a-2: GCTATTGCCGCAGTCCGCGC;
sgKat6a-3: CTCGTCTCCTGCGCGGACTG; sgKat6a-4: CGGCGCTATGCTAATCCAAT;
sgKat6a-5: TATGTCAGATATGCCGACCT; sgKat6a-6: CTCAATGCACTGCCACCGTA;
sgRosa26: GAAGATGGGCGGGAGTCTTC; sgNonTarget: ATTGAGAATTCGTTTCAAGG.
Except for the negative selection competition assay which used all the sgRNAs, in other assays: human sgKAT6A-2 and mouse sgKat6a-6 were used, if not indicated otherwise.
shRNA-mediated gene knockdown
The shRNA-expression vector, pLKO.1 puro, was a gift from Dr. Bob Weinberg at the Massachusetts Institute for Technology (Addgene plasmid #8453). Cells were transduced with shRNA lentivirus and then selected with 2 μg/ml puromycin. shRNA sequences used were:
shKAT6A-1: CCGCTGTCACAGTGTAGTATG; shKAT6A-2: ACAACAGCCACAACGTCTATA.
Gene overexpression
Human wild-type and mutant KAT6A cDNA were cloned into a lentiviral EFS-P2A-mCherry expression vector (a gift from Dr. Junwei Shi at the University of Pennsylvania, derivative of Addgene plasmid #108100 LentiV-Cas9-puro, where Cas9 was removed and puro was replaced by mCherry using the In-fusion cloning system (Clontech #638909)). Cells were transduced with lentivirus and then sorted to obtain mCherry+ cells.
Human wild-type MYC cDNA construct (lentiV-EFS-Flag-hMYC-PGK-Blast) was a gift from Dr. Junwei Shi. Cells were transduced with lentivirus and then selected with 10 μg/ml Blasticidin.
Quantitative PCR (qPCR) analysis for gene expression
Total RNA was prepared from AML cells using the RNeasy Mini Kit (Qiagen). cDNA was generated using High-capacity cDNA Reverse Transcription Kit (Applied Biosystems) from 1 μg RNA and diluted 1:10 for qPCR analysis. qPCR was performed using 2 μL diluted cDNA with biological and technical replicates using SYBR Green Master Mix (Applied Biosystems) with QuantStudio 3 real-time PCR system, and results were normalized to the expression of ACTB/Actb. Primer sequences utilized for qPCR were:
Human:
KAT6A-F: ATAATCCTGGGCGAATAGCACT; KAT6A-R: CTGCCTCCGAATAATGCAGAC;
MYC-F: ACCCTCTCAACGACAGCAGC; MYC-R: ACTCCGTCGAGGAGAGCAGA;
HOXA9-F: CCCCATCGATCCCAATAACCC; HOXA9-R: TTTGTATAGGGGCACCGCTT;
MEIS1-F: GGGCATGGATGGAGTAGGC; MEIS1-R: GGGTACTGATGCGAGTGCAG
ACTB-F: GCGGGAAATCGTGCGTGACATT; ACTB-R: CTAGAAGCATTTGCGGTGGA.
Mouse:
Kat6a-F: CCTCGTGCATTGGCTGTTC; Kat6a-R: TCATGGCATTCAAGGTGTTCAT;
Myc-F: GCATGAGGAGACACCGCCCA; Myc-R: GGTTTGCCTCTTCTCCACAGA;
Actb-F: AGTGTGACGTTGACATCCGT; Actb-R: TGCTAGGAGCCAGAGCAGTA.
In vitro drug treatment
Cells were treated in triplicates and treated with indicated concentration of drugs or DMSO.
Chemicals are listed below:
WM-8014, MedChemExpress, HY-102060
WM-1119, MedChemExpress, HY-102058
SAHA, Cayman, 10009929
EPZ-5676, MedChemExpress, HY-15593
5-aza, Adooq Bioscience, A10105
Decitabine, Adooq Bioscience, A10292
ORY-1001, Cayman, 19136
SNDX-5613, MedChemExpress, HY-136175
Negative-selection competition assay
AML cells were transduced with lentivirus expressing sgRNAs to achieve roughly 50% transduction rate. Percentage of GFP+ or mCherry+ sgRNA expressing cells was measured using flow cytometry over time and normalized to the percentage of GFP+ or mCherry+ cells on indicated start day.
Colony formation assay
Clonogenic potential was assessed by seeding the indicated number of cells in methylcellulose media.
For cell lines: to make 100mL complete methylcellulose media, 40mL methylcellulose base media (Stem Cell Technologies, MethoCult H4100) was supplemented with IMDM (Gibco, 12440–053), 10% FBS (Life Technologies, 16000044), 1% Penicillin Streptomycin (Gibco, 15–140-122) and other desired supplements as described previously in cell culture section. The complete media was then used to resuspend the cells. Number of colonies was counted two weeks following seeding.
For human primary AML cells: to make 100mL complete methylcellulose media, 75mL methylcellulose base media (R&D Systems #HSC005) was supplemented with IMDM (Gibco, 12440–053), 10% FBS (Life Technologies, 16000044), 1% Penicillin Streptomycin (Gibco, 15–140-122). The complete media was then used to resuspend the cells. Number of colonies was counted two weeks following seeding.
Flow cytometry and cell sorting
For flow cytometric analyses of cell surface CD11b and CD86, cells were washed with PBS then stained with PE-CD11b antibody (Biolegend, #101207) or FITC-CD86 antibody (Biolegend, #374203) at room temperature for 15 minutes and then washed twice with cold PBS for flow cytometric analysis. For EdU (Life Technologies, #C10634), cell senescence (Thermo Scientific #C10840) and Annexin-V cell apoptosis (Life Technologies, #A23204) analyses, cells were prepared following product instructions and then analyzed by flow cytometry. Flow cytometry was performed on BD LSRFortessa (BD Biosciences) and analyzed with FlowJo software (Treestar). Fluorescence activated cell sorting (FACS) of AML cells was performed by MoFlo Astrios (Beckman) or BD Jazz (BD Biosciences) according to the manufacturer’s instructions.
Superoxide Anion Asssay
Superoxide Anion assay were performed using Sigma #CS1000 kit following product instructions. Luminescence was measured using the EnVision (PerkinElmer) plate reader every 10 minutes in 4 hours.
Cell viability assay
Cells were harvested for cell viability assay 6 days post drug treatment. Cell viability assay were performed using CellTiter-Glo Luminescent Cell Viability Assay (Promega #G7571) following product instructions. Luminescence was measured once using the EnVision (PerkinElmer) plate reader after 10 minutes of incubation.
Animal experiments
For MOLM-13 cell transplantation: Cas9-expressing MOLM-13 cells were initially transduced with retrovirus of luciferase/GFP-expressing vector pSFG-NES-TGL (80). Cells were then transduced with empty vector/sgRNA-expressing LRCherry2.1 plasmid. Two days following sgRNA transduction, GFP and mCherry double positive AML cells were isolated via FACS. 500,000 sorted cells per mouse were then transplanted by tail vein injection into NSG that had been sub-lethally (2 Gy) irradiated 24 hours prior to injection (n=7 mice per group). To quantify leukemia burden, bioluminescence imaging of mice was performed with an IVIS Spectrum In Vivo Imaging System immediately following retro-orbital injection of 200 μL (15mg/mL) D-Luciferin (GoldBio, LUCK-1g) on indicated days. Quantifications were performed using Living Image software (Perkin-Elmer) with whole body total photon flux used as a readout for leukemic cell burden for each mouse at all timepoints.
Kaplan-Meier survival curves and log-ranks test were performed using Prism software (GraphPad). At the study endpoint, bone marrow and peripheral blood of sgKAT6A mice were harvested for flow cytometry of GFP and mCherry levels to identify knockout-escaped leukemia cells.
For mouse MLL-AF9 cell transplantation: Cas9-GFP-expressing MLL-AF9 cells were transduced with empty vector/sgRNA-expressing LRCherry2.1 plasmid. Transduced MLL-AF9 cells expressing both GFP and mCherry were sorted two days following transduction by fluorescence-activated cell sorting. 500,000 cells per mouse from respective group were transplanted by retro orbital injection into C57BL/6J mice that had been subjected to whole-body irradiation at a single sublethal dose of 4.5 Gy (n=5 mice per group). In order to investigate leukemic burden of transduced MLL-AF9 cells, twenty-one days following transplantation bone marrow of sgKat6a and control mice were harvested for flow cytometry of GFP leukemia cells respectively.
Pooled CRISPR-Cas9 screen and screen analysis
The human epi-RBP CRISPR sgRNA library was constructed using methodology described in detail in a recent publication (81). Briefly, the sgRNA oligos were designed according to a published method (27), and 100 non-targeting control sgRNAs were also included. The sgRNA library was synthesized using array synthesis by CustomArray, Inc and cloned as a pool into the lentiGuide-puro transfer plasmid via Gibson ligation reaction (NEB). After ligation, the library was transformed into electrocompetent cells (Lucigen) for amplification.
For the CRISPR screen, two biological replicates (independent transductions performed on different days) were performed and sequenced together. Cas9-expressing U937 AML cells were first transduced with the sgRNA lentivirus library at MOI of 0.2. At least 200x coverage of the sgRNA library in U937 cells was maintained throughout the screen. AML cells were sorted via FACS based on surface expression of CD11b into CD11b-high and CD11b-low samples for library preparation. Genomic DNA from sorted and bulk AML cells was harvested using the QIAamp DNA mini kit (Qiagen). Sequencing libraries were then prepared following previously described protocols (28). All prepared genomic DNA were used for library preparation for maintaining library coverage. PCR amplified library samples were purified with the QIAquick PCR purification kit (Qiagen) followed by gel extraction with the QIAquick gel extraction kit (Qiagen). The barcoded libraries were then pooled at an equal molar ratio and sequenced on a NextSeq500/550 (Illumina, 150 cycles High Output kit v2.0) to generate 150 bp single end reads. MAGeCK software was used for screen analysis (33). Briefly, the resulted sequencing data were de-barcoded, merged, and the 20 bp sgRNA sequence was aligned to the reference sgRNA library without allowing for any mismatches. The read counts were calculated for each sgRNA using the method normalizing to the non-targeting sgRNAs. Differential analysis of sgRNA and targeted genes was also done following the MAGeCK instructions with standard parameters. Detailed Scripts and parameters used for each step of analysis could be provided by request to the authors.
RNA-seq analysis
RNA samples of 2–3 biological replicates were extracted from cultured cells, using the Qiagen RNeasy Kit, following manufacturer’s instructions. RNA was then sent out for library preparation and next-generation sequencing to a commercial company, Novogene (California, USA). Raw counts of gene transcripts were derived from raw fastq files using the alignment-independent quantification tool, Salmon (https://combine-lab.github.io/salmon/), with standard settings. The raw count matrix was then imported into R-studio and utilized as input for DESeq2 analysis following the vignette of the package for normalization, differential gene expression analysis, and unbiased clustering analysis, including principal component analysis (82). The output of DESeq2 was used as the input for pre-ranked based GSEA for enrichment of functional pathways and gene signatures (https://www.gsea-msigdb.org/gsea/index.jsp). Top differentially expressed genes were used as input for HOMER (−1000bp to +300bp as scanning region) for identification of motifs of potential transcriptional regulators (http://homer.ucsd.edu/homer/motif/). Detailed Scripts and parameters used for each step of analysis could be provided by request to the authors.
ChIP-qPCR, ChIP-seq and analysis
5–10 million cells were used for ChIP of each target. Cells were washed with PBS, crosslinked with 1% formaldehyde for 10 minutes at room temperature, and then quenched with 125 mM glycine for 5 minutes. The isolated nuclei were resuspended in 1 mL nuclei lysis/sonication buffer and sonicated with Covaris S220 sonicator with following parameters: Peak Intensity – 140, Duty Factor – 5, Cycles per Burst – 200, Time – 60 seconds on, 30 seconds off for 16 cycles. After centrifugation at 4 degrees with 13,500 rpm for 10 min, soluble chromatin was then used to perform immunoprecipitation, while 5% sample kept as input DNA. Immunoprecipitation was performed with 5 – 10 µg indicated antibodies overnight at 4 degrees with rotation. Products were then incubated with magnetic Protein G Dynabeads and then washed sequentially using low-salt, high-salt, LiCl buffer, and TE buffer. Bound DNA was then eluted, reverse-crosslinked, incubated with RNase A and Proteinase K. DNA samples were purified using QIAquick PCR Purification Kit (Qiagen) and used for ChIP-qPCR or preparation of ChIP-seq libraries.
Primers for ChIP-qPCR analysis:
Gene Desert: Active Motif #71001, Human Negative Control Primer Set 1;
MYC TSS+1Kb-F: AAGGGAGGCGAGGATGTGT; R: TTCGCCCTGGTTTTTCCAA;
MYB TSS+2Kb-F: GTGGGAATTCGTTCCGGGAT; R: ACTTGCAAAATGAGCCGCAG
ChIP-seq libraries were prepared following the NEBNext Ultra II DNA Library Prep Kit (New England Biolabs) protocol, using NEBNext Multiplex Oligos Index Primers Sets. Libraries were pooled and sequenced on the NextSeq500/550 (Illumina, 75 cycles High Output kit v2.0) to generate 75 bp single end reads or paired end reads. Sequencing reads were aligned to the human (hg38) using Bowtie2 with default settings (83). Resulting sam files were filtered for uniquely aligned reads, converted to bam files, sorted, and marked for duplicated reads using SAMtools (84). Peaks calling was performed using MACS2 with --nomodel --extsize 147 -q 0.1 for HA-KAT6A, Flag-ENL and histone marks (H3K9ac, H3K14ac, and H3K23ac) analysis. Peaks were subsequently merged using BEDTools and read counts were calculated in the merged peaks for every sample (85). Bigwig files generated from bam files and big files from biological replicates were merged and normalized for genome track visualization as well as localization analysis using deepTools. The resulting count table was then used to identify differentially genomic regions with edgeR (86,87). edgeR results were used for identification of peak-associated genes using the BEDTools closest function. Differentially associated genes were used as an input for functional analysis using the online Metascape tool (54). Differential genomic regions were also transformed to bed files and used for genomic region annotation using the ChIP-seeker analysis tool (88). Overlap between different genomic regions was analyzed using BEDTools intersect function. Detailed Scripts and parameters used for each step of analysis could be provided by request to the authors.
Antibodies are listed below:
anti-histone H3 (acetyl K9), Abcam, ab4441
anti-acetyl-histone H3 (Lys14) (D4B9), Cell Signaling Technology, 7627
anti-acetyl-histone H3 (Lys23), Millipore, 07–355
anti-HA tag, Abcam, ab9110
anti-ENL, Millipore, ABE2596
Gene Expression Profiling Interactive Analysis (GEPIA)
Expression of KAT6A across different types of cancer and normal tissues was analyzed using an online tool, Gene Expression Profiling Interactive Analysis (GEPIA) (http://gepia.cancer-pku.cn/) (89).
Cancer Dependency Map Portal data analysis
The depmap portal (https://depmap.org/portal/), the CRISPR (Avana) Public 20Q2 dataset, as well as the Combined RNAi (Broad, Novartis, Marcotte) dataset were used for the analysis. No samples were excluded from the dataset in this analysis. Following the depmap instruction, the dependency scores of annotated genes were downloaded and then plotted as dot plots. Pearson correlation was then calculated for all the plots using Prism.
Histone Extraction and Liquid Chromatography-MS/MS
Histone peptides were prepared for mass spectrometry analysis as described in a previous publication (90). Briefly, cell pellets were lysed with nuclear isolation buffer (15mM Tris pH 7.5, 60mM KCl, 15mM NaCl, 5mM MgCl2, 1mM CaCl2, 250mM sucrose, 0.2% NP-40 alternative, 1mM DTT, 0.5mM AEBSF, 10mM Sodium Butyrate), histones were extracted and chemically derivatized, then desalted by C18. Approximately 1μg of peptide was loaded onto an in-house packed fused silica capillary, C18 column (75 µm x 30 cm, 2.4 µm Reprosil-Pur Dr Maisch GmbH). Buffer A (0.1% Formic Acid) and Buffer B (80% acetonitrile, 20% H2O, 0.1% Formic acid) were used to separate peptides based on hydrophobicity on a Dionex Ultimate 3000 RSLCnano high-performance liquid chromatographic system connected to a Q Exactive HF (Thermo Scientific). A 65min two-step linear gradient (equilibrate with 4% of ACN for 2min; elute with 27.2% ACN for 44min; wash with 72% of ACN for 5min; re-equilibrate with 1.6% ACN for 11min) at a flow rate of 400 μL/min was used and eluting peptides were electrosprayed into the mass spectrometer. The Q-Exactive HF was programmed with a data-independent acquisition (DIA) method, including a MS survey scan range up to 1100 m/z (60,000 MS1 resolution, automatic gain control (AGC) 1e6 ions, 50 ms max ion injection time), and DIA MS2 isolation windows for CID fragmentation (Normalized Collision Energy 25, 27.5, 30) of 50 m/z windows (15,000 MS1 resolution, automatic gain control (AGC) 5E5 ions, auto max ion injection time). Raw MS files were imported into EpiProfile to perform peak area integration of histone peptides (91). The MS proteomics data have been deposited to the ProteomeXchange Consortium (http://www.proteomexchange.org/) via the PRIDE (92) partner repository.
Immunoblotting
Cells were washed with PBS and lysed in RIPA lysis buffer with protease inhibitor cocktail. Lysates were heated to 95 degrees in SDS sample buffer, separated by SDS-PAGE, and transferred to nitrocellulose or PVDF membrane. Membranes were blocked in 5% non-fat milk in PBS with 0.1% Tween-20, probed with indicated primary antibodies and LI-COR secondary antibodies, and visualized using Odyssey imaging system. Representative plot of 2–4 biological replicates are shown.
Antibodies are listed below:
anti-histone H3 (acetyl K9), Abcam, ab4441
anti-acetyl-histone H3 (Lys14), Millipore, 07–353
anti-acetyl-histone H3 (Lys23), Millipore, 07–355
anti-histone H3, Abcam, ab1791
anti-c-Myc, Abcam, ab32072
anti-β-Actin: Santa Cruz, sc-8432
Data Resources
Raw sequencing files were uploaded into Gene Expression Omnibus, GEO, dataset with following access numbers: GSE156947, GSE156948, GSE157039, GSE157041, GSE157042, GSE165076.
Software and Statistical analysis
PRISM software and R were used for data processing, statistical analysis, and result visualization (http://www.graphpad.com). The R language and environment for graphics (https://www.r-project.org) was used in this study for the bioinformatics analysis of CRISPR screen, RNA-seq, and ChIP-seq data. The R packages used for all analysis described in this manuscript were from the Bioconductor and CRAN. On graphs, bars represent either standard deviation (SD) or standard error of mean (SEM), as indicated in legends. For all figures, p<0.05 was considered statistically significant, * indicates p<0.05, **p<0.01, and ***p<0.001.
Supplementary Material
Statement of Significance.
AML is a poor-prognosis disease characterized by differentiation blockade. Through a cell fate CRISPR screen, we identified KAT6A as a novel regulator of AML cell differentiation. Mechanistically, KAT6A cooperates with ENL in a “writer-reader” epigenetic transcriptional control module. These results uncover a new epigenetic dependency and therapeutic opportunity in AML.
Acknowledgments
We would like to acknowledge members of the Blanco laboratory for technical support and scientific discussions. We would also like to acknowledge Martin Carroll, Gerd Blobel and Peter Klein for helpful scientific discussions. We thank Junwei Shi and Zhendong Cao at the University of Pennsylvania for providing valuable cell lines and plasmids, and Stephen Nimer at University of Miami for also providing valuable cell lines. We thank members of the flow cytometry and cell sorting resource laboratories at the Children’s Hospital of Philadelphia and University of Pennsylvania for technical help with flow analysis and sorting. We thank Daniel Beiting and members of the Center for Host-Microbial Interactions for assistance with next-generation DNA sequencing. We thank members of the animal vivarium at the University of Pennsylvania for assistance with housing and maintenance of mice used in xenograft experiments. We also thank Stem Cell and Xenograft Core (SCXC) facility at the University of Pennsylvania for primary human AML cells.
Financial support:
This work was supported in part by and NCI K22 grant 1K22CA214849 (to M.A.B.), a Leukemia Research Foundation Hollis Brownstein Research Award (to. M.A.B.), an NIH grant R01-CA229803 (to B.Z.S.) and a Blavatnik Family Fellowship (to J.L.).
Footnotes
Conflict of Interest: Neil Palmisiano is a consultant for Takeda, Abbvie, and Foundation one, and receives research funding from Abbvie and Genentech. Liling Wan is a consultant of Bridge Medicines. David B. Sykes is a co-founder and holds equity in Clear Creek Bio, is a consultant and holds equity in SAFI Biosolutions, and is a consultant for Keros Therapeutics. Other authors declare that they have no competing financial interests.
References
- 1.Döhner H, Weisdorf DJ, Bloomfield CD. Acute myeloid leukemia. N. Engl. J. Med 2015;373:1136–52. [DOI] [PubMed] [Google Scholar]
- 2.Siegel RL, Miller KD, Jemal A. Cancer statistics, 2020. CA. Cancer J. Clin 2020;70:7–30. [DOI] [PubMed] [Google Scholar]
- 3.Dombret H, Gardin C. An update of current treatments for adult acute myeloid leukemia. Blood 2016;127:53–61. [DOI] [PMC free article] [PubMed] [Google Scholar]
- 4.De Thé H Differentiation therapy revisited. Nat. Rev. Cancer 2018;18:117–27. [DOI] [PubMed] [Google Scholar]
- 5.Papaemmanuil E, Gerstung M, Bullinger L, Gaidzik VI, Paschka P, Roberts ND, et al. Genomic Classification and Prognosis in Acute Myeloid Leukemia. N. Engl. J. Med 2016;374:2209–21. [DOI] [PMC free article] [PubMed] [Google Scholar]
- 6.Ferrara F, Schiffer CA. Acute myeloid leukaemia in adults. Lancet 2013;381:484–95. [DOI] [PubMed] [Google Scholar]
- 7.Warrell RP, de the H, Wang Z yi, Degos L. Acute Promyelocytic Leukemia. N. Engl. J. Med 1993;329:177–89. [DOI] [PubMed] [Google Scholar]
- 8.Degos L, Dombret H, Chomienne C, Daniel MT, Micléa JM, Chastang C, et al. All-trans-retinoic acid as a differentiating agent in the treatment of acute promyelocytic leukemia. Blood 1995;85:2643–53. [PubMed] [Google Scholar]
- 9.Dang L, Yen K, Attar EC. IDH mutations in cancer and progress toward development of targeted therapeutics. Ann. Oncol 2016;27:599–608. [DOI] [PubMed] [Google Scholar]
- 10.Wouters BJ, Delwel R. Epigenetics and approaches to targeted epigenetic therapy in acute myeloid leukemia. Blood 2016;127:42–52. [DOI] [PubMed] [Google Scholar]
- 11.Sun Y, Chen BR, Deshpande A. Epigenetic regulators in the development, maintenance, and therapeutic targeting of acute myeloid leukemia. Front. Oncol 2018;8:41. [DOI] [PMC free article] [PubMed] [Google Scholar]
- 12.Pelish H, Liau B, Nitulescu I, Tangpeerachaikul A, Poss Z, Silva D, et al. Mediator kinase inhibition further activates super-enhancer-associated genes in AML. Nature 2015;526:273. [DOI] [PMC free article] [PubMed] [Google Scholar]
- 13.Sun Y, Zhou B, Mao F, Xu J, Miao H, Zou Z, et al. HOXA9 Reprograms the Enhancer Landscape to Promote Leukemogenesis. Cancer Cell 2018;34:643–658.e5. [DOI] [PMC free article] [PubMed] [Google Scholar]
- 14.Yang L, Rodriguez B, Mayle A, Park HJ, Lin X, Luo M, et al. DNMT3A Loss Drives Enhancer Hypomethylation in FLT3-ITD-Associated Leukemias. Cancer Cell 2016;29:922–34. [DOI] [PMC free article] [PubMed] [Google Scholar]
- 15.Lu R, Wang P, Parton T, Zhou Y, Chrysovergis K, Rockowitz S, et al. Epigenetic Perturbations by Arg882-Mutated DNMT3A Potentiate Aberrant Stem Cell Gene-Expression Program and Acute Leukemia Development. Cancer Cell 2016;30:92–107. [DOI] [PMC free article] [PubMed] [Google Scholar]
- 16.Dawson MA, Prinjha RK, Dittmann A, Giotopoulos G, Bantscheff M, Chan WI, et al. Inhibition of BET recruitment to chromatin as an effective treatment for MLL-fusion leukaemia. Nature 2011;478:529–33. [DOI] [PMC free article] [PubMed] [Google Scholar]
- 17.Zuber J, Shi J, Wang E, Rappaport AR, Herrmann H, Sison EA, et al. RNAi screen identifies Brd4 as a therapeutic target in acute myeloid leukaemia. Nature 2011;478:524–8. [DOI] [PMC free article] [PubMed] [Google Scholar]
- 18.Shi J, Whyte WA, Zepeda-Mendoza CJ, Milazzo JP, Shen C, Roe JS, et al. Role of SWI/SNF in acute leukemia maintenance and enhancer-mediated Myc regulation. Genes Dev 2013;27:2648–62. [DOI] [PMC free article] [PubMed] [Google Scholar]
- 19.Bhagwat AS, Roe JS, Mok BYL, Hohmann AF, Shi J, Vakoc CR. BET Bromodomain Inhibition Releases the Mediator Complex from Select cis-Regulatory Elements. Cell Rep 2016;15:519–30. [DOI] [PMC free article] [PubMed] [Google Scholar]
- 20.Harris W, Huang X, Lynch J, Spencer G, Hitchin J, Li Y, et al. The Histone Demethylase KDM1A Sustains the Oncogenic Potential of MLL-AF9 Leukemia Stem Cells. Cancer Cell 2011;21:473–87. [DOI] [PubMed] [Google Scholar]
- 21.Schenk T, Chen W, Göllner S, Howell L, Jin L, Hebestreit K, et al. Inhibition of the LSD1 (KDM1A) demethylase reactivates the all-trans-retinoic acid differentiation pathway in acute myeloid leukemia. Nat Med 2012;18:605. [DOI] [PMC free article] [PubMed] [Google Scholar]
- 22.Maes T, Mascaró C, Tirapu I, Estiarte A, Ciceri F, Lunardi S, et al. ORY-1001, a Potent and Selective Covalent KDM1A Inhibitor, for the Treatment of Acute Leukemia. Cancer Cell 2018;33:495–511. [DOI] [PubMed] [Google Scholar]
- 23.Alba M-D, Spencer G, Lynch J, Ciceri F, Williams E, Amaral F, et al. Enhancer Activation by Pharmacologic Displacement of LSD1 from GFI1 Induces Differentiation in Acute Myeloid Leukemia. Cell Rep 2018;22:3641–59. [DOI] [PMC free article] [PubMed] [Google Scholar]
- 24.Vinyard ME, Su C, Siegenfeld AP, Waterbury AL, Freedy AM, Gosavi PM, et al. CRISPR-suppressor scanning reveals a nonenzymatic role of LSD1 in AML. Nat. Chem. Biol 2019;15:529–39. [DOI] [PMC free article] [PubMed] [Google Scholar]
- 25.Wan L, Wen H, Li Y, Lyu J, Xi Y, Hoshii T, et al. ENL links histone acetylation to oncogenic gene expression in acute myeloid leukaemia. Nature 2017;543:265. [DOI] [PMC free article] [PubMed] [Google Scholar]
- 26.Erb MA, Scott TG, Li BE, Xie H, Paulk J, Seo HS, et al. Transcription control by the ENL YEATS domain in acute leukaemia. Nature 2017;543:270–4. [DOI] [PMC free article] [PubMed] [Google Scholar]
- 27.Shalem O, Sanjana NE, Hartenian E, Shi X, Scott DA, Mikkelsen TS, et al. Genome-scale CRISPR-Cas9 knockout screening in human cells. Science (80-. ) 2014;343:84–7. [DOI] [PMC free article] [PubMed] [Google Scholar]
- 28.Joung J, Konermann S, Gootenberg JS, Abudayyeh OO, Platt RJ, Brigham MD, et al. Genome-scale CRISPR-Cas9 knockout and transcriptional activation screening. Nat. Protoc 2017;12:828–63. [DOI] [PMC free article] [PubMed] [Google Scholar]
- 29.Barbieri I, Tzelepis K, Pandolfini L, Shi J, Millán-Zambrano G, Robson SC, et al. Promoter-bound METTL3 maintains myeloid leukaemia by m6A-dependent translation control. Nature 2017;552:126–31. [DOI] [PMC free article] [PubMed] [Google Scholar]
- 30.Wang T, Yu H, Hughes NW, Chen WW, Lander ES, Sabatini DM. Gene Essentiality Profiling Reveals Gene Networks and Synthetic Lethal Interactions with Oncogenic Ras. Cell 2017;168:890–903.e15. [DOI] [PMC free article] [PubMed] [Google Scholar]
- 31.Tzelepis K, Koike-Yusa H, De Braekeleer E, Li Y, Metzakopian E, Dovey OM, et al. A CRISPR Dropout Screen Identifies Genetic Vulnerabilities and Therapeutic Targets in Acute Myeloid Leukemia. Cell Rep 2016;17:1193–205. [DOI] [PMC free article] [PubMed] [Google Scholar]
- 32.Chen CC, Li B, Millman SE, Chen C, Li X, Morris JP, et al. Vitamin B6 Addiction in Acute Myeloid Leukemia. Cancer Cell 2020;37:71–84.e7. [DOI] [PMC free article] [PubMed] [Google Scholar]
- 33.Li W, Xu H, Xiao T, Cong L, Love MI, Zhang F, et al. MAGeCK enables robust identification of essential genes from genome-scale CRISPR/Cas9 knockout screens. Genome Biol 2014;15:554. [DOI] [PMC free article] [PubMed] [Google Scholar]
- 34.Giotopoulos G, Chan WI, Horton SJ, Ruau D, Gallipoli P, Fowler A, et al. The epigenetic regulators CBP and p300 facilitate leukemogenesis and represent therapeutic targets in acute myeloid leukemia. Oncogene 2016;35:279–89. [DOI] [PMC free article] [PubMed] [Google Scholar]
- 35.Roe JS, Mercan F, Rivera K, Pappin DJ, Vakoc CR. BET Bromodomain Inhibition Suppresses the Function of Hematopoietic Transcription Factors in Acute Myeloid Leukemia. Mol. Cell 2015;58:1028–39. [DOI] [PMC free article] [PubMed] [Google Scholar]
- 36.Bernt KM, Zhu N, Sinha AU, Vempati S, Faber J, Krivtsov AV., et al. MLL-Rearranged Leukemia Is Dependent on Aberrant H3K79 Methylation by DOT1L. Cancer Cell 2011;20:66–78. [DOI] [PMC free article] [PubMed] [Google Scholar]
- 37.Champagne N, Pelletier N, Yang XJ. The monocytic leukemia zinc finger protein MOZ is a histone acetyltransferase. Oncogene 2001;20:404–9. [DOI] [PubMed] [Google Scholar]
- 38.Huang F, Abmayr S, Workman J. Regulation of KAT6 Acetyltransferases and Their Roles in Cell Cycle Progression, Stem Cell Maintenance, and Human Disease. Mol Cell Biol 2016;36:1900–7. [DOI] [PMC free article] [PubMed] [Google Scholar]
- 39.Borrow J, Stanton VP, Andresen JM, Becher R, Behm FG, Chaganti RSK, et al. The translocation t(8;16)(p11;p13) of acute myeloid leukaemia fuses a putative acetyltransferase to the CREB-binding protein. Nat. Genet 1996;14:33–41. [DOI] [PubMed] [Google Scholar]
- 40.Carapeti M, Aguiar RCT, Goldman JM, Cross NCP. A Novel Fusion Between MOZ and the Nuclear Receptor Coactivator TIF2 in Acute Myeloid Leukemia. Blood 1998;91:3127–33. [PubMed] [Google Scholar]
- 41.Kitabayashi I, Aikawa Y, Yokoyama A, Hosoda F, Nagai M, Kakazu N, et al. Fusion of MOZ and p300 histone acetyltransferases in acute monocytic leukemia with a t(8;22)(p11;q13) chromosome translocation. Leukemia 2001;15:89–94. [DOI] [PubMed] [Google Scholar]
- 42.Ley TJ, Miller C, Ding L, Raphael BJ, Mungall AJ, Robertson G, et al. Genomic and Epigenomic Landscapes of Adult De Novo Acute Myeloid Leukemia. N. Engl. J. Med 2013;368:2059–74. [DOI] [PMC free article] [PubMed] [Google Scholar]
- 43.Bolouri H, Farrar JE, Triche T, Ries RE, Lim EL, Alonzo TA, et al. The molecular landscape of pediatric acute myeloid leukemia reveals recurrent structural alterations and age-specific mutational interactions. Nat. Med 2018;24:103–12. [DOI] [PMC free article] [PubMed] [Google Scholar]
- 44.Barretina J, Caponigro G, Stransky N, Venkatesan K, Margolin AA, Kim S, et al. The Cancer Cell Line Encyclopedia enables predictive modelling of anticancer drug sensitivity. Nature 2012;483:603–7. [DOI] [PMC free article] [PubMed] [Google Scholar]
- 45.Lonsdale J, Thomas J, Salvatore M, Phillips R, Lo E, Shad S, et al. The Genotype-Tissue Expression (GTEx) project. Nat. Genet 2013;45:580–5. [DOI] [PMC free article] [PubMed] [Google Scholar]
- 46.Novershtern N, Subramanian A, Lawton LN, Mak RH, Haining WN, McConkey ME, et al. Densely interconnected transcriptional circuits control cell states in human hematopoiesis. Cell 2011;144:296–309. [DOI] [PMC free article] [PubMed] [Google Scholar]
- 47.Sheikh BN, Phipson B, F E-S, Vanyai HK, Downer NL, Bird MJ, et al. {MOZ} {(MYST3,} {KAT6A)} inhibits senescence via the {INK4A-ARF} pathway. Oncogene 2015;34:5807–20. [DOI] [PubMed] [Google Scholar]
- 48.Baell J, Leaver D, Hermans S, Kelly G, Brennan M, Downer N, et al. Inhibitors of histone acetyltransferases KAT6A/B induce senescence and arrest tumour growth. Nature 2018;560:253–7. [DOI] [PubMed] [Google Scholar]
- 49.Xu Y, Man N, Karl D, Martinez C, Liu F, Sun J, et al. TAF1 plays a critical role in AML1-ETO driven leukemogenesis. Nat. Commun 2019;10:1–15. [DOI] [PMC free article] [PubMed] [Google Scholar]
- 50.Shima H, Yamagata K, Aikawa Y, Shino M, Koseki H, Shimada H, et al. Bromodomain-PHD finger protein 1 is critical for leukemogenesis associated with MOZ-TIF2 fusion. Int. J. Hematol 2014;99:21–31. [DOI] [PubMed] [Google Scholar]
- 51.Wang WT, Han C, Sun YM, Chen ZH, Fang K, Huang W, et al. Activation of the lysosome-associated membrane protein LAMP5 by DOT1L serves as a bodyguard for MLL fusion oncoproteins to evade degradation in leukemia. Clin. Cancer Res 2019;25:2795–808. [DOI] [PubMed] [Google Scholar]
- 52.van Galen P, Hovestadt V, Wadsworth MH, Hughes TK, Griffin GK, Battaglia S, et al. Single-Cell RNA-Seq Reveals AML Hierarchies Relevant to Disease Progression and Immunity. Cell 2019;176:1265–1281.e24. [DOI] [PMC free article] [PubMed] [Google Scholar]
- 53.Somervaille TCP, Matheny CJ, Spencer GJ, Iwasaki M, Rinn JL, Witten DM, et al. Hierarchical Maintenance of MLL Myeloid Leukemia Stem Cells Employs a Transcriptional Program Shared with Embryonic Rather Than Adult Stem Cells. Cell Stem Cell 2009;4:129–40. [DOI] [PMC free article] [PubMed] [Google Scholar]
- 54.Zhou Y, Zhou B, Pache L, Chang M, Khodabakhshi AH, Tanaseichuk O, et al. Metascape provides a biologist-oriented resource for the analysis of systems-level datasets. Nat. Commun 2019;10:1–10. [DOI] [PMC free article] [PubMed] [Google Scholar]
- 55.Tyner JW, Tognon CE, Bottomly D, Wilmot B, Kurtz SE, Savage SL, et al. Functional genomic landscape of acute myeloid leukaemia. Nature 2018;562:526–31. [DOI] [PMC free article] [PubMed] [Google Scholar]
- 56.Mckenzie MD, Ghisi M, Oxley EP, Ritchie ME, Zuber J, Dickins Correspondence RA. Interconversion between Tumorigenic and Differentiated States in Acute Myeloid Leukemia. Cell Stem Cell 2019;25:258–72. [DOI] [PubMed] [Google Scholar]
- 57.Meyers RM, Bryan JG, McFarland JM, Weir BA, Sizemore AE, Xu H, et al. Computational correction of copy number effect improves specificity of CRISPR-Cas9 essentiality screens in cancer cells. Nat. Genet 2017;49:1779–84. [DOI] [PMC free article] [PubMed] [Google Scholar]
- 58.McFarland JM, Ho ZV, Kugener G, Dempster JM, Montgomery PG, Bryan JG, et al. Improved estimation of cancer dependencies from large-scale RNAi screens using model-based normalization and data integration. Nat. Commun 2018;9:1–13. [DOI] [PMC free article] [PubMed] [Google Scholar]
- 59.Mueller D, Bach C, Zeisig D, Garcia-Cuellar MP, Monroe S, Sreekumar A, et al. A role for the MLL fusion partner ENL in transcriptional elongation and chromatin modification. Blood 2007;110:4445–54. [DOI] [PMC free article] [PubMed] [Google Scholar]
- 60.Zhu L, Li Q, Wong SHK, Huang M, Klein BJ, Shen J, et al. ASH1L links histone H3 lysine 36 dimethylation to MLL Leukemia. Cancer Discov 2016;6:770–83. [DOI] [PMC free article] [PubMed] [Google Scholar]
- 61.Krivtsov AV, Evans K, Gadrey JY, Eschle BK, Hatton C, Uckelmann HJ, et al. A Menin-MLL Inhibitor Induces Specific Chromatin Changes and Eradicates Disease in Models of MLL-Rearranged Leukemia. Cancer Cell 2019;36:660–673.e11. [DOI] [PMC free article] [PubMed] [Google Scholar]
- 62.Zuber J, McJunkin K, Fellmann C, Dow LE, Taylor MJ, Hannon GJ, et al. Toolkit for evaluating genes required for proliferation and survival using tetracycline-regulated RNAi. Nat. Biotechnol 2011;29:79–85. [DOI] [PMC free article] [PubMed] [Google Scholar]
- 63.Wang GG, Calvo KR, Pasillas MP, Sykes DB, Häcker H, Kamps MP. Quantitative production of macrophages or neutrophils ex vivo using conditional Hoxb8. Nat. Methods 2006;3:287–93. [DOI] [PubMed] [Google Scholar]
- 64.Sykes DB, Kfoury YS, Mercier E, Janzer A, Schreiber SL, Scadden DT, et al. Inhibition of Dihydroorotate Dehydrogenase Overcomes Differentiation Blockade in Acute Myeloid Leukemia Article Inhibition of Dihydroorotate Dehydrogenase Overcomes Differentiation Blockade in Acute Myeloid Leukemia. Cell 2016;167:171–86. [DOI] [PMC free article] [PubMed] [Google Scholar]
- 65.Simó-Riudalbas L, Pérez-Salvia M, Setien F, Villanueva A, Moutinho C, Martínez-Cardús A, et al. KAT6B is a tumor suppressor histone H3 lysine 23 acetyltransferase undergoing genomic loss in small cell lung cancer. Cancer Res 2015;75:3936–44. [DOI] [PubMed] [Google Scholar]
- 66.Klein BJ, Jang SM, Lachance C, Mi W, Lyu J, Sakuraba S, et al. Histone H3K23-specific acetylation by MORF is coupled to H3K14 acylation. Nat. Commun 2019;10:1–13. [DOI] [PMC free article] [PubMed] [Google Scholar]
- 67.Schaefer EW, Loaiza-Bonilla A, Juckett M, DiPersio JF, Roy V, Slack J, et al. A phase 2 study of vorinostat in acute myeloid leukemia. Haematologica 2009;94:1375–82. [DOI] [PMC free article] [PubMed] [Google Scholar]
- 68.Stein EM, Garcia-Manero G, Rizzieri DA, Tibes R, Berdeja JG, Savona MR, et al. The DOT1L inhibitor pinometostat reduces H3K79 methylation and has modest clinical activity in adult acute leukemia. Blood 2018;131:2662–9. [DOI] [PMC free article] [PubMed] [Google Scholar]
- 69.Sun W, Triche T, Malvar J, Gaynon P, Sposto R, Yang X, et al. A phase 1 study of azacitidine combined with chemotherapy in childhood leukemia: a report from the TACL consortium. Blood 2018;131:1145–8. [DOI] [PMC free article] [PubMed] [Google Scholar]
- 70.Mayer J, Arthur C, Delaunay J, Mazur G, Thomas XG, Wierzbowska A, et al. Multivariate and subgroup analyses of a randomized, multinational, phase 3 trial of decitabine vs treatment choice of supportive care or cytarabine in older patients with newly diagnosed acute myeloid leukemia and poor- or intermediate-risk cytogenetics. BMC Cancer 2014;14:69. [DOI] [PMC free article] [PubMed] [Google Scholar]
- 71.Bradner J, Hnisz D, Young R. Transcriptional Addiction in Cancer. Cell 2017;168:629–43. [DOI] [PMC free article] [PubMed] [Google Scholar]
- 72.Liang J, Prouty L, Williams BJ, Dayton MA, Blanchard KL. Acute Mixed Lineage Leukemia With an inv(8)(p11q13) Resulting in Fusion of the Genes for MOZ and TIF2. Blood 1998;92:2118–22. [PubMed] [Google Scholar]
- 73.MacPherson L, Anokye J, Yeung MM, Lam EYN, Chan YC, Weng CF, et al. HBO1 is required for the maintenance of leukaemia stem cells. Nature 2020;577:266–70. [DOI] [PubMed] [Google Scholar]
- 74.Valerio DG, Xu H, Chen CW, Hoshii T, Eisold ME, Delaney C, et al. Histone acetyltransferase activity of MOF is required for MLL-AF9 leukemogenesis. Cancer Res 2017;77:1753–62. [DOI] [PMC free article] [PubMed] [Google Scholar]
- 75.Chen CW, Koche RP, Sinha AU, Deshpande AJ, Zhu N, Eng R, et al. DOT1L inhibits SIRT1-mediated epigenetic silencing to maintain leukemic gene expression in MLL-rearranged leukemia. Nat. Med 2015;21:335–43. [DOI] [PMC free article] [PubMed] [Google Scholar]
- 76.Jung N, Dai B, Gentles AJ, Majeti R, Feinberg AP. An LSC epigenetic signature is largely mutation independent and implicates the HOXA cluster in AML pathogenesis. Nat. Commun 2015;6:1–12. [DOI] [PMC free article] [PubMed] [Google Scholar]
- 77.Katsumoto T, Aikawa Y, Iwama A, Ueda S, Ichikawa H, Ochiya T, et al. MOZ is essential for maintenance of hematopoietic stem cells. Genes Dev 2006;20:1321–30. [DOI] [PMC free article] [PubMed] [Google Scholar]
- 78.Sheikh BN, Yang Y, Schreuder J, Nilsson SK, Bilardi R, Carotta S, et al. MOZ (KAT6A) is essential for the maintenance of classically defined adult hematopoietic stem cells. Blood 2016;128:2307–18. [DOI] [PubMed] [Google Scholar]
- 79.Thomas T, Corcoran LM, Gugasyan R, Dixon MP, Brodnicki T, Nutt SL, et al. Monocytic leukemia zinc finger protein is essential for the development of long-term reconstituting hematopoietic stem cells. Genes Dev 2006;20:1175–86. [DOI] [PMC free article] [PubMed] [Google Scholar]
- 80.Ponomarev V, Doubrovin M, Serganova I, Vider J, Shavrin A, Beresten T, et al. A novel triple-modality reporter gene for whole-body fluorescent, bioluminescent, and nuclear noninvasive imaging. Eur. J. Nucl. Med. Mol. Imaging 2004;31:740–51. [DOI] [PubMed] [Google Scholar]
- 81.Shi Z, Xu S, Xing S, Yao K, Zhang L, Xue L, et al. Mettl17, a regulator of mitochondrial ribosomal RNA modifications, is required for the translation of mitochondrial coding genes. FASEB J 2019;33:13040–50. [DOI] [PubMed] [Google Scholar]
- 82.Love MI, Huber W, Anders S. Moderated estimation of fold change and dispersion for RNA-seq data with DESeq2. Genome Biol 2014;15:550. [DOI] [PMC free article] [PubMed] [Google Scholar]
- 83.Langmead B, Salzberg SL. Fast gapped-read alignment with Bowtie 2. Nat. Methods 2012;9:357–9. [DOI] [PMC free article] [PubMed] [Google Scholar]
- 84.Li H, Handsaker B, Wysoker A, Fennell T, Ruan J, Homer N, et al. The Sequence Alignment/Map format and SAMtools. Bioinformatics 2009;25:2078–9. [DOI] [PMC free article] [PubMed] [Google Scholar]
- 85.Quinlan AR, Hall IM. BEDTools: A flexible suite of utilities for comparing genomic features. Bioinformatics 2010;26:841–2. [DOI] [PMC free article] [PubMed] [Google Scholar]
- 86.McCarthy DJ, Chen Y, Smyth GK. Differential expression analysis of multifactor RNA-Seq experiments with respect to biological variation. Nucleic Acids Res 2012;40:4288–97. [DOI] [PMC free article] [PubMed] [Google Scholar]
- 87.Robinson MD, McCarthy DJ, Smyth GK. edgeR: A Bioconductor package for differential expression analysis of digital gene expression data. Bioinformatics 2009;26:139–40. [DOI] [PMC free article] [PubMed] [Google Scholar]
- 88.Yu G, Wang LG, He QY. ChIP seeker: An R/Bioconductor package for ChIP peak annotation, comparison and visualization. Bioinformatics 2015;31:2382–3. [DOI] [PubMed] [Google Scholar]
- 89.Tang Z, Li C, Kang B, Gao G, Li C, Zhang Z. GEPIA: A web server for cancer and normal gene expression profiling and interactive analyses. Nucleic Acids Res 2017;45:W98–102. [DOI] [PMC free article] [PubMed] [Google Scholar]
- 90.Sidoli S, Bhanu NV, Karch KR, Wang X, Garcia BA. Complete workflow for analysis of histone post-translational modifications using bottom-up mass spectrometry: From histone extraction to data analysis. J. Vis. Exp 2016;2016:54112. [DOI] [PMC free article] [PubMed] [Google Scholar]
- 91.Yuan ZF, Sidoli S, Marchione DM, Simithy J, Janssen KA, Szurgot MR, et al. EpiProfile 2.0: A Computational Platform for Processing Epi-Proteomics Mass Spectrometry Data. J. Proteome Res 2018;17:2533–41. [DOI] [PMC free article] [PubMed] [Google Scholar]
- 92.Martens L, Hermjakob H, Jones P, Adamsk M, Taylor C, States D, et al. PRIDE: The proteomics identifications database. Proteomics 2005;5:3537–45. [DOI] [PubMed] [Google Scholar]
Associated Data
This section collects any data citations, data availability statements, or supplementary materials included in this article.