. 2022 Feb 25;11:e71994. doi: 10.7554/eLife.71994

Figure 2. Sensitivity, specificity and accuracy.

(A) Recovery rate for up gene signatures across five noise levels by the four methods. Each dot represents one dataset. At each noise level, average of all datasets is used to represent the performance of each method. (B) Similarly, for down signatures. (C) Percentages of false up and down signatures. The size of the dots corresponds to the percentages of all the signatures tested. Because the contrasting groups are generated by down sampling, no signatures are expected to be identified. The numbers below the heatmap are the average percentage. (D) Accuracy of the three methods, separated into up and down signatures. Accuracy is calculated as the agreement with consensus calls by at least two methods.

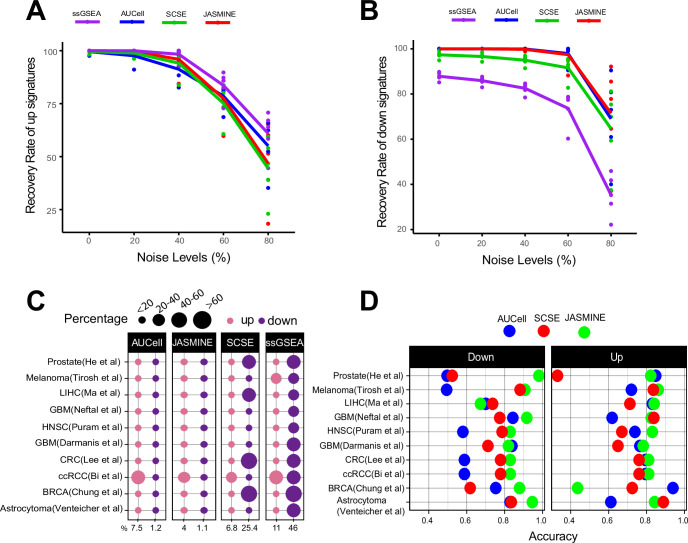
Figure 2—source data 1. Source data for Figure 2.

Figure 2.

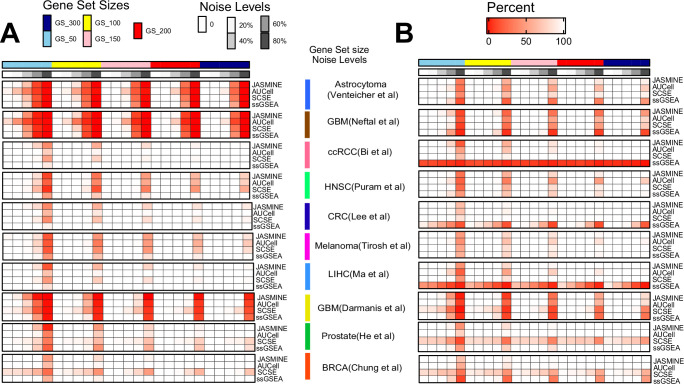
Figure 2—figure supplement 1. Benchmarking sensitivity using simulated gene signatures.

Figure 2—figure supplement 1.

We simulated four gene set sizes (50, 100, 150, 200, and 300), each with five levels of noise (0, 20, 40, 60, and 80%). For each size/noise combination, we randomly generated 1000 signatures. The results shown in this figure are percentage of the 1000 random signatures. (A) Detection sensitivity for up gene signatures. Deeper color indicates lower recovery rates (thus more misses). (B) Detection sensitivity for down signatures.
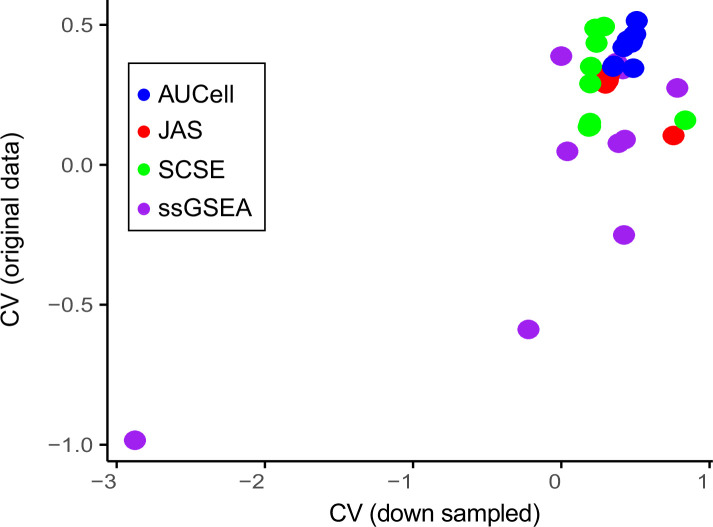
Figure 2—figure supplement 2. Coefficient of Variance.

Figure 2—figure supplement 2.

Average coefficient of variance between the original datasets and the 50% down-sampled datasets. Each dot represents one dataset.
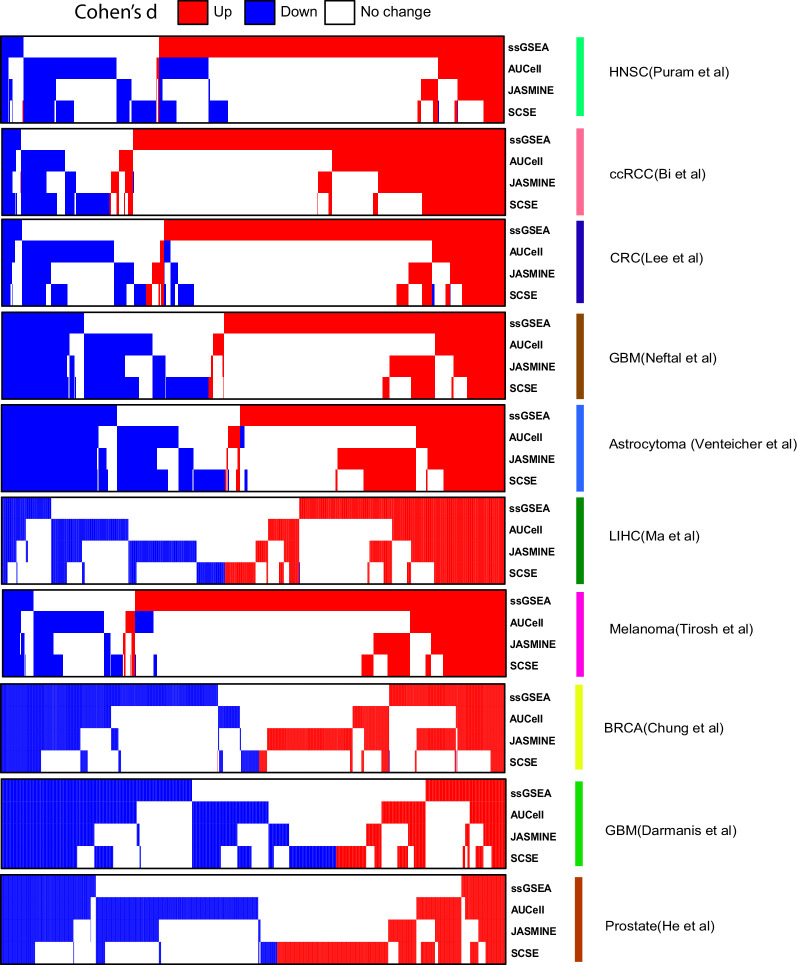
Figure 2—figure supplement 3. Comparison of calling results from the four methods across the seven datasets.

Figure 2—figure supplement 3.

In heatmap, each column represents one signature. Blue, down signature; red, up signature.
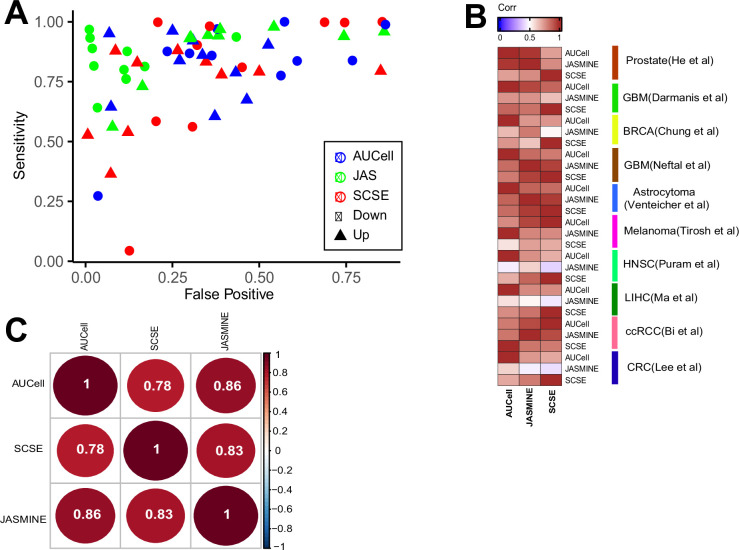
Figure 2—figure supplement 4. Consistency with consensus and pairwise comparison.

Figure 2—figure supplement 4.

(A) Sensitivity and false positive benchmarked against the consensus calls (signatures called by at least two methods). (B) Spearman correlation of Cohen’s d broken down to each dataset. (C) Consistency between three methods, numbers are Spearman correlation coefficients.
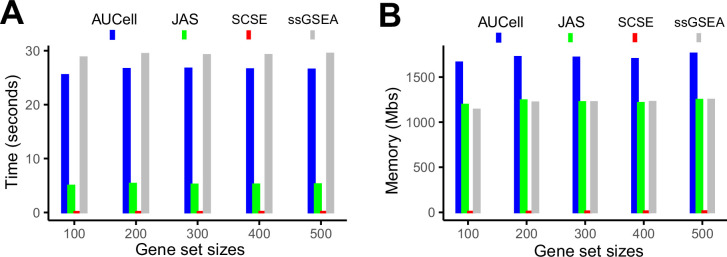
Figure 2—figure supplement 5. Evaluation of computing cost.

Figure 2—figure supplement 5.

(A) Average time consumption for completing 50 gene signatures using a 2.2 GHz, 32 GB memory CPU. (B) Memory cost for completing 50 gene signatures using a 2.2 GHz, 32 GB memory CPU.