



Abstract
Asthma is a chronic disease of childhood, but for unknown reasons disease activity sometimes subsides as children mature. Here, we present clinical and animal model evidence suggesting that the age-dependency of childhood asthma stems from an evolving host response to respiratory viral infection. Using clinical data, we show that societal suppression of respiratory virus transmission during COVID-19 lockdown disrupted the traditional age gradient in pediatric asthma exacerbations, connecting the phenomenon of asthma remission to virus exposure. In mice, we show that asthmatic lung pathology triggered by Sendai virus (SeV) or influenza A virus (IAV) is highly age-sensitive: robust in juvenile mice (4–6 weeks old) but attenuated in mature mice (>3 months old). Interestingly, allergen induction of the same asthmatic traits was less dependent on chronological age than viruses. Age-specific responses to SeV included a juvenile bias towards type-2 airway inflammation that emerged early in infection, while mature mice exhibited a more restricted bronchiolar distribution of infection that produced a distinct type-2 low inflammatory cytokine profile. In the basal state, aging produced changes to lung leukocyte burden, including the number and transcriptional landscape of alveolar macrophages (AMs). Importantly, depleting AMs in mature mice restored post-SeV pathology to juvenile levels. Thus, aging influences chronic outcomes of respiratory viral infection through regulation of the AM compartment and type-2 inflammatory responses to viruses. Our data provide insight into how asthma remission might develop in children.
Keywords: Asthma, viruses, aging, inflammation, remission
INTRODUCTION
Asthma is a common lung disease characterized by paroxysms of airway obstruction, airway hyper-responsiveness, and inflammation. In susceptible individuals, the disease arises when infectious agents, allergens, or irritants trigger a stereotypical pattern of airway pathology, which is then exacerbated through recurrent exposures to these agents over time. Histologic asthma phenotypes include airway mucous cell metaplasia, peri-bronchial infiltration of immune cells, and airway wall thickening (1). Although asthma can arise at any age, most patients first present in early childhood (under 6 years-old), often in association with a viral wheezing illness (2, 3). Childhood-onset asthma is often marked by a “type 2” pattern of airway inflammation that includes airway eosinophilia and the secretion of certain cytokines like interleukin (IL)-4, IL-5, and IL-13 (4).
The triggers that drive asthma exacerbations are ubiquitous and asthma is commonly regarded as a lifelong disease. However, permanent symptoms are not inevitable for many patients, especially those diagnosed with asthma in early life (5). Roughly 50% of children diagnosed with asthma before the age of six will experience remission of their symptoms by early adulthood, and 20–25% of cases will achieve resolution of their airway hyper-responsiveness (6, 7). Population studies indicate that asthma exacerbation rates fall progressively as children age, reaching a nadir by early adulthood (8). Why some children with asthma “age out” of their exacerbations is poorly understood.
One clue about the origins of asthma remission is that the seasonality of asthma exacerbations wanes as children mature (9, 10). This observation might imply a developmental process that mutes host responses to seasonal triggers of asthma exacerbations, like viruses and allergens, and leads to a reduction in airway pathology elicited by these agents. Over time, clinical asthma remission might thus be achieved in developing children. Among seasonal asthma triggers, respiratory viruses play an outsize role in children as they can be isolated from 80% of young patients presenting with an asthma exacerbation, regardless of the perceived exposure that precipitated the exacerbation (11). While many viral illnesses exhibit an age-tropism in general, little is known about how common viral exposures shape the natural history of asthma exacerbations. Here, we examined the relationship between age and the ability of common viruses to promote asthmatic lung pathology. Our results have implications for the natural history of childhood asthma and for the origins of asthma remission.
MATERIALS AND METHODS
Clinical Data Extraction.
This study was approved by the Washington University School of Medicine Human Research Protection Office. We extracted de-identified EMR data from children 0–18 years old who visited the Washington University St. Louis Children’s Hospital Emergency Department (ED) or who were hospitalized with a chief diagnosis of asthma or allergic reaction from March 14, 2016 to March 29, 2021. Data collected included ICD9/10 codes (J45, J45.20, J45.21, J45.22, J45.30, J45.31, J45.32, J45.40, J45.41, J45.42, J45.50, J45.51, J45.52, J45.991, J45.902, J45.9, J45.99, J45.901, J45.909, T78.4, J39.3, J30.89, L50.0, J30.9, J30.2, J30.8, H10.11/H10.12, Y55.5/J1200, 493.X, 995.3/708.0/287.0, V13.81/995.0), date of encounter, time of encounter, and age of patient at encounter. To examine respiratory viral burden, we obtained weekly tallies of virus identifications by the St. Louis Children’s Hospital Microbiology Laboratory detections from March 2016 to March 2021. Virologic assays included multiplex PCR testing and rapid antigen tests for influenza, and respiratory syncytial virus (RSV). All EMR data fitting the a priori defined ICD9/10 codes were included in the analysis. Because lockdown measures officially began on March 23, 2020 in our region (12), we defined each preceding 12 month period before lockdown as a “year” for the purpose of comparison.
Mice.
C57BL/6J mice (4–8 weeks old, 20–25g) were sourced from Jackson Laboratories and acclimatized at least one week before use. We employed a range of ages spanning 5 weeks to 18 months for experiments. In some experiments, older mice (>9 months) were sourced from retired C57BL/6J breeders obtained from the Washington University School of Medicine Micro-injection Core/Gnotobiotic Facility. Unless stated, male mice were used for experiments. Mice were housed in a standard 12-hour light-dark cycle, with unlimited food and water available. All experiments were approved by the Washington University School of Medicine Animal Care and Use Committees.
Virus infections.
Sendai virus (SeV VR-105; Sendai/52) and Influenza A virus (IAV A/WS/33 H1N1) were obtained from ATCC. Viruses were plaque purified, propagated in embryonated chicken eggs as described (13). SeV at various doses or 5 pfu of H1N1 influenza A virus was intranasally administered to mice in 30μl of PBS as described (13, 14).
Microbiome depletion.
Mice were treated with broad-spectrum antibiotics to deplete and normalize their microbiomes as described (15). Three weeks before SeV infection, water provided to mice was replaced for two weeks by either control sugar solution (20 g/L grape Kool-Aid™) or high dose VNAM solution (sugar solution plus 0.5 g/L vancomycin, 1 g/L neomycin, 1 g/L ampicillin, and 1g/L metronidazole (Sigma-Aldrich)). Then, for the week prior to and one week after SeV infection mice received a low dose VNAM solution (25g/L sugar solution plus 0.35 g/L vancomycin, and 0.75 g/L metronidazole (Sigma-Aldrich)) or control sugar solution. Stool samples were obtained prior to VNAM treatment, on the day of virus infection, and on the day VNAM treatment ended. To confirm microbiome depletion, stool DNA was extracted from fresh samples using a commercial kit (Qiagen), and DNA content per mg stool was determined using a Nanodrop 2000 spectrophotometer (Thermo).
Microbiome analysis.
Stool DNA obtained from juvenile and mature mice was extracted using a commercial kit (Qiagen). Normalized fecal DNA obtained from juvenile and mature mice was subjected to V4–16S rRNA PCR as previously described (16) using custom Illumina adapted primers. Briefly, these primers were designed to support combinatorial based demultiplexing of samples based on their position within a 96 well plate. The forward primer contains a 5’ Illumina specific i7 sequence, followed by a plate specific barcode (italics), a primer pad site, a linker sequence, a row-specific sequence (underlined) (17), then the V4–16S 515F sequence (18) on the 3’ end:
5’-CAAGCAGAAGACGGCATACGAGAT-XXXXXXXX-GTGACTGGAGTTCAGACGTGTGCTCTTCCGATCT-AC-XXXXXXXX-GTGYCAGCMGCCGCGGTAA-3’.
The reverse primer contains a 5’ Illumina i5 sequence, followed by a primer pad site, a linker sequence, a column-specific sequence (underlined), then a 3’ V4–16S 806R sequence (19):
5’-AATGATACGGCGACCACCGAGATCTACAC-TCTTTCCCTACACGACGCTCTTCCGATCT-GT-XXXXXXXX-GGACTACNVGGGTWTCTAAT-3’.
Following PCR, V4–16S amplicons were quantitated, pooled in an equimolar ratio, then purified (Ampure XP beads; Beckman Coulter) before sequencing on an Illumina MiSeq instrument using 2 × 250 base pair chemistry. Following demultiplexing, reads were trimmed and then Amplicon sequence variants (ASVs) were generated using the large-data adapted pipeline for DADA2 version 1.10.1 in R (20). Sequences were classified to the highest taxonomic resolution possible using the RDPClassifier and a minimum bootstrap support of 80% (21). Analysis of ASV abundance was performed in R version 3.5.3 using phyloseq version 1.26.1 (22). Bray-Curtis distances were used to perform principal coordinates analysis on mouse microbiota over the treatment interval.
AM depletion.
Mice were intranasally treated with clodronate liposomes like prior reports (23). Briefly, isoflurane-anesthetized mice were intranasally administered 40 μl high potency clodronate liposomes (20 mg/mL) or control liposomes (FormuMax) 4 days and 2 days prior to SeV infection.
RNA extraction and quantitative PCR (qPCR).
RNA extraction and qPCR were done according to standard protocols (13). At indicated times after infection, lungs were manually excised and immersed in RNAlater solution (Applied Biosystems). Total RNA was isolated from lung homogenates using RNeasy Mini Kits (Qiagen). Reverse transcription was carried out using the Applied Biosystems High Capacity cDNA Reverse Transcription Kit. Real Time qPCR was performed on the ABI 7500 Fast Real-Time PCR system. We employed commercial primers (IDT) for qPCR analysis of Muc5ac, Tbp, Il13, Mmp12, Alox12e, Chi3l3, Retnla, Arg1, Il33, Trem2. SeV qPCR analysis was conducted as described (13).
Bulk RNA Sequencing.
Bulk RNAseq was performed at the Washington University Genome Technology Access Center (GTAC) using standard protocols. RNA from whole lung homogenates were converted to cDNA libraries for sequencing using the RiboZero Kit (Sigma Aldrich). To obtain BAL cell RNA, BALs from n=9 mice were combined into 3 pools for each age group and the cells were pelleted by centrifugation at 3,000 × g for 5 minutes. Cell pellets were resuspended in RLT buffer and RNA was extracted using the RNAeasy kit (QIAGEN). BAL cell RNA libraries were generated using the SMARTer kit (Clontech). Sequencing was carried out on a NovaSeq6000 instrument (Illumina). RNA-seq reads were aligned to the Ensembl release 76 assembly with STAR version 2.0.4b. Gene counts were derived from the number of uniquely aligned unambiguous reads by Subread:featureCount version 1.4.5. Transcript counts were produced by Sailfish version 0.6.3. Sequencing performance was assessed for total number of aligned reads, total number of uniquely aligned reads, genes and transcripts detected, ribosomal fraction known junction saturation, and read distribution over known gene models with RSeQC version 2.3. All gene-level and transcript counts were then imported into the R/Bioconductor package EdgeR and TMM normalization size factors were calculated to adjust for sample differences in library size. Genes or transcripts not expressed in any sample were excluded from further analysis. The TMM size factors and the matrix of counts were imported into R/Bioconductor package Limma (24), and weighted likelihoods based on the observed mean-variance relationship of every gene/transcript were then calculated for all samples with the Voom function (25). Performance of the samples was assessed with a Spearman correlation matrix and multi-dimensional scaling plots. Gene/transcript performance was assessed with plots of residual standard deviation of every gene to their average log-count with a fitted trend line of the residuals. Generalized linear models with dispersion estimates were then created to test for gene/transcript level differential expression. Differentially expressed genes and transcripts were then filtered for FDR adjusted p-values less than or equal to 0.05. To examine age-associated differential gene expression in BAL samples, Log2 normalized Voom-adjusted CPM data was analyzed for statistical significance by the Kruskal–Wallis one-way analysis of variance by ranks.
Single Cell RNA Sequencing (scRNAseq) of BAL cells.
Pooled BAL cell samples from healthy juvenile (6 weeks-old, n=10) and mature (12 months old, n=9) mice were subjected to scRNAseq at the Washington University Genome Technology Access Center (GTAC) using standard protocols. Single cell barcoded cDNA libraries were generated using a Chromium microfluidics platform (10x Genomics) and the Chromium Single Cell 3ʹ GEM, Library & Gel Bead Kit v3 (10x Genomics). Sequencing was carried out on a NovaSeq6000 instrument (Illumina). Sequencing data was processed using Cell Ranger version 3.1, starting with demultiplexed FASTQ files and using GRCm38–2.0.1 as the reference genome. Processed scRNAseq data was analyzed using R version 3.6.2. and the SEURAT v3 package as described (26) (available at https://satijalab.org/seurat/). We used previously published marker genes to type cell clusters identified on UMAP analysis (27, 28).
Morphometry.
Lungs were fixed by inflation with 10% buffered formalin under 20 cmH2O of pressure, paraffin imbedded, and stained with PAS or subjected to immunofluorescence (IF) staining using standard techniques (13). PAS-stained slides were scanned using a Hamamatsu Nanozoomer at the Alafi Neuroimaging lab at Washington University, and PAS positive pixels were counted using Aperio ScanScope Software as described (29). For immunofluorescence experiments, we utilized antibodies directed against SeV (Abcam, Cat. #ab33988, 1:500 dilution), followed by Alexa Fluor-conjugated secondary antibodies and DAPI counterstain (Invitrogen). Stained slides were visualized using an Olympus BX51 microscope and a Retiga-2000R camera system (QImaging). We used a double-blind design to quantitate SeV infection in lung histological sections. After masking sample identification, 5 microscopic fields were randomly selected at 10X magnification per lung section. SeV+ and total cell counts were quantified using ImageJ software.
Broncheoalveolar Lavage (BAL) and Cytokine Analysis.
BAL analysis was performed as described (13). Mice were euthanized, and their tracheas were cannulated with a 20G flexible catheter, 1–2 mm distal to the larynx. The lungs were then slowly lavaged in 2 passes with a total of 1 ml sterile phosphate buffered saline (PBS). For BAL cell counts, 50 μl of BAL suspension was adsorbed to frosted glass slides using a Cytospin 4 centrifuge (Thermo Fischer) and treated with Diff-Kwik stain (Thermo Fischer). Slides were then digitally scanned at 20X magnification using a Nanozoomer HT imaging system (Hamamatsu). To quantify cell number, scanned slides were analyzed via ImageScope software (Leica) using the “Nuclear v9” algorithm, which counts nuclei in histologically stained samples. For BAL cell differential, sample identifications were blinded and 5 random 40x fields were captured as TIFF files using ImageScope software. Cells in each field were then scored as either lymphocytes, macrophages, or neutrophils by a separate investigator also blinded to the sample ID. A minimum of 50 cells were counted per biological specimen. BAL protein concentration was quantified using Bradford reagent (Sigma) according to standard protocols. BAL cytokine levels were analyzed at the Washington University Immunomonitoring Core Facility on a FLEXMAP 3D instrument (Luminex) and using the Mouse Cytokine and Chemokine Panel 1A (Affymetrix), according to the manufacturer’s instructions.
Lung Mechanics Measurement.
Airway resistance was measured using a Buxco Elan RC mouse volume-controlled ventilator as described (13). Briefly, mice were anesthetized by i.p. injection of ketamine/xylazine cocktail, then tracheostomy was performed using a 22-gauge flexible catheter. Mice were then ventilated and given progressively doubled concentrations of methacholine through an in-line nebulizer. Inspiratory resistance measurements were averaged over three-minute intervals after each dose. Mice were euthanized after lung mechanics measurements.
Mass and Flow Cytometry.
Single lung cell suspensions were prepared using Liberase-TM and DNase in RPMI (Roche) essentially as described (13). Cells were stained using panels of metal-conjugated antibodies or fluorophore-conjugated antibodies for mass and flow cytometry, respectively (Supplemental Table 1). Mass Cytometry was carried out at the Washington University Immunomonitoring Laboratory using a CyTOF2/Helios instrument (Fluidigm) and analyzed using CytoBank software as described (30). Flow cytometry was performed at the Washington University Siteman Flow Cytometry Core using an Attune NxT instrument (ThermoFischer) and was analyzed using FlowJo software (BD Biosciences). See Supplemental Figs. 3A,B for representative gating strategies for mass and flow cytometry, respectively. For flow cytometry 50,000 events per sample were targeted.
DQ-Ova assay.
DQ-Ova assay was conducted like prior reports (31). Isoflurane-anesthetized mice were intranasally treated with 30 μg DQ-Ova (Thermo Fischer) in 30 μl of sterile PBS. Two hours later, mice were euthanized, and flow cytometry of whole lung cell suspensions was conducted as above using an antibody cocktail (Supplemental Table 1). A representative gating strategy is presented in Supplemental Fig. 3C.
Statistics.
For statistical testing of flow-cytometric, qPCR, and BAL cytokine data, Student’s T-tests were performed on log-normalized data as recommended (32) using Microsoft Excel. For survival curve analysis the log-rank test was used. UMAP analysis was performed using the SEURAT package in R. viSNE analysis of mass cytometry data was performed using CytoBank software. Principal component analysis of BAL cytokines and mass cytometry data was performed in Microsoft Excel using a freeware add-in (available at http://wak2.web.rice.edu/bio/Kamakura_Analytic_Tools.html). Functional enrichment analysis was conducted using DAVID v6.8 software (33, 34) (available at https://david.ncifcrf.gov/home.jsp). For correlating cytokine levels to airway mechanics we calculated the Pearson correlation coefficient to rank ordered values, and converted this to a p value using a Student’s two-tailed T-test. All morphometric analyses were double blinded.
Resource Availability.
This study did not generate new reagents. Bulk and single cell RNA seq data (Figs. 9 and 10) is available through NIH GEO (accession #:GSE185260 https://www.ncbi.nlm.nih.gov/geo/query/acc.cgi). R code for analyzing single cell RNAseq data in SEURAT can be found at the following link: https://www.dropbox.com/s/ovikd97763kn1y5/Hazan%20et%20al_ScRNA%20analysis%20R%20code.pdf?dl=0
Figure 9. Alveolar macrophage reprogramming with aging.
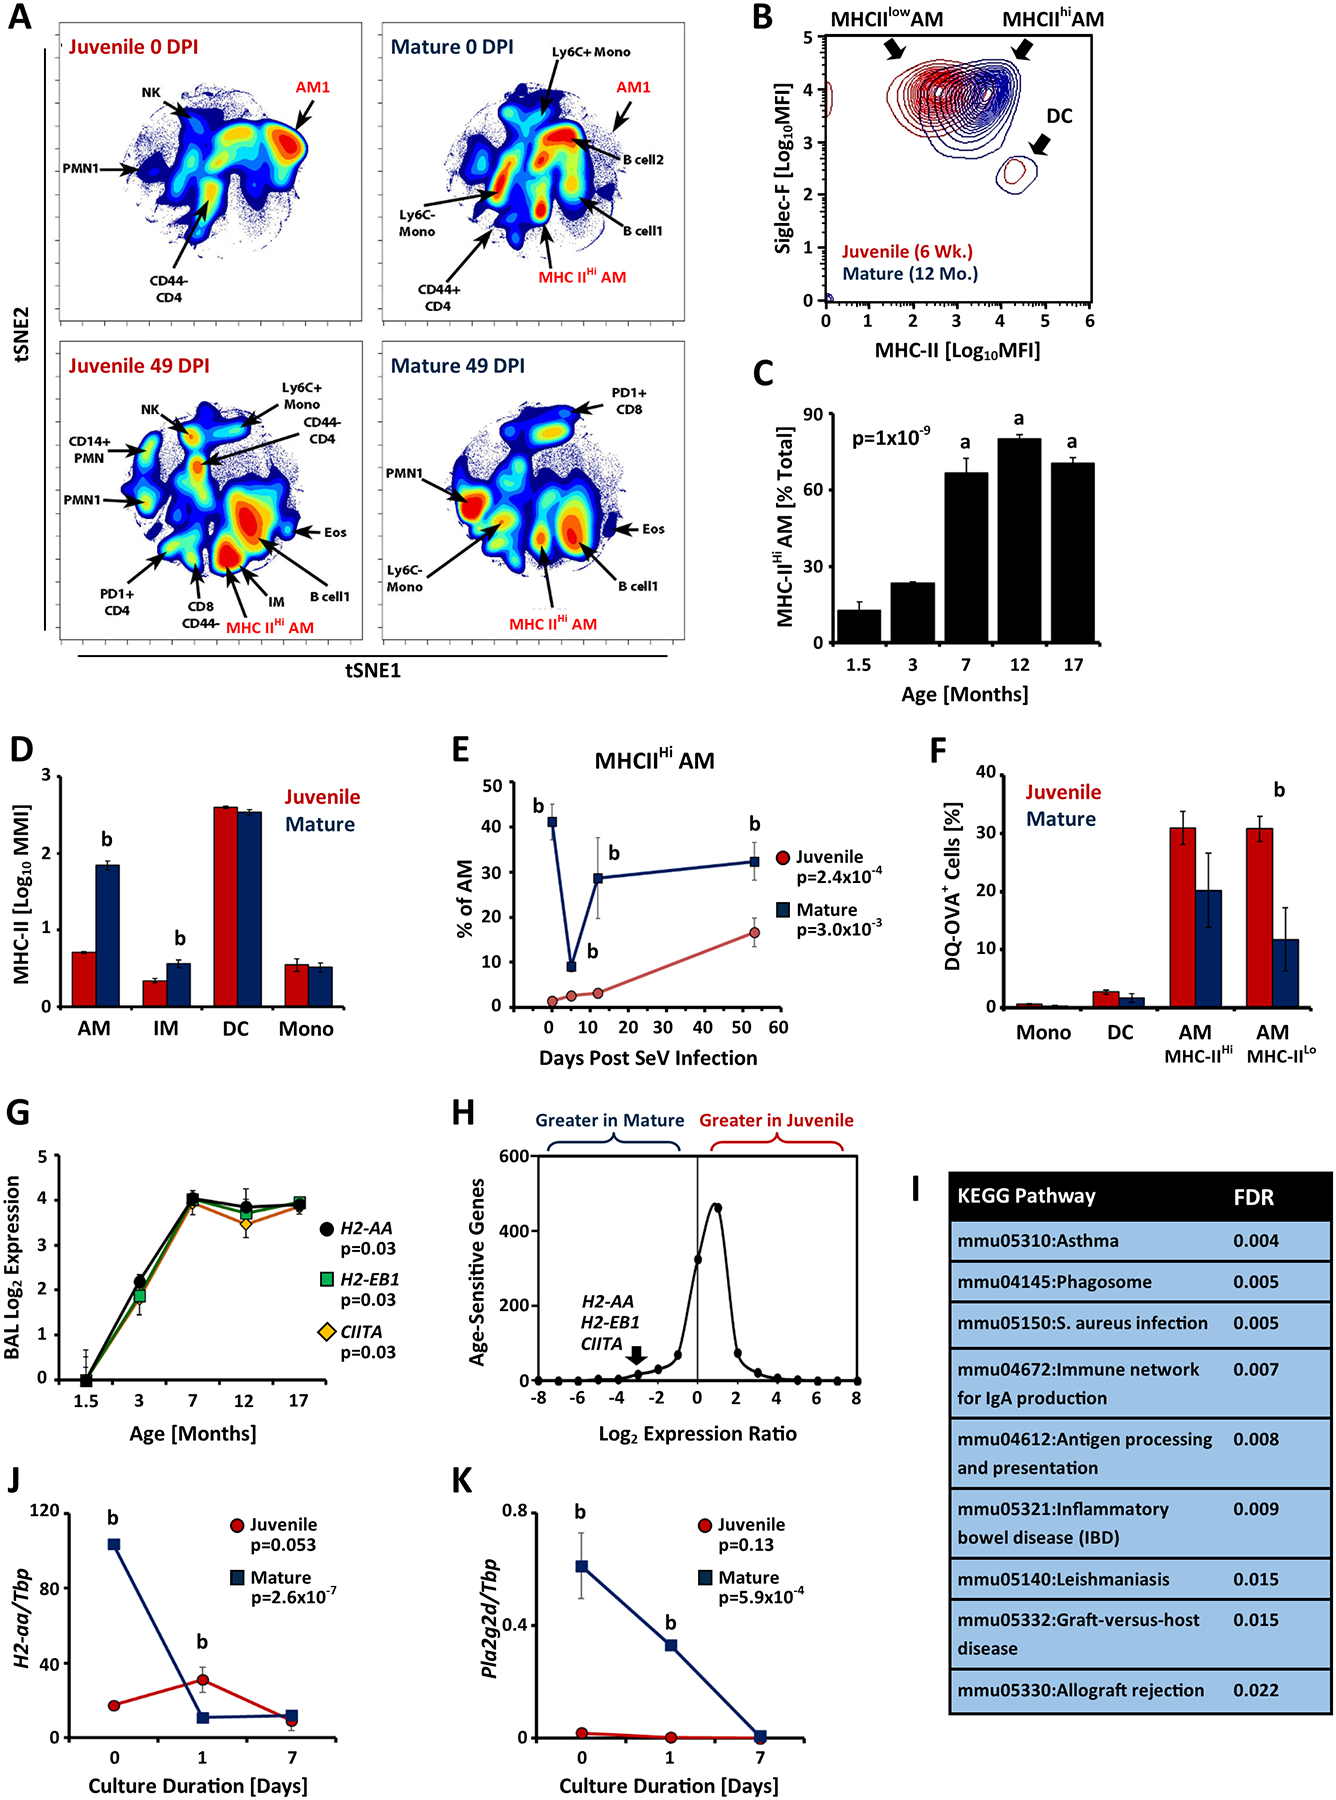
(A) viSNE analysis of mass cytometry from juvenile (5 weeks old) and mature mice (11 months old). The top row represents data from naïve mice (0 DPI) and the bottom row SeV 49 DPI (1.5×10⁵ pfu/mouse). Specific cell types are denoted, and AM populations are labeled in red. (B) Representative flow cytometric contour plot depicting CD45+, CD11bmid/lo, CD11C+ cells from juvenile and mature healthy mice. AM populations are distinguished by high surface expression of Siglec-F and dendritic cells (DCs) by lower surface expression. Data are pooled from two independent experiments (n=5, 300,000 events per age group). See Supplemental Fig. S3B for representative gates. (C) Frequency of MHC-IIHi AMs as a function of age (mean ± SE, n=5 per group). Statistical significance by 1-way ANOVA of log-normalized data is depicted. (D) Expression of MHC-II protein in various lung myeloid cell types as determined by mass cytometry. Bars represent the median metal intensity (MMI) ± SE in healthy juvenile (n=7) and mature mice (n=7). (E) Effect of SeV infection (1×10⁵ pfu/mouse) on the frequency of MHC-IIHi AMs (mean ± SE, n=4–7 per time point) expressed as a percentage of total AMs. (F) Antigen processing activity in various lung myeloid cell types from 6 week juvenile and 12-month mature mice as measured by the DQ-OVA assay (see Methods). Bars represent mean ± SE (n=10 per group pooled from two independent experiments). See Supplemental Fig. 3C for representative gates. (G) BAL expression of H2-AA, H2-EB1, and CIITA in healthy mice as a function of age as measured by bulk RNAseq. Data represents mean Lima-Voom transformed Log2 CPM ± SE (n=3 pools/timepoint each composed of 3 mice). Statistical significance via one-way Kruskal-Wallis test is depicted for each gene. (H) Histogram analysis of 1,024 genes demonstrating age-sensitive expression in BALs (p<0.05, one-way Kruskal-Wallis test). The x-axis represents log2 mean expression ratios for mature (≥7 months old) divided by juvenile gene expression (≤3 months old). The bin containing H2-aa, H2-eb1, and Ciita is highlighted (arrow). (I) KEGG pathway functional enrichment analysis of 1,024 genes demonstrating age-sensitive expression in BALs. Statistically enriched pathways (FDR<0.05) are depicted. Blue highlighting reflects that the enrichment of these pathways is dependent in genes overexpressed in mature vs. juvenile mice. (J, K) BAL cell expression of H2-aa (J) and Pla2g2d (K) as a function on in vitro culture duration (mean ± SE, n=3–7 per time point). Statistical significance via one-way Kruskal-Wallis test is depicted. ap<0.05 SeV-infected vs. PBS-treated; bp<0.05 juvenile vs. mature, Student’s 2-Tailed t-Test on log-normalized data.
Fig. 10. Single cell transcriptomic analysis of AM aging.
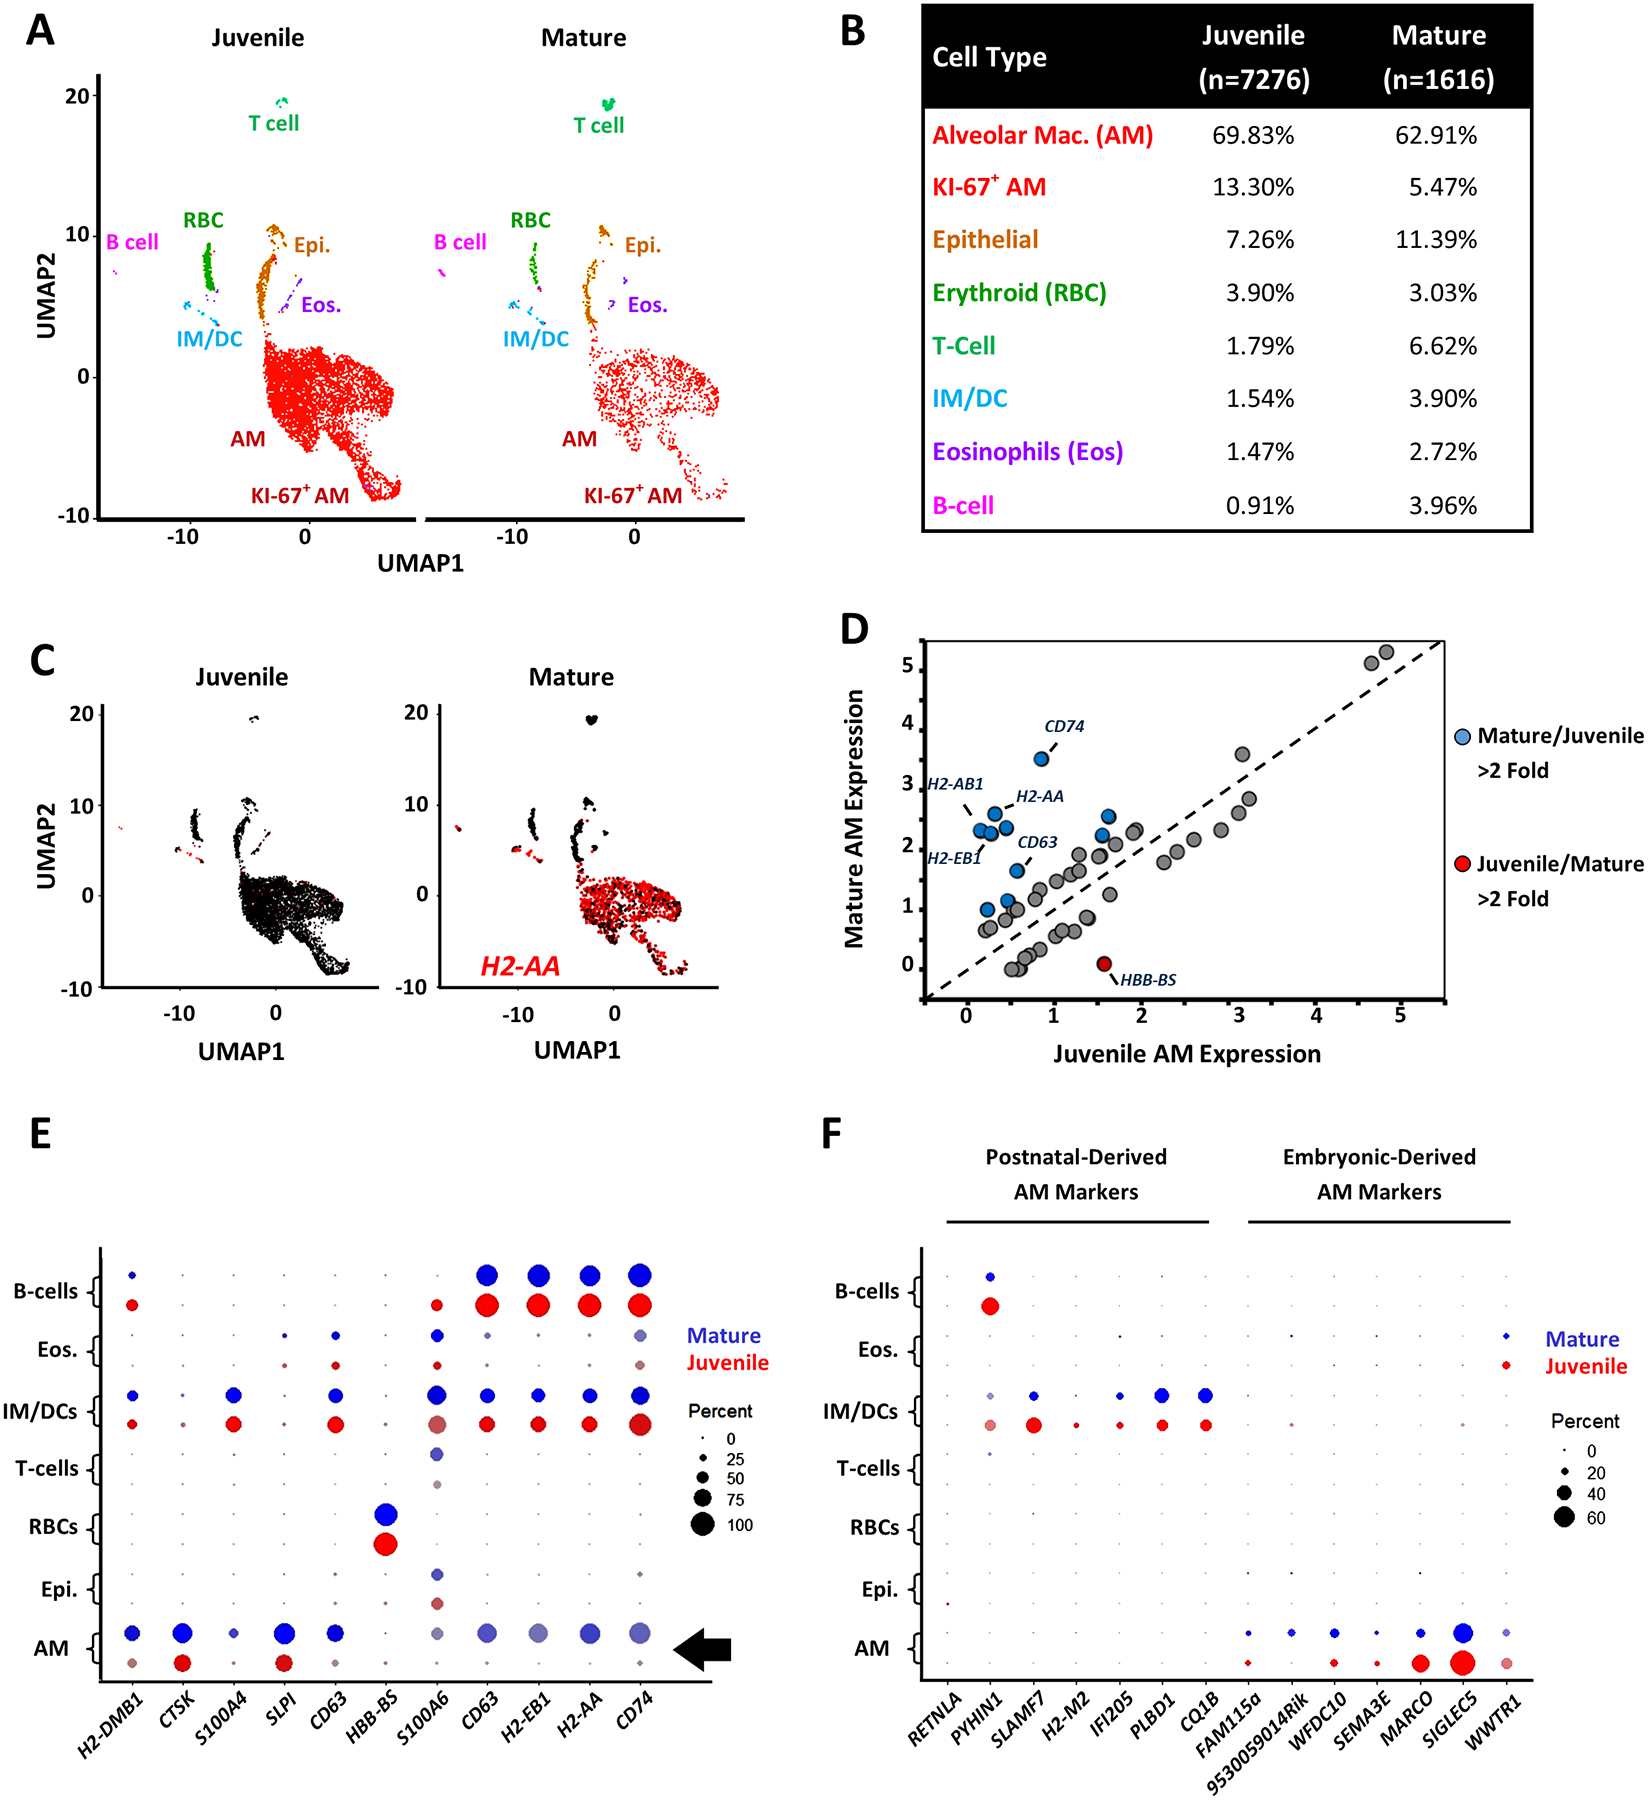
(A) UMAP principal component analysis of scRNAseq data obtained from pooled mouse BALs from juvenile (6 weeks old, n=10, 7,276 cells) and mature mice (12 months old, n=9, 1,616 cells). Major cell types observed are depicted. (B) BAL cell differential in healthy juvenile and mature mice. (C) UMAP visualization of H2-AA expression (orange dots) in juvenile and mature AMs. (D) Top 25 differentially expressed genes in AMs. Genes differentially expressed greater than twofold in juvenile and mature mice are depicted with red and blue dots, respectively. The dashed line represents equal expression in juvenile and mature AMs (loge CPM). (E) Dot plot analysis of genes differentially expressed greater than twofold in juvenile and mature mice (see colored symbols, panel (D)). Expression in AMs is highlighted (arrow). (F) “Dot Blot” expression analysis of marker genes specifying embryonically derived tissue resident AMs postnatal (bone marrow-derived) AMs (23).
RESULTS
The age gradient in childhood asthma exacerbations depends on viral exposure.
On a population level, rates of asthma exacerbations decline as children mature (8). To examine role of viruses in this phenomenon we analyzed how societal measures imposed during the ongoing COVID-19 pandemic affected the age-gradient in pediatric asthma exacerbations (Fig. 1). In response to COVID-19, states enacted “lockdown measures” beginning in the Spring of 2020 including face mask use, social distancing, school closures, and the suspension of public venues. While the intent of these lockdown measures was to limit the spread of SARS-CoV-2, they had the side effect of suppressing common respiratory viruses (35). Recent studies have leveraged COVID-19 lockdown as a “natural experiment” to infer the role of viral infection in various diseases (36–38), but have not previously considered disease timing. We retrospectively analyzed emergency department (ED) visits for asthma at our institution, comparing the 12-month period following the introduction of lockdown measures to 4 years prior to lockdown (see Methods). COVID-19 lockdown was highly successful in suppressing respiratory virus positivity in our area, reducing yearly rates of positive tests by 70.2% (p<0.001, Mann Whitney U-Test). In the 4 years prior to lockdown, ED visits for asthma exhibited a stereotypical age distribution (8), in which exacerbation frequency was maximal in 3–4 year-old children and then linearly declined with older age (Fig 1A). Strikingly, in the year after lockdown the age distribution of ED asthma visits was uniform (Fig. 1A). Additionally, the effectiveness of lockdown in lowering asthma exacerbations was inversely proportional to age (Fig. 1B). This contrasts with ED visits for allergic reactions, which showed a similar age distribution before and after lockdown (Fig. 1C). Additionally, the ability of lockdown to suppress ED presentations was independent of age (Fig. 1D). Because COVID-19 lockdown was a viral mitigation intervention, these data suggest a causal role for common respiratory viruses in driving the traditional age-gradient in pediatric asthma exacerbations. Further, they suggest that the ability of common respiratory viruses to provoke clinically apparent asthma exacerbations might wane as children mature.
Figure 1. Viruses are critical for the age effect in pediatric asthma.
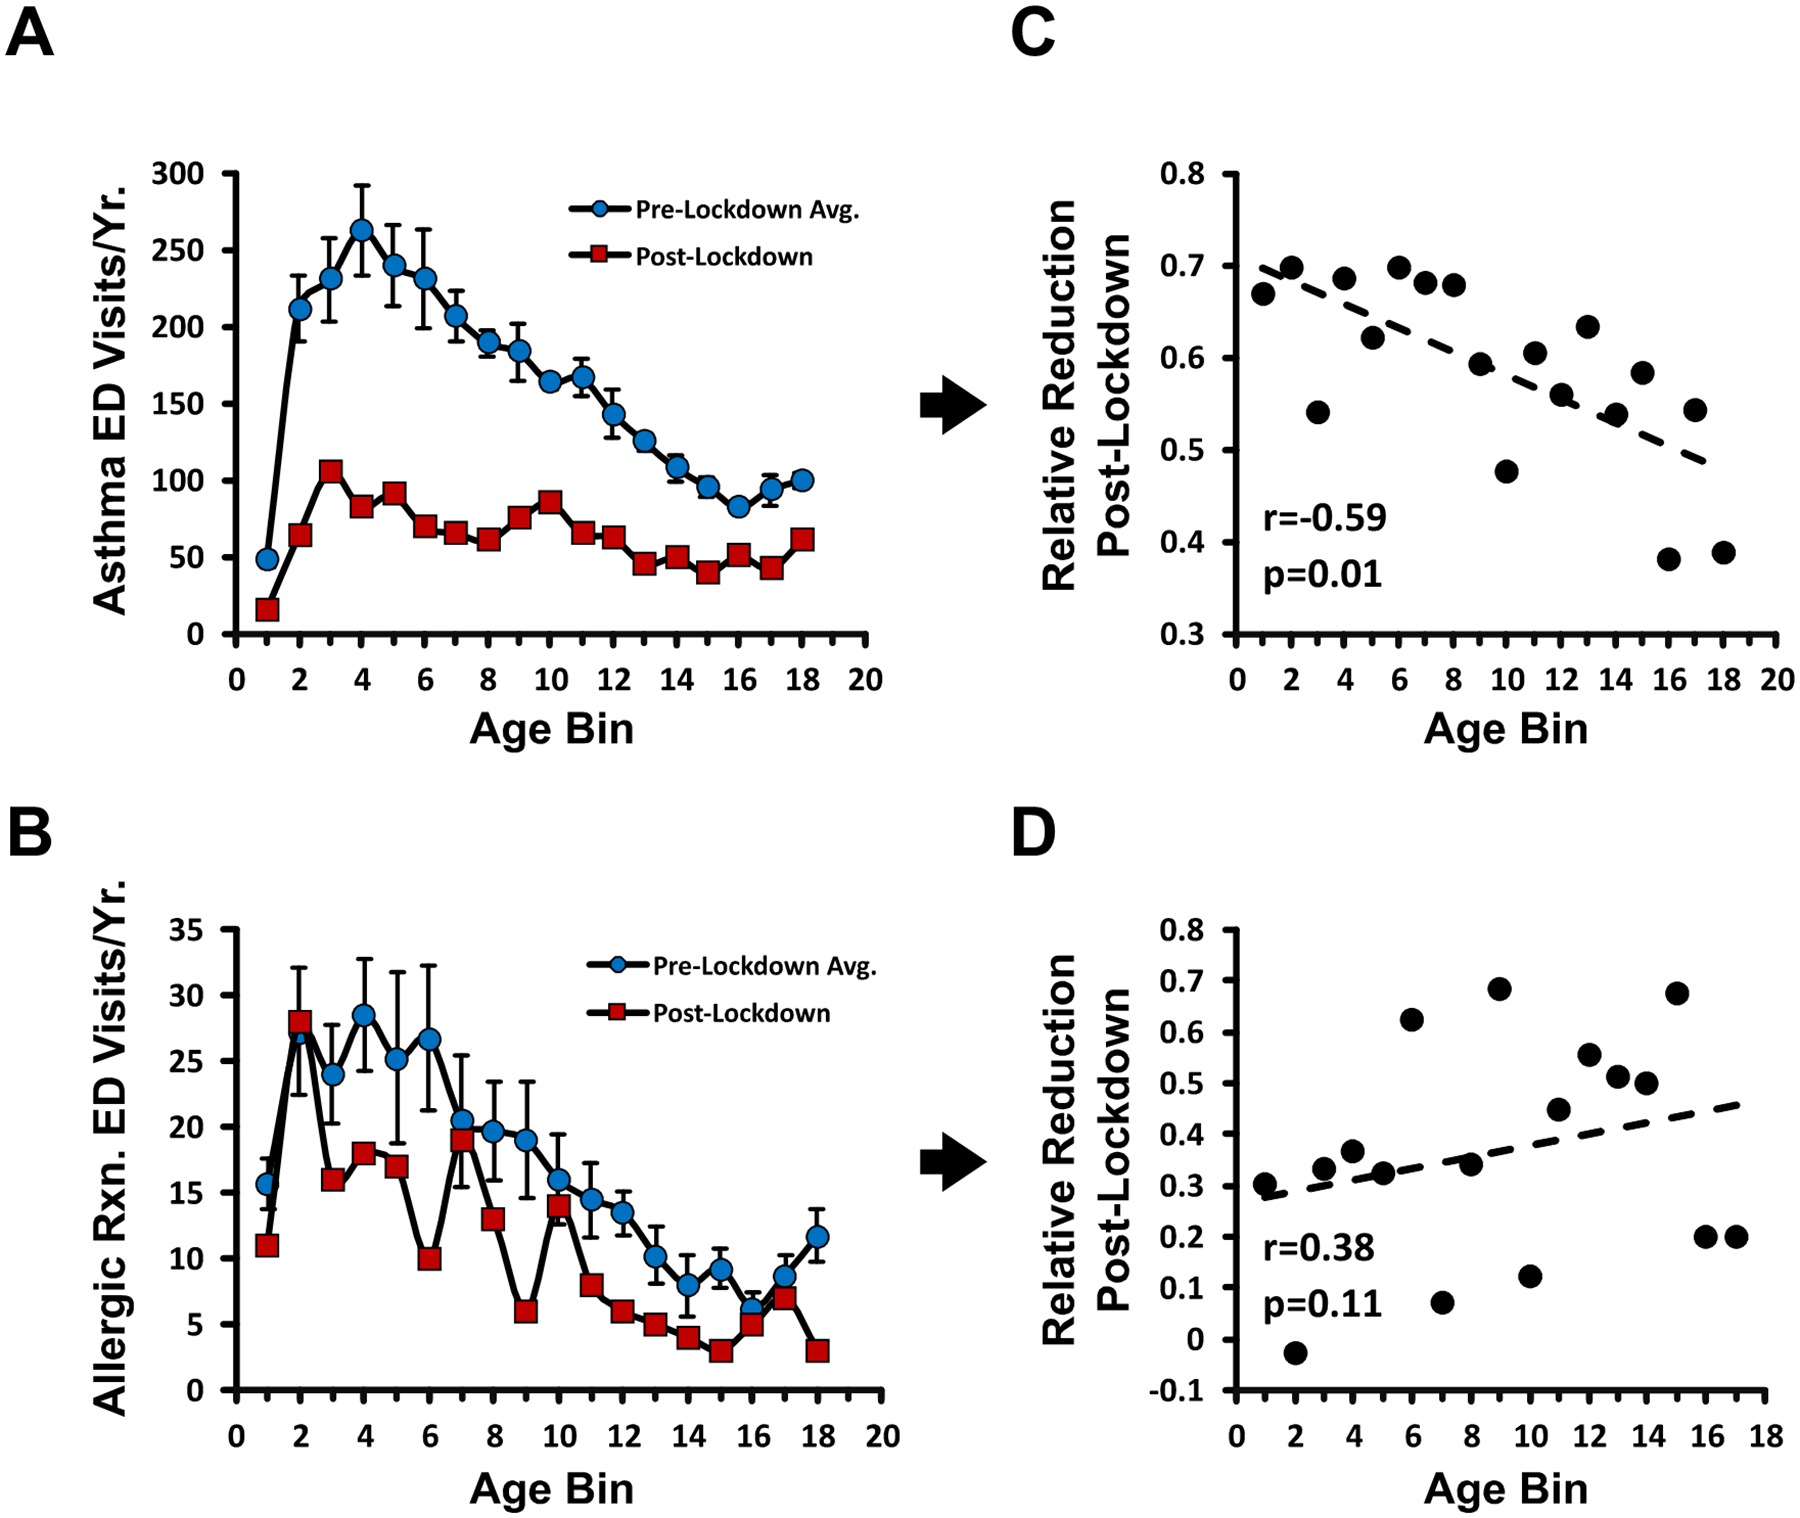
(A, B). Histograms depicting ED visits for asthma (A) and allergic reactions (B) binned by patient age. Each age bin represents a 1 year interval (e.g. 2=ages 1–2 years). Blue circles, pre-COVID lockdown data from 2016–2020 (mean ± SE). Red squares, data covering the first 12 months post-lockdown. (C,D) Relative reduction in ED visits for Asthma (C) or allergic reaction (D) in the year post-COVID lockdown vs. the 4 year average pre-lockdown. Best fit linear regression line, Pearson’s r and p values are depicted.
Virus-triggered asthmatic traits are age-sensitive.
To investigate directly how age impacts lung pathology relevant to asthma exacerbations, we infected mice across a span of ages with Sendai virus (SeV; Fig. 2A). SeV is a parainfluenza virus used extensively in young rodents for modeling post-infectious lung remodeling relevant to asthma, including chronic mucous cell metaplasia, type 2 inflammation, and airway hyper-responsiveness (13, 39–47). A key advantage of SeV for our study is that the lung pathology produced by this virus persists long-term as opposed to other agents (44). While Juvenile (6 weeks-old) mice infected with SeV developed the expected chronic airway inflammation and mucous cell metaplasia by 49 days post-infection (DPI), these phenotypes were greatly attenuated in older mice (Fig. 2B, C). Across a range of SeV doses, induction of inflammatory mucus as measured by Muc5ac gene expression was significantly lower in mature mice compared to juvenile mice and this age-effect was sex-independent (Figs. 2D, I). Mature age also suppressed the induction of multiple type 2 inflammatory signatures by SeV including IL-13, IL-33, and M2 macrophage gene expression, factors all previously identified as critical for post-viral pathology in juveniles (40) (Fig. 2F). To map an age window for post-viral lung pathology we infected mice spanning from 4 weeks to 16 months old with SeV. At 4 weeks old, mouse lungs are in the alveolarization stage of development, which in humans occurs primarily between 2–8 years of age, while a 16 months-old mouse is akin to late middle age in humans (48–50). Post-viral induction of Muc5ac diminished in mice older than 3 months, an age threshold analogous to early adulthood in humans (49) (Fig. 2G). Mature mice also failed to develop airway hyper-responsiveness to methacholine by SeV 49 DPI as normally seen in juveniles (Fig. 2H). To test the generalizability of these findings, we infected mice with a strain of H1N1 influenza A virus (IAV) previously shown to provoke chronic lung pathology in young mice (Fig. 3A) (14). While IAV infection produced similar levels of acute viral RNA expression in juvenile and mature mice, production of chronic lung pathology occurred selectively in juvenile mice as assessed by histologic severity, airway hyper-responsiveness, and mucous cell metaplasia (Fig. 3B–F).
Figure 2. Asthmatic phenotypes are age-dependent when provoked by virus.
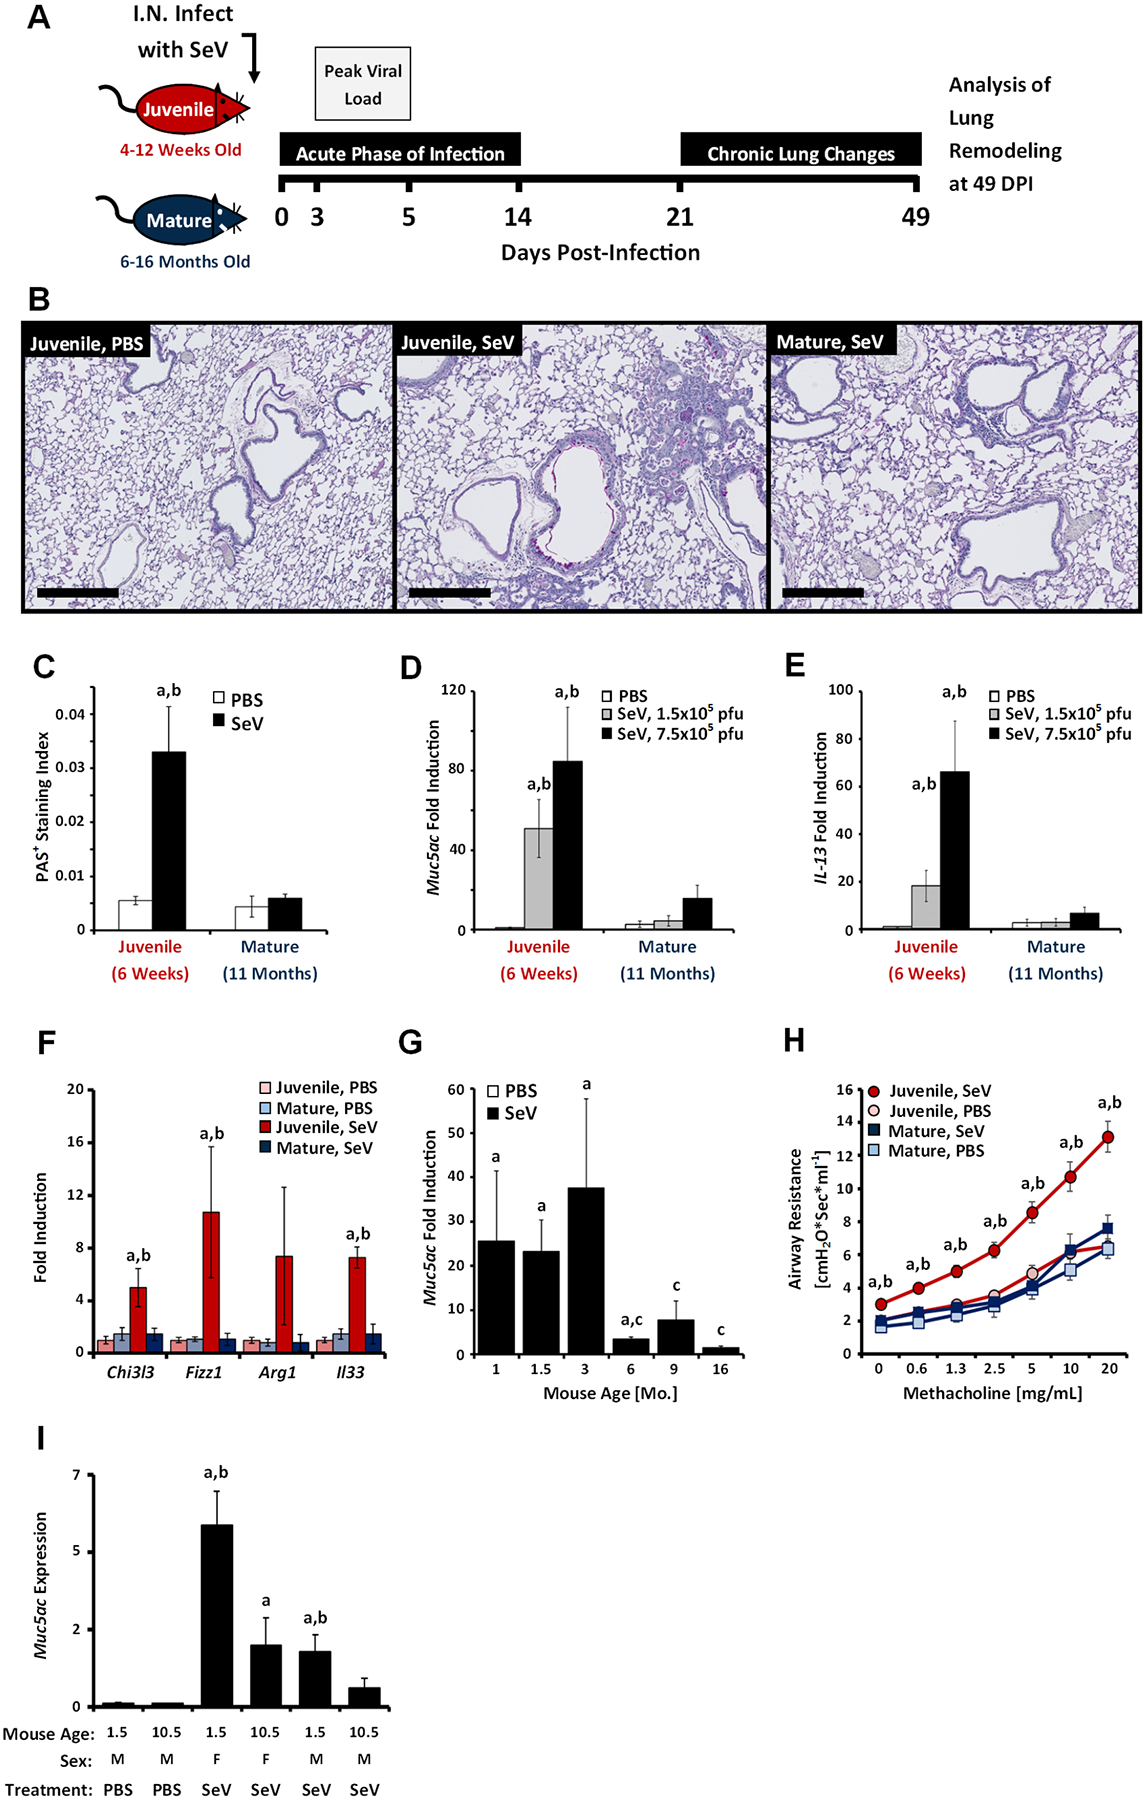
(A) Cartoon depicting the SeV infection model. Time periods denoting acute SeV bronchiolitis, peak lung viral load, and the development of chronic lung pathology are depicted by shaded bars. (B) Representative Periodic Acid Schiff (PAS)-stained lung sections obtained 49 days post-SeV infection (DPI, 1.5 × 10⁵ pfu/mouse) from juvenile mice (6 weeks old) or mature mice (11 months old). Sham-infected juvenile mice are shown as a negative control. (C) Quantification of mucous cell metaplasia via PAS staining (mean ± SE) in PBS-treated mice (n=3) and SeV-infected mice (n=7–11). (D, E) Induction of lung Muc5ac expression (D) and Il-13 expression (E) at 49 DPI as a function of mouse age and SeV dose (mean ± SE). Expression is normalized to PBS-treated mice. White bars, PBS (n=5–6); grey bars, 1.5 × 10⁵ pfu SeV (n=6–9); black bars, 7.5 × 10⁵ pfu SeV (n=5–6). (F) Induction of M2 gene expression and Il-33 at SeV 49 DPI (1.5 × 10⁵ pfu/mouse, n=5–9). Bars represent the mean ± SE normalized to young PBS-treated mice. (G) Induction of Muc5ac expression by SeV (1.5 × 10⁵ pfu) at 49 DPI in mice of various ages (mean ± SE, n=12/group). Data are pooled from 3 independent experiments. (H) Airway resistance as a function of methacholine exposure at SeV 49 DPI (mean ± SE). Red circles, SeV-infected juveniles (n=10); blue squares, SeV-infected mature mice (n=8); pink circles, PBS-treated juvenile mice (n=6); light blue squares, PBS-treated mature mice (n=3). (I) Effect of sex and age on Muc5ac expression (mean ± SE, n=6–9 per group) at SeV 49 DPI (1.5 × 10⁵ pfu/mouse) relative to PBS-treated mice. ap<0.05 SeV-infected vs. PBS-treated; bp<0.05 juvenile vs. mature mice; cp<0.05 vs. 6 weeks old SeV infected mice. Student’s 2-Tailed t-Test performed on log-normalized data.
Figure 3. Chronic lung disease after influenza A virus (IAV) is age-dependent.
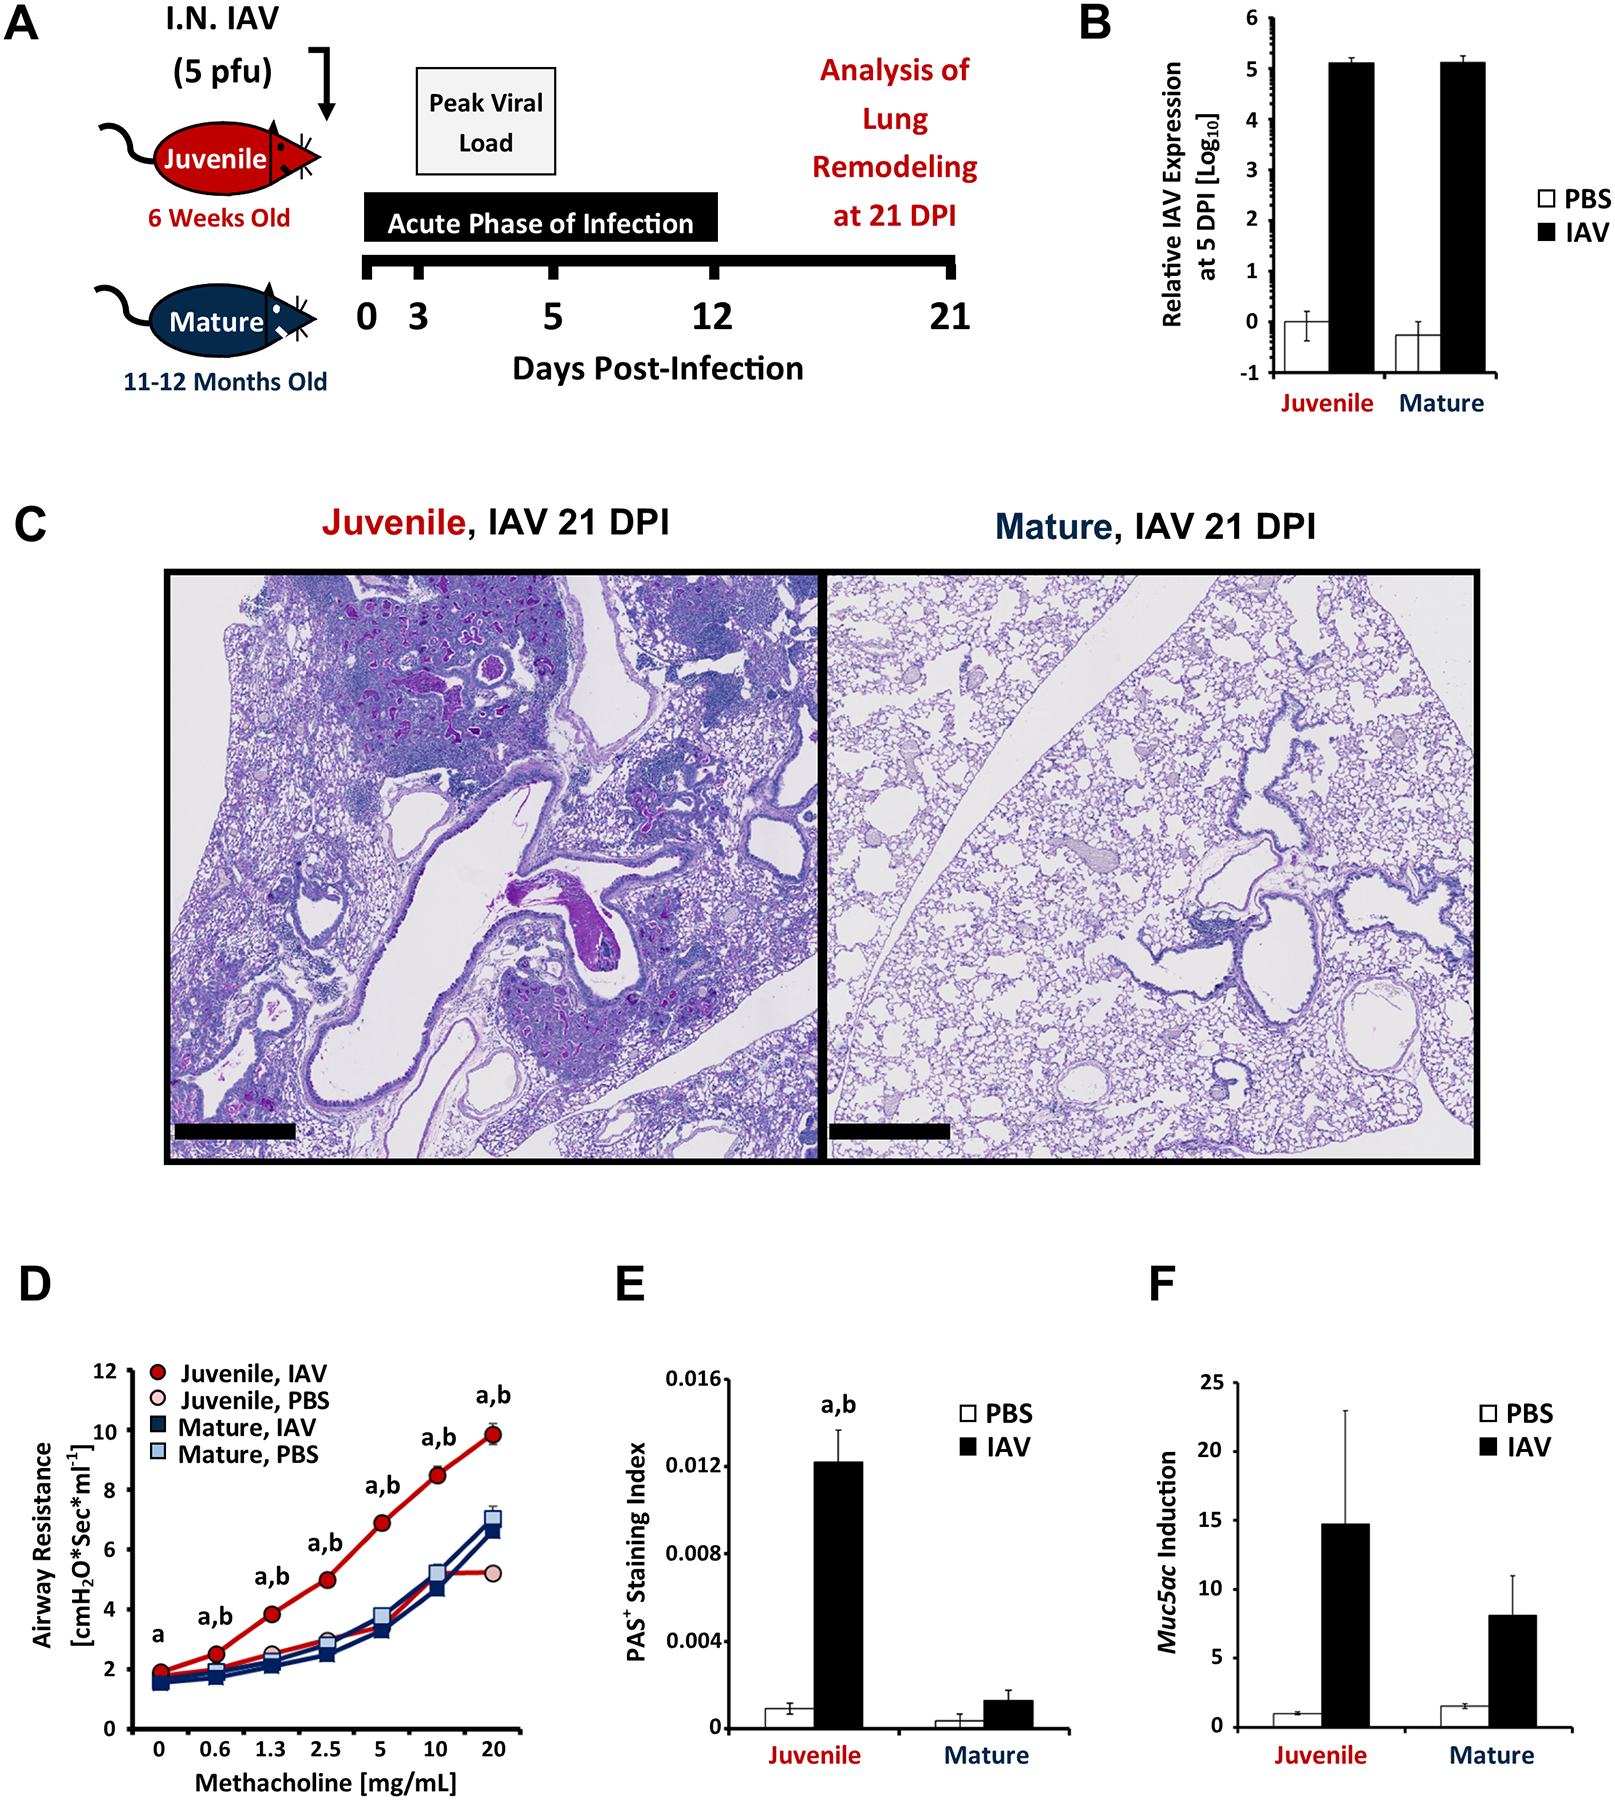
Data were pooled from 2 independent experiments. (A) Cartoon depicting our protocol for producing IAV-induced chronic lung disease. Mice were inoculated with 5 pfu IAV/mouse. Lungs were assessed for chronic pathology at 21 days post-infection (DPI). (B) IAV viral gene expression in whole lung homogenates at 5 DPI (mean ± SE, n=6 per group). Expression is normalized to PBS control lungs. (C) Representative PAS-stained lung sections at 21 DPI. Scale bar=500 μm. (D) Airway resistance as a function of methacholine dose (mean ± SE) of IAV-infected juvenile (red circles, n=12), IAV-infected mature (blue squares, n=13), PBS-treated juvenile (pink circles, n=3), and PBS-treated mature (light blue squares, n=6) mice. (E) Quantification of mucous cell metaplasia at IAV 21 DPI as measured by PAS+ morphometry (mean ± SE, n=4–9). (F) Induction of Muc5ac expression by IAV at 21 DPI in juvenile and mature mice. White bars, PBS (n=6); black bars, IAV treated mice (n=7–19). Expression is normalized to PBS-treated controls. ap<0.05 SeV-infected vs. PBS-treated; bp<0.05 juvenile vs. mature mice, Student’s 2-Tailed t-Test performed on log-normalized data.
Mature C57BL/6J mice differ physically from juveniles in several respects including divergent microbiome composition (51, 52). Since the microbiome can regulate inflammatory responses (15), we examined its role in SeV-induced chronic lung pathology. We added a broad-spectrum antibiotic cocktail (VNAM) to the drinking water of juvenile and mature mice (Fig. 4A). VNAM treatment strongly suppressed stool DNA content and microbial diversity at the time of SeV infection (0 DPI, Fig. 4B, C). While juvenile and mature mice could be differentiated from one another by stool 16S DNA sequencing at baseline, VNAM treatment eliminated clear-cut age differences during and after SeV infection (Fig. 4D). SeV RNA expression was not affected by VNAM during the acute viral illness in either age group (Fig. 4E). At SeV 49 DPI, VNAM treatment also did not alter age-related differences in airway hyper-responsiveness, Muc5ac, IL33, and the M2 marker Trem2 (Fig. 4F, G).
Figure 4. Age-dependent differences in post-viral lung pathology persist in the setting of microbiome suppression.
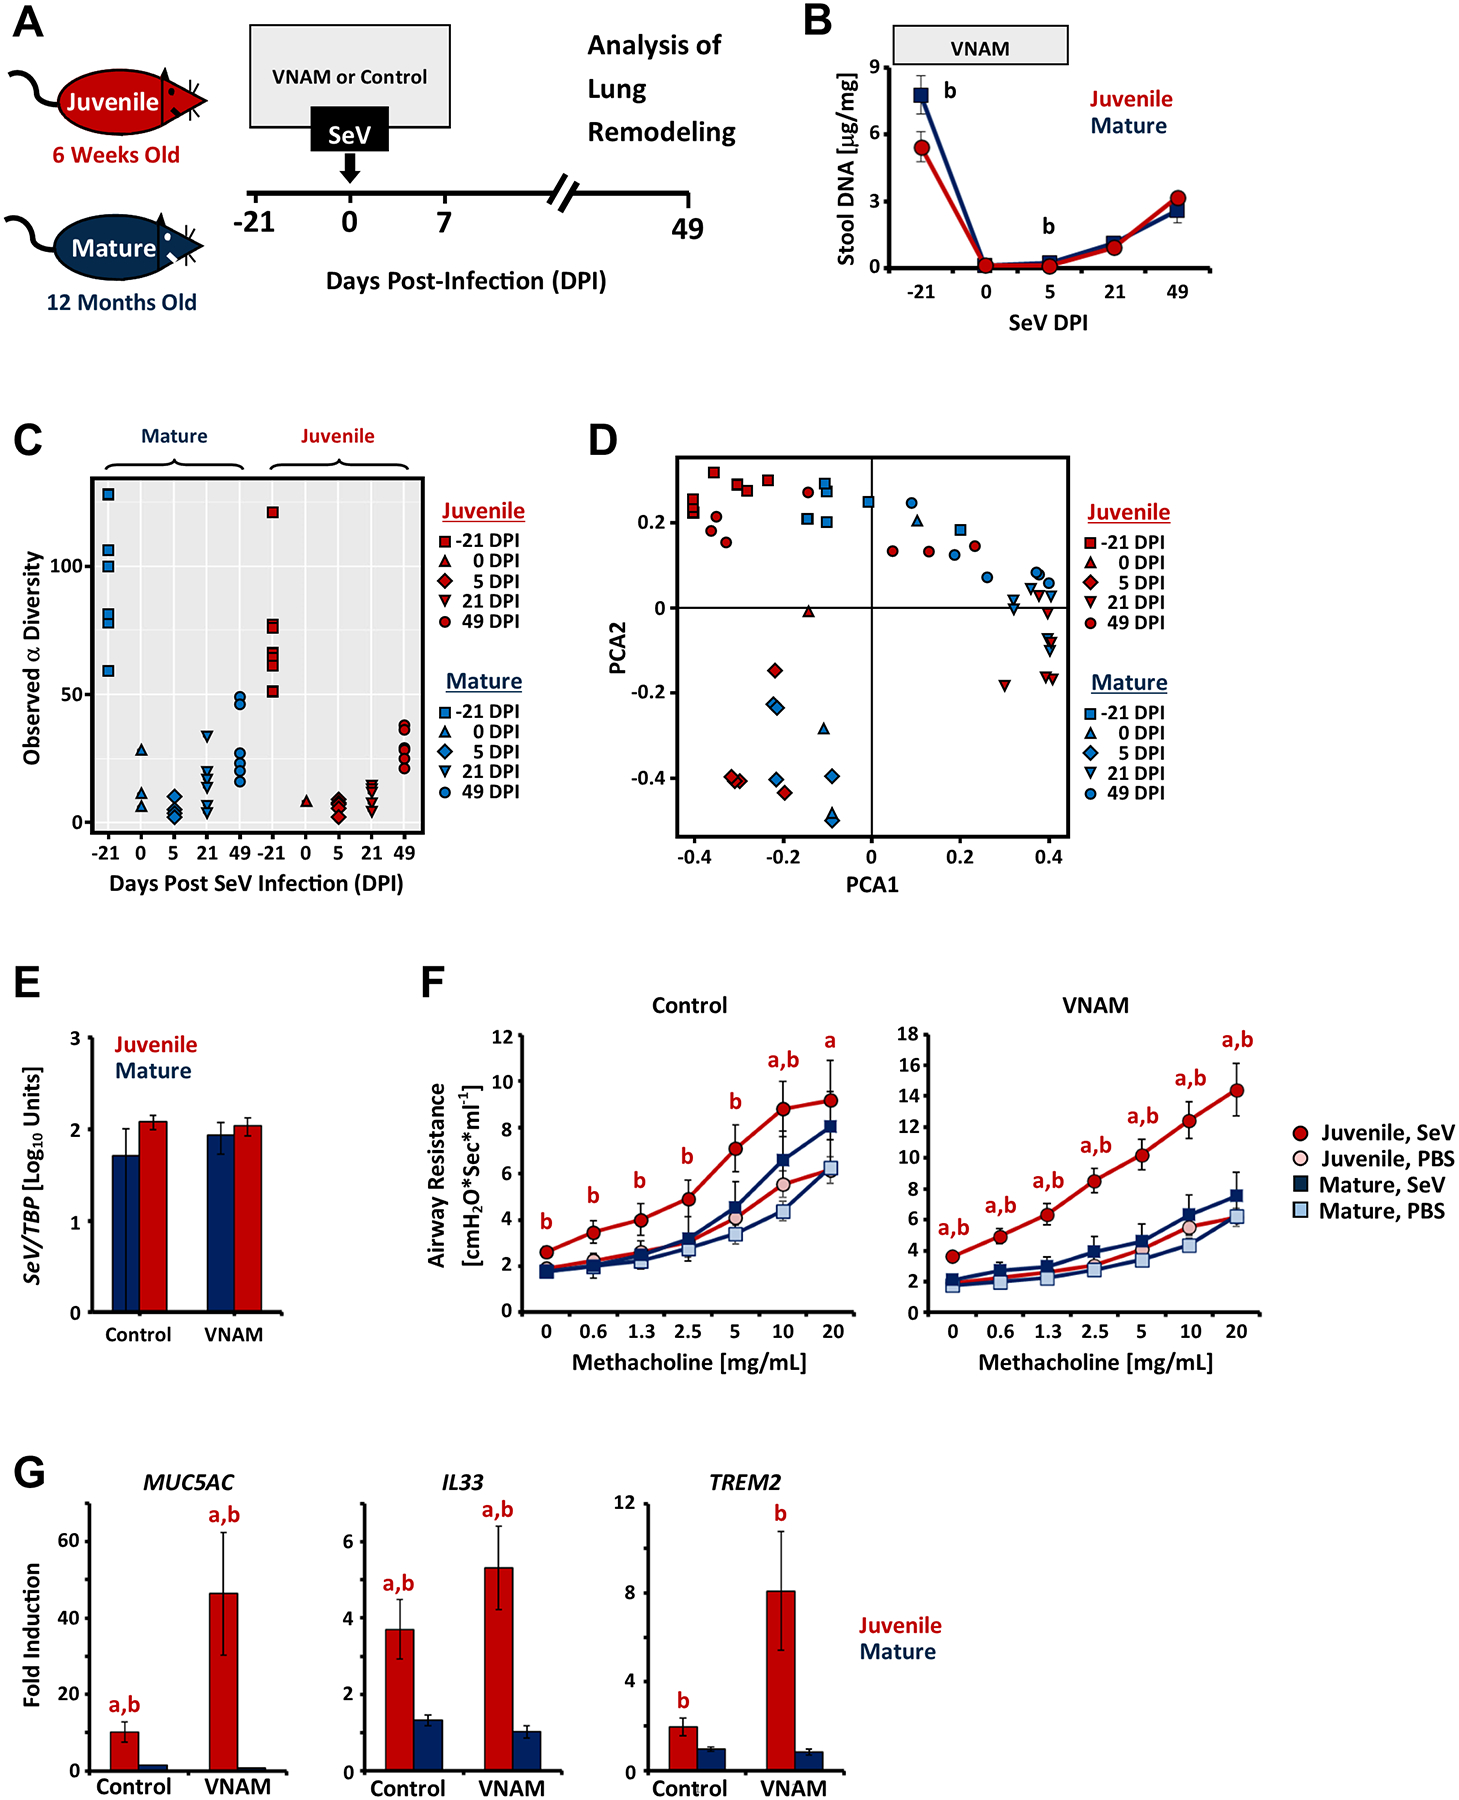
Data are representative of 2 independent experiments. (A) Schematic depicting the experimental approach. Juvenile (6 weeks old) and mature mice (12 months old) were provided drinking water containing a broad spectrum antibiotic cocktail (grape Koolaid™ with vancomycin, neomycin, ampicillin, and metronidazole, or VNAM) or control sweetener (grape Koolaid™) for 3 weeks (starting on −21 DPI) and then challenged with SeV (1.5 × 10⁵ pfu/mouse) or PBS. Treatment with VNAM or control sweetener continued until 7 DPI, and then mice were provided regular water for the duration of the experiments. Lung pathology was examined at 49 DPI. (B) Stool DNA content at various timepoints (mean ± SE, n=6–9). (C) Effect of VNAM treatment on the observed α-diversity of stool samples as determined by 16S sequencing (see Methods). Each datapoint represents a single biological sample. Note, fewer measurements at SeV 0 DPI and 5 DPI were possible due to the paucity of stool DNA content at these time points. (D) Interindividual differences in stool DNA samples over the course of VNAM treatment as determined by PCoA analysis. Each datapoint represents a single biological sample. Note that group differences between juvenile and mature mice are most evident prior to VNAM treatment (−21 DPI). (E) SeV viral RNA expression at 5 DPI (mean ± SE, n=3 per group). (F) Airway response to methacholine at 49 DPI in control (left panel) versus VNAM treated mice (right panel). Datapoints represent means ± SE (n=4–9). (G) Lung expression at SeV 49 DPI of Muc5ac (left panel), Il33 (middle panel), and Trem2 (right panel). Data are expressed as fold induction over age-matched PBS-challenged controls (mean ± SE, n=6–9). ap<0.05 SeV-infected vs. PBS-treated; bp<0.05 juvenile vs. mature mice, Student’s 2-Tailed t-Test performed on log-normalized data.
To summarize, we found that the ability of viral triggers to induce asthmatic traits was robust in juvenile mice but waned with physical maturity. The age sensitivity of virus-induced lung pathology could not be explained by animal adiposity or by gut microbiome composition.
Age-specific responses to SeV arise early after infection.
To identify points of divergence between juvenile and adult mice across the 7-week course of the SeV model, we first examined indices of the initial viral bronchiolitis (Fig. 5). During acute SeV infection weight loss, viral RNA expression, BAL cell count, and cell differential were statistically similar in juvenile and mature mice and followed similar kinetics (Fig. 5A–F). In contrast to the above similarities, airway mechanics measurements at SeV 5 DPI (the peak of acute illness) revealed a greater methacholine sensitivity in juvenile mice than mature mice despite similar levels of viral RNA expression (Fig. 5G). This ventilatory mechanics difference diminished at subsequent time points, and by SeV 12 DPI, airway hyper-responsiveness had normalized in both age groups (Fig. 5H, I). In the context of acute bronchiolitis, we wondered if increased methacholine sensitivity might reflect the distribution of viral infection in small airways. We therefore counted SeV-infected airway cells in acutely infected mice and found that the percentage of SeV+ cells per airway was greater in juvenile mice than mature mice at 5–8 DPI (Fig. 5J, K). To summarize, while general indices of respiratory illness and viral load were similar across age groups, SeV-infected juvenile mice tended to have a wider distribution of virus-infected airway cells, which was associated with transient airway mechanical differences between the age groups. A key insight was that age-specific differences emerged during early SeV infection.
Figure 5. Acute differences in SeV bronchiolitis between juvenile and mature mice.
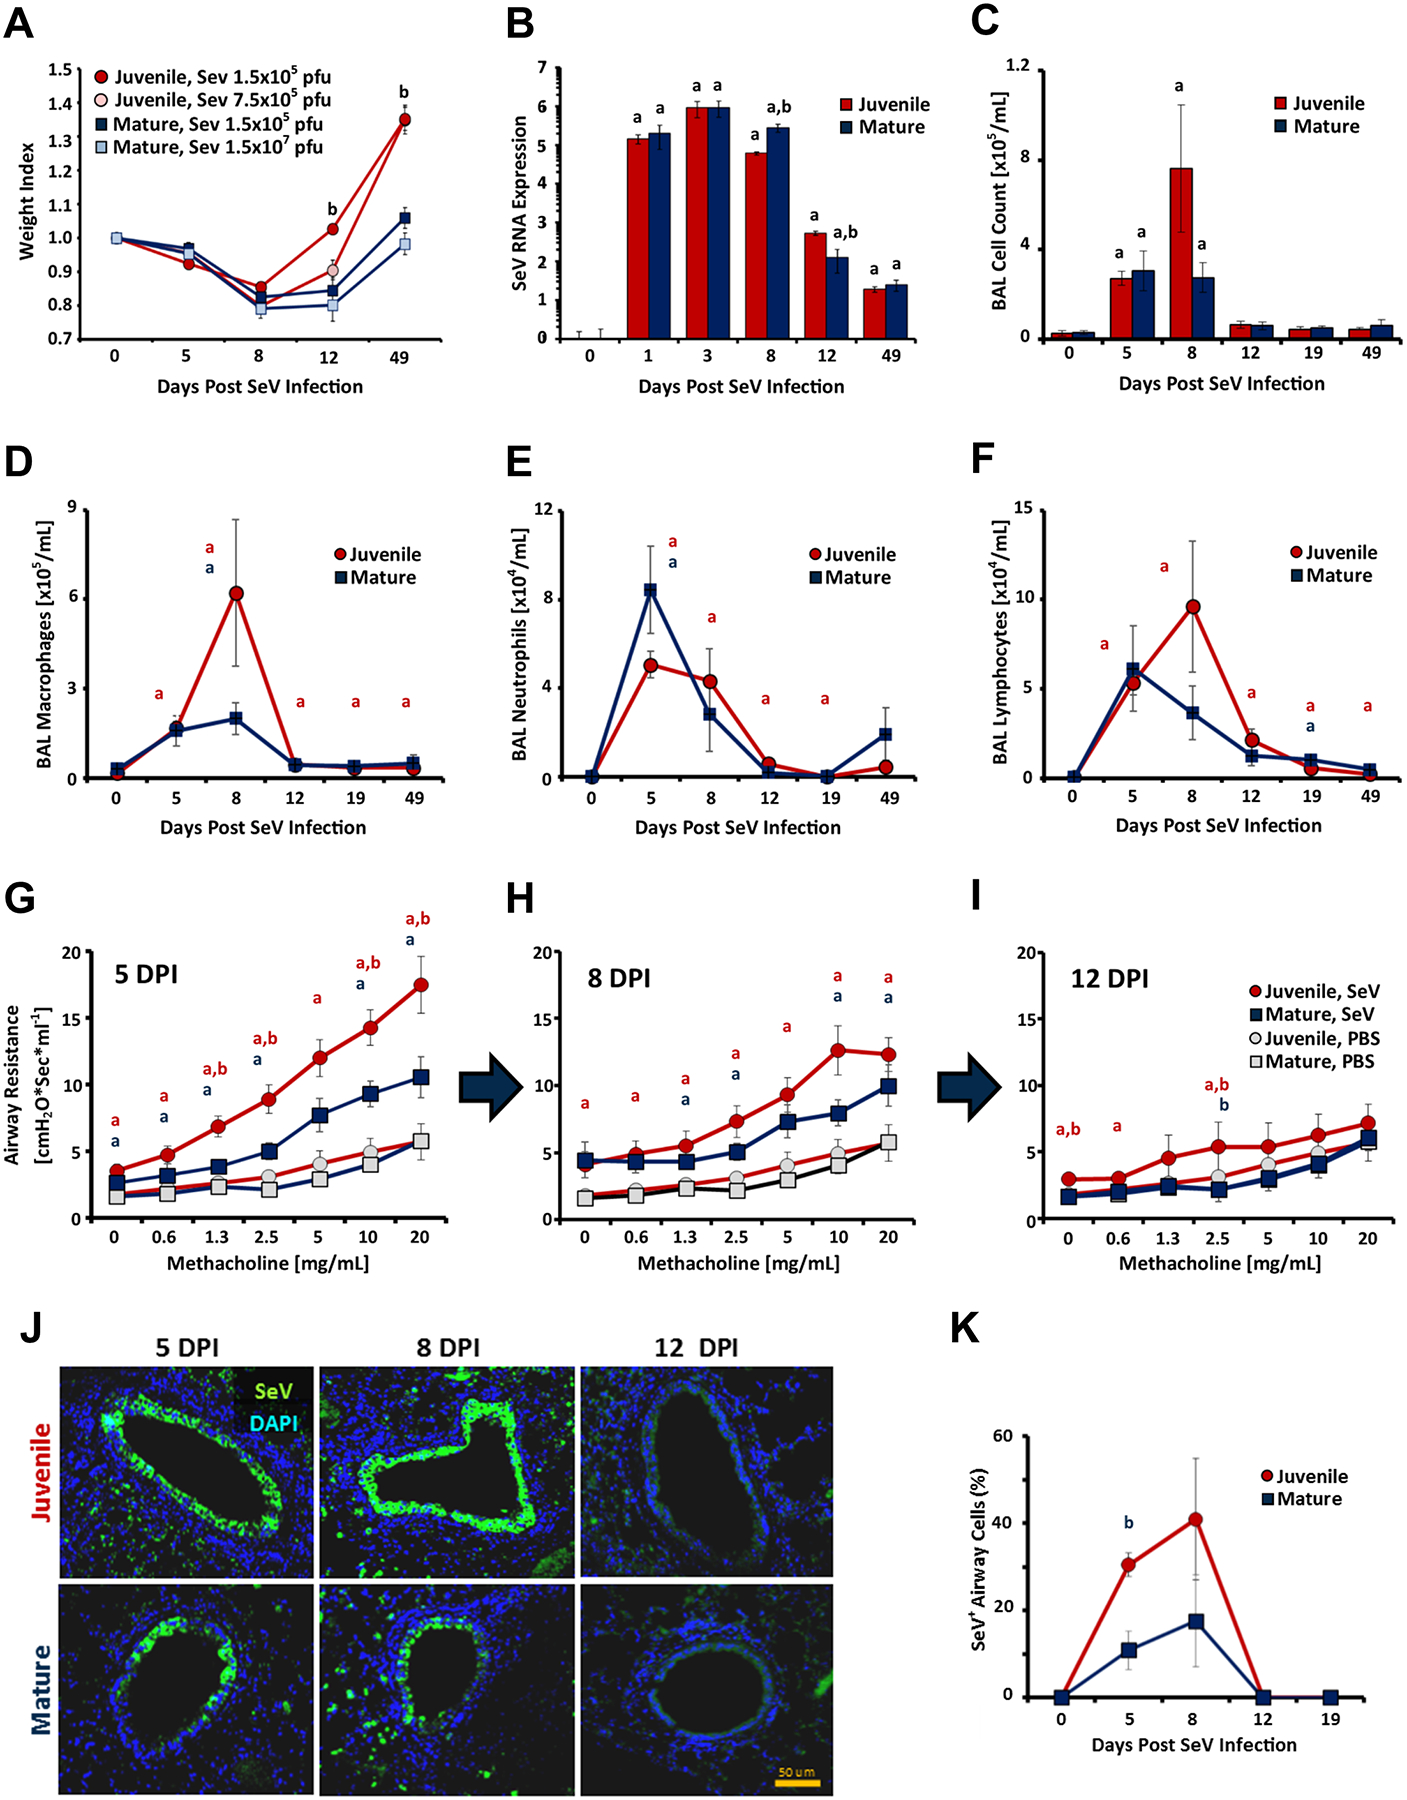
Data points represent means ± SE throughout. (A) Weight loss indexed to starting weight (9–12 mice per group) in juvenile (5 weeks old) and mature (11 months old) mice infected with 1.5×10⁵ or 7.5×10⁵ pfu SeV/mouse. Data are representative of 2 independent dose-response experiments. (B, C) Lung SeV RNA expression (B) and BAL cell counts (C) at various times post-SeV infection (1.5×10⁵ pfu/mouse) in juvenile mice (5–6 weeks old, n=4–8) and mature mice (10–12 months old, n=4–7 per group). Data was pooled from 2 independent time course experiments. (D–F) BAL differential cell count for macrophages (D), neutrophils (E), and lymphocytes (F) at various times post-SeV infection. (G-I) Airway resistance as a function of methacholine exposure at 5 days ((G), n=5–13 per group), 8 days ((H), n=5–13 per group), and 12 days ((I), n=3–13 per group) post-SeV infection (1.5×10⁵ pfu/mouse). Data were pooled from 2 independent time-course experiments. (J) Representative immunofluorescence staining of juvenile (5 weeks old) and mature (10 months old) mouse lungs at various times post-SeV infection (1.5×10⁵ pfu/mouse). Green stain, SeV; blue stain, DAPI. Scale bar= 50 μm. (K) Quantification of SeV+ airway cell frequency (n=15 microscopic fields and 3–4 biological replicates per group). ap<0.05 SeV-infected vs. PBS-treated; bp<0.05 juvenile vs. mature mice, Student’s 2-Tailed t-Test performed on log-normalized data.
Age-selective cytokine responses to SeV.
To investigate age-specific inflammatory patterns in response to SeV, we profiled BAL cytokines in juvenile and mature mice at various time points after infection (Fig. 6). We also correlated BAL cytokines to invasively measured airway mechanics at SeV 49 DPI. Viewed as a heat map, SeV promoted a generally biphasic pattern of cytokine expression with a major peak occurring during the acute viral illness and a lesser peak associated with lung remodeling at 49 DPI (Fig. 6A). Principal component analysis (PCA) resolved the cytokine profiles into 3 loose clusters (Fig. 6B). Cluster I was enriched for cytokines differentially expressed in juvenile mice at SeV 49 DPI (red lettering), cluster II was enriched for cytokines preferentially expressed in mature mice at the same timepoint (blue lettering), and in cluster III juvenile-overexpressing and mature-overexpressing cytokines were equally represented (Fig. 6B). Of the 21 BAL cytokines exhibiting age-dependent expression at SeV 49 DPI, 17 of these (underlined symbols) significantly correlated with airway resistance (RI), a measure of obstructive airway disease (p<0.05, see Methods and Fig. 6B). Strikingly, cytokines overexpressed in juvenile mice at 49 DPI positively correlated with RI, while cytokines overexpressed in mature mice negatively correlated with RI (Fig. 6C). Thus, age promoted specific patterns of lung cytokines after SeV infection that strictly reflected outcomes in terms of airway physiology. We noted that in many cases the age-specific cytokine expression seen at SeV 49 DPI was preceded by a similar trend during the acute phase of infection (Figs. 6D–H). Also of note, juvenile-specific cytokine expression at SeV 49 DPI was significantly enriched for type 2 cytokines (3.2-fold enrichment, p=0.027 Fischer’s Exact Test), including IL-4, −5, and −13 (Fig. 6B, G, and H). As with airway mechanics (Fig. 5G), age-specific type 2 cytokine responses emerged early, if transiently, during acute SeV respiratory illness.
Figure 6: Age-selective cytokine responses to SeV.
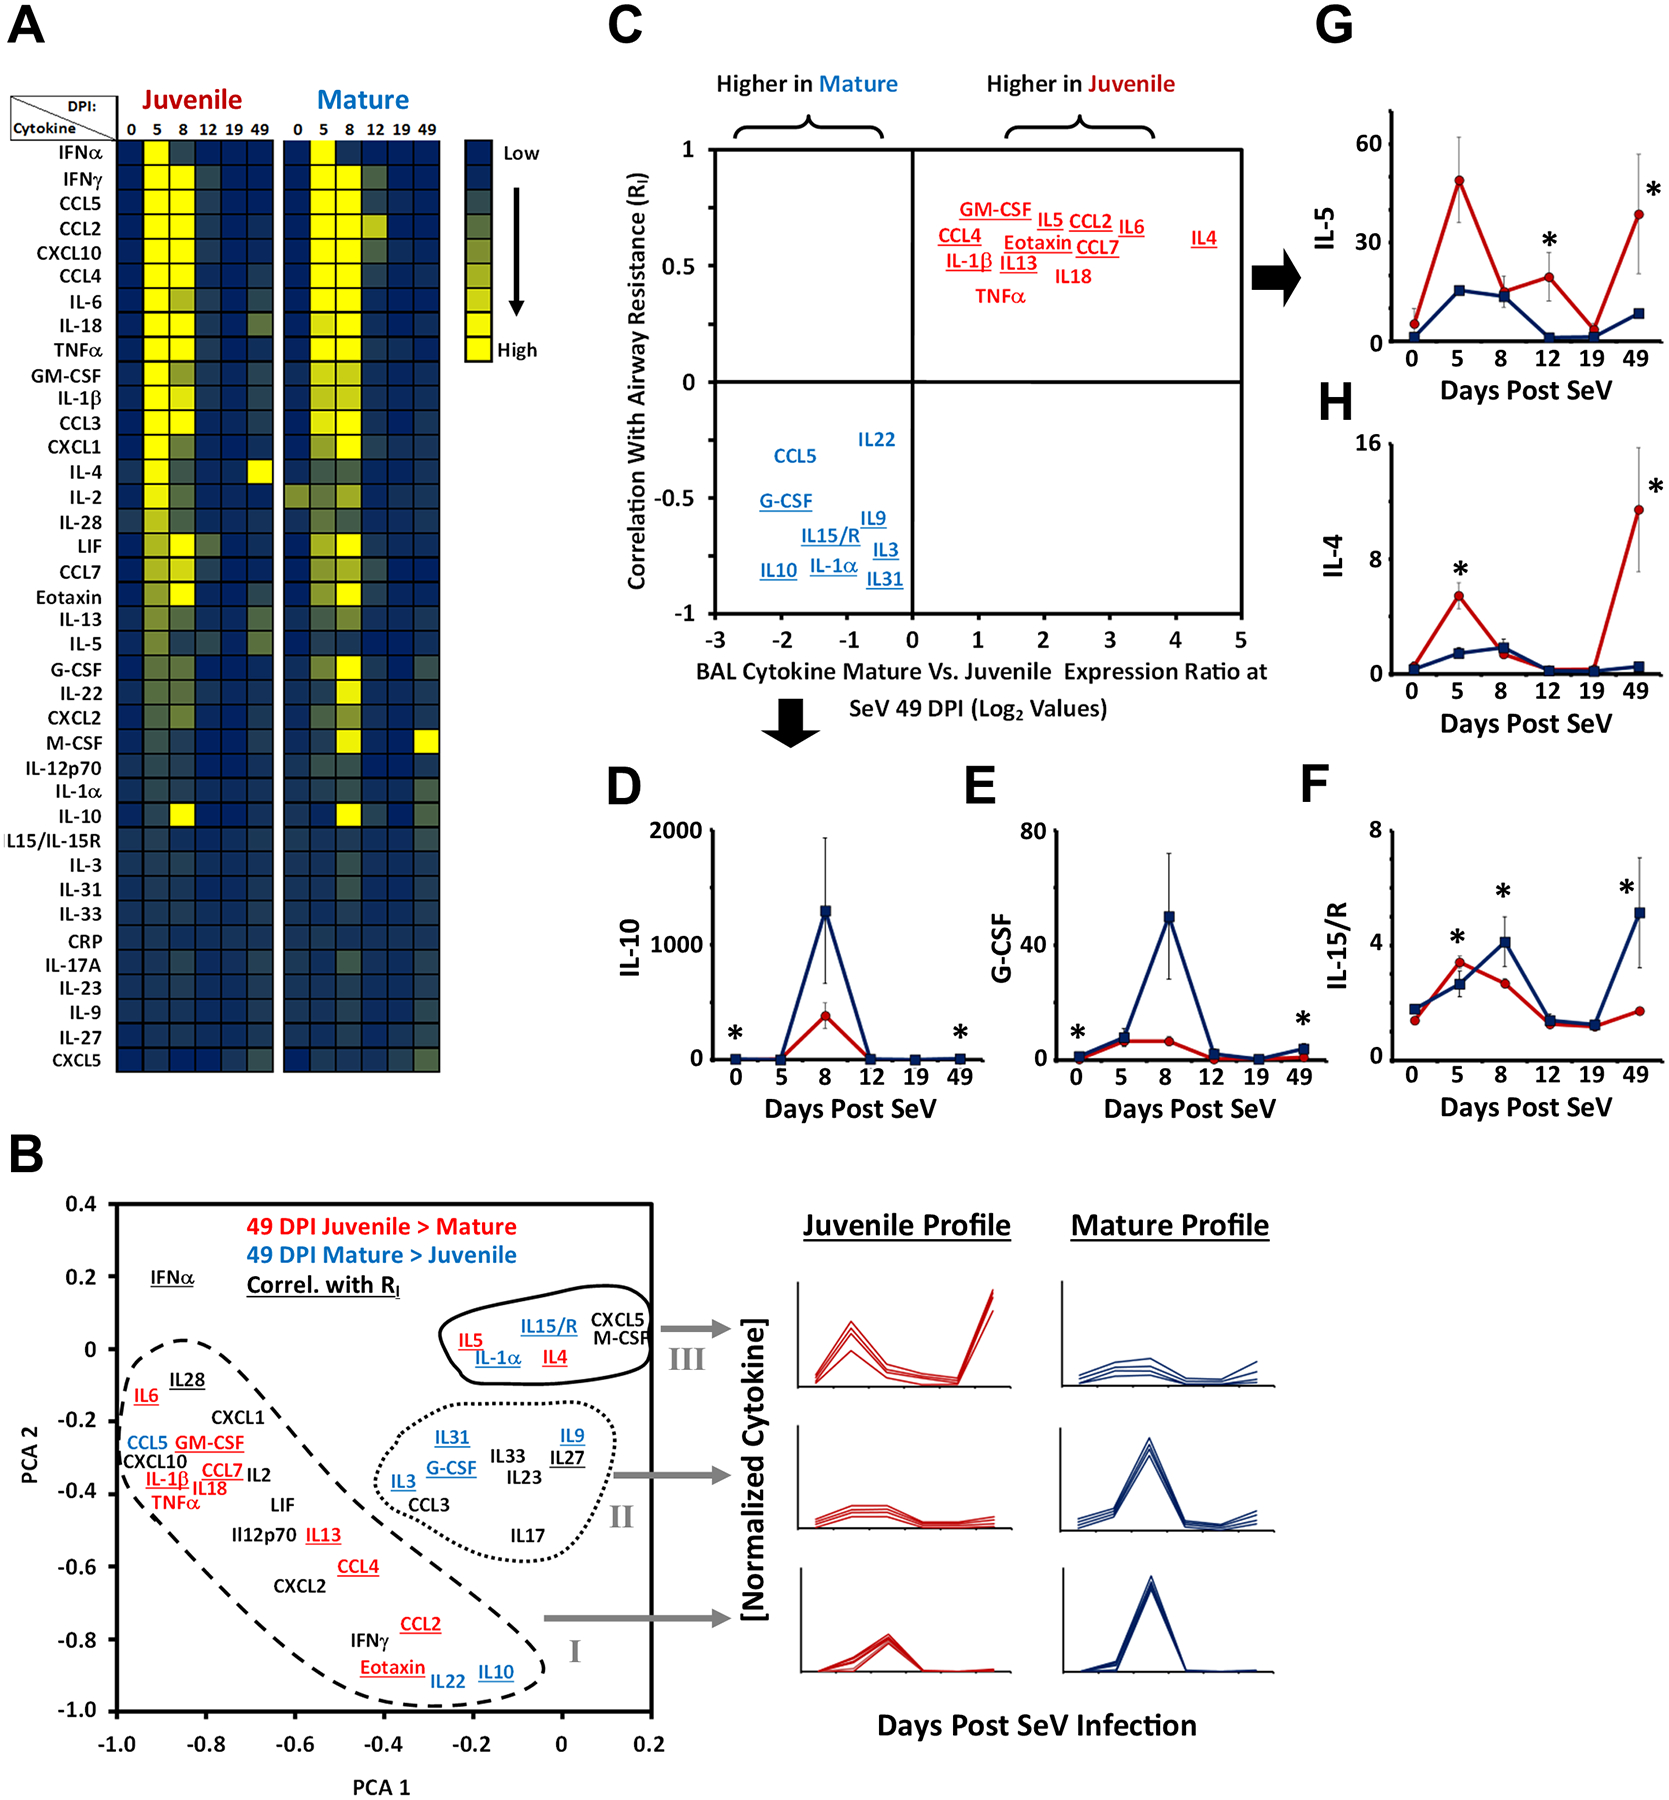
(A) Heat map of BAL cytokine abundance as a function of time after SeV infection (1.5×10⁵ pfu/mouse) and mouse age at the time of infection (juvenile, 5 weeks old; mature, 11 months old). Dark blue represents lowest median normalized cytokine concentrations, yellow represents highest concentration (n=4–12 per cell). (B) Principle component analysis of BAL cytokine profiles (n=71). Red and blue font depict significant differential expression at SeV 49 DPI favoring juvenile (red) or mature mice (blue). Underlining depicts cytokine profiles that correlate with airway resistance at 49 DPI (p<0.05, n=17). Representative cytokine profiles for each of the 3 clusters are shown to the right. (C) Magnitude of age-specific differential expression at SeV 49 DPI (mean, n=7–10 per age group) versus correlation to airway resistance in the same animals. For all cytokines depicted there was significant differential expression based on age group (bp<0.05, Student’s 2-Tailed t-Test performed on log-normalized data). Statistically significant correlations are depicted by underlining. D–H. BAL expression post-SeV infection for IL-10 (D), G-CSF (E), IL15/15R (F), IL-4 (G), and IL-5 (H) in juvenile and mature mice. Data points represent the mean ± SE (n=4–12). *p<0.05 juvenile vs. mature mice, Student’s 2-Tailed t-Test performed on log-normalized data.
Allergen-triggered airway inflammation is less age-sensitive than that of viruses.
Type 2 inflammation is a trait common to virus and allergen-triggered asthma exacerbations. Therefore we asked to what extent age impacts airway pathology induced by Alternaria alternata, a common aeroallergen in severe asthma (Fig. 7A) (53). Unlike viral infection, Alternaria extract induced extensive peri-bronchial airway inflammation, mucous cell metaplasia, and Muc5ac expression in both juvenile and mature mice (Fig. 7B–D). Additionally, gene expression of the Type 2 cytokines IL-33, IL-5, and IL-13 were statistically similar in juvenile and mature mice (Fig. 7C). On the other hand, Alternaria induced less eosinophil infiltration, lung consolidation, and airway hyper-responsiveness in adults compared to juveniles, although adults did develop pathology (Fig. 7E–G). We concluded that age affected allergic triggers of asthmatic pathology differently than viral triggers: whereas post-viral pathology was categorically selective for the juvenile age bracket, allergic triggers were age sensitive in only a subset of Type 2 inflammatory markers and could dependably induce asthmatic traits across age groups. Such a difference is clinically plausible since asthmatic children with coincident atopy are much less likely to go into clinical remission as they mature (54, 55).
Figure 7. Induction of asthmatic phenotypes by Alternaria exposure is similar in juvenile and mature mice.
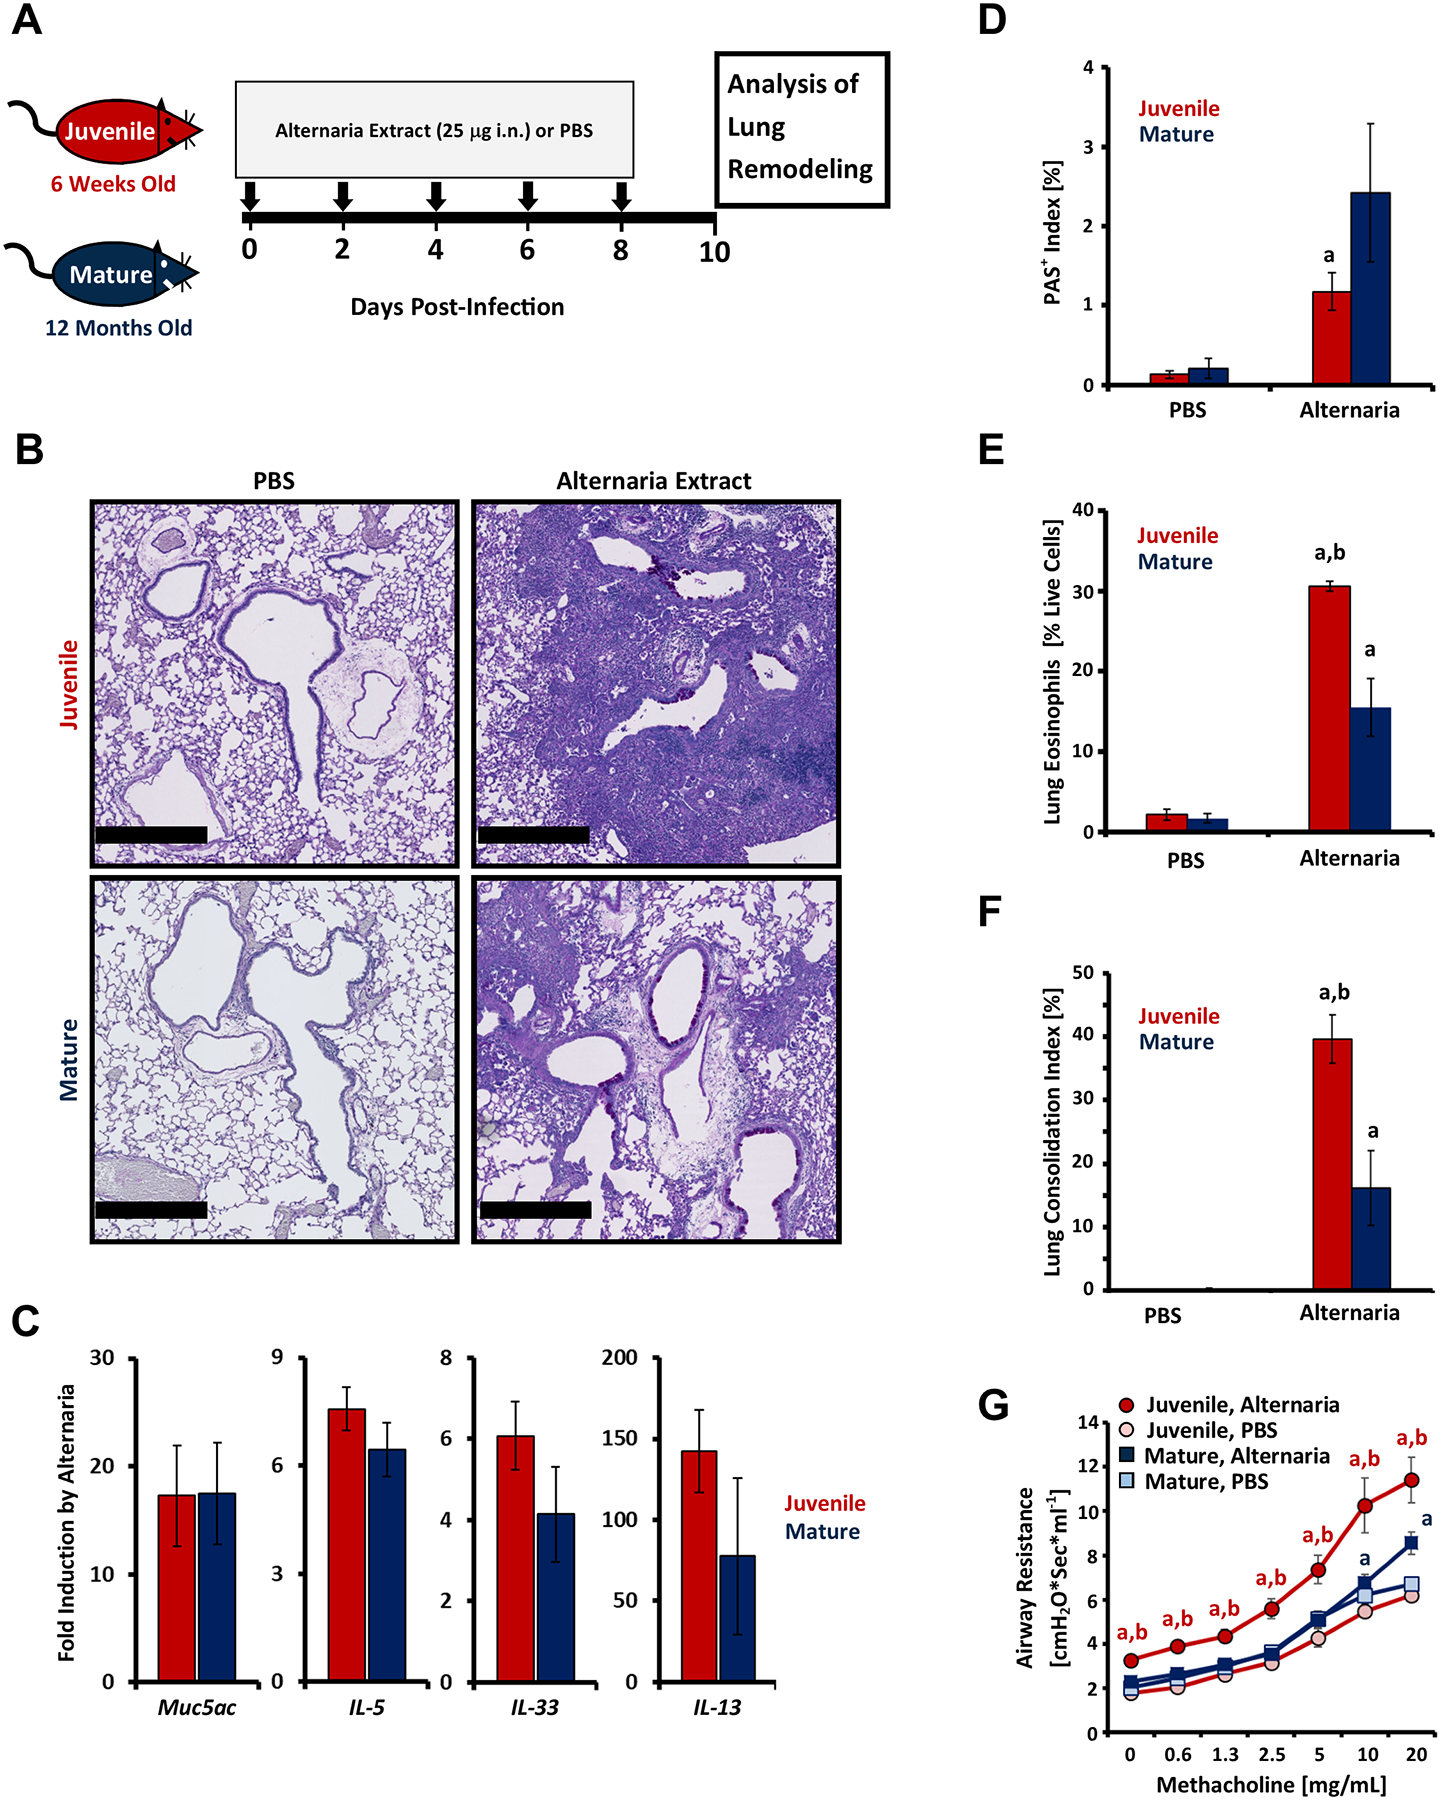
Data are pooled from 3 independent experiments comparing juvenile (6 weeks old) mice to mature (12 months old) mice. (A) Protocol for inducing chronic lung disease by serial intranasal (i.n.) instillation of Alternaria extract (see Methods). (B) Representative PAS-stained lung sections 10 days after serial Alternaria exposure. Scale bar=500 μm. (C) Induction of lung Muc5ac, IL5, IL33, and IL13 expression by Alternaria treatment in juvenile mice (n=13) and mature mice (n=14). Data are expressed as fold induction over control (PBS-treated) mice. (D). Morphometric quantification of mucous cell metaplasia via airway PAS staining (mean ± SE) in juvenile mice (n=4–7) and mature mice (n=4–7). (E) Lung eosinophil (CD11b+, SiglecF+,CD11c−) frequency (mean ± SE) in PBS treated (n=3) and Alternaria treated mice (n=7–8 per group). (F). Morphometric quantification of airspace consolidation (mean ± SE) in juvenile mice (n=4–7) and mature mice (n=4–7). ap<0.05 SeV-infected vs. PBS-treated; bp<0.05 juvenile vs. mature mice, Student’s 2-Tailed t-Test performed on log-normalized data. (G) Airway resistance as a function of methacholine exposure after Alternaria or PBS treatment. Each data point represents the mean ± SE of Alternaria-treated juveniles (n=10), Alternaria-treated mature mice (n=8), PBS-treated juvenile mice (n=7), and PBS-treated mature mice (n=9).
Lung leukocyte composition changes with age.
To clarify immunological differences between juvenile and mature mice, we used mass cytometry to examine whole lung leukocyte composition in the presence or absence of SeV infection (Figs. 8 and Supplemental Fig. 1). Principal component analysis revealed that juvenile and mature lungs were most divergent in terms of their leukocyte composition prior to SeV infection (0 DPI, Fig. 8A). At 0 DPI, mature mouse lungs exhibited greater frequencies of PD-1+ and CD44+ T-cells compared to juvenile lungs (Supplemental Fig. 1A, B). Leukocyte infiltration kinetics into SeV-infected lungs could be grouped into three general patterns: a “U” or “S”-shaped pattern of infiltration (cluster I), a peak at SeV 5 DPI (cluster II), or a peak at 12 DPI (cluster III) (Fig. 8B). While these trafficking patterns were similar across age groups, the overall prevalence of specific cell types differed with age (Figs. 8C and Supplemental Fig. 1C–J). B-cells and neutrophils were more prevalent in mature mice over discrete intervals during SeV infection, while eosinophils accumulated progressively only in juvenile mice (Fig. 8D–F). Alveolar macrophages (AMs) stood out among the major cell types in exhibiting age differences both at baseline and at SeV 49 DPI (Fig. 8G). We therefore analyzed AMs in further detail.
Figure 8. Mass cytometry identifies age-specific leukocyte responses to SeV.
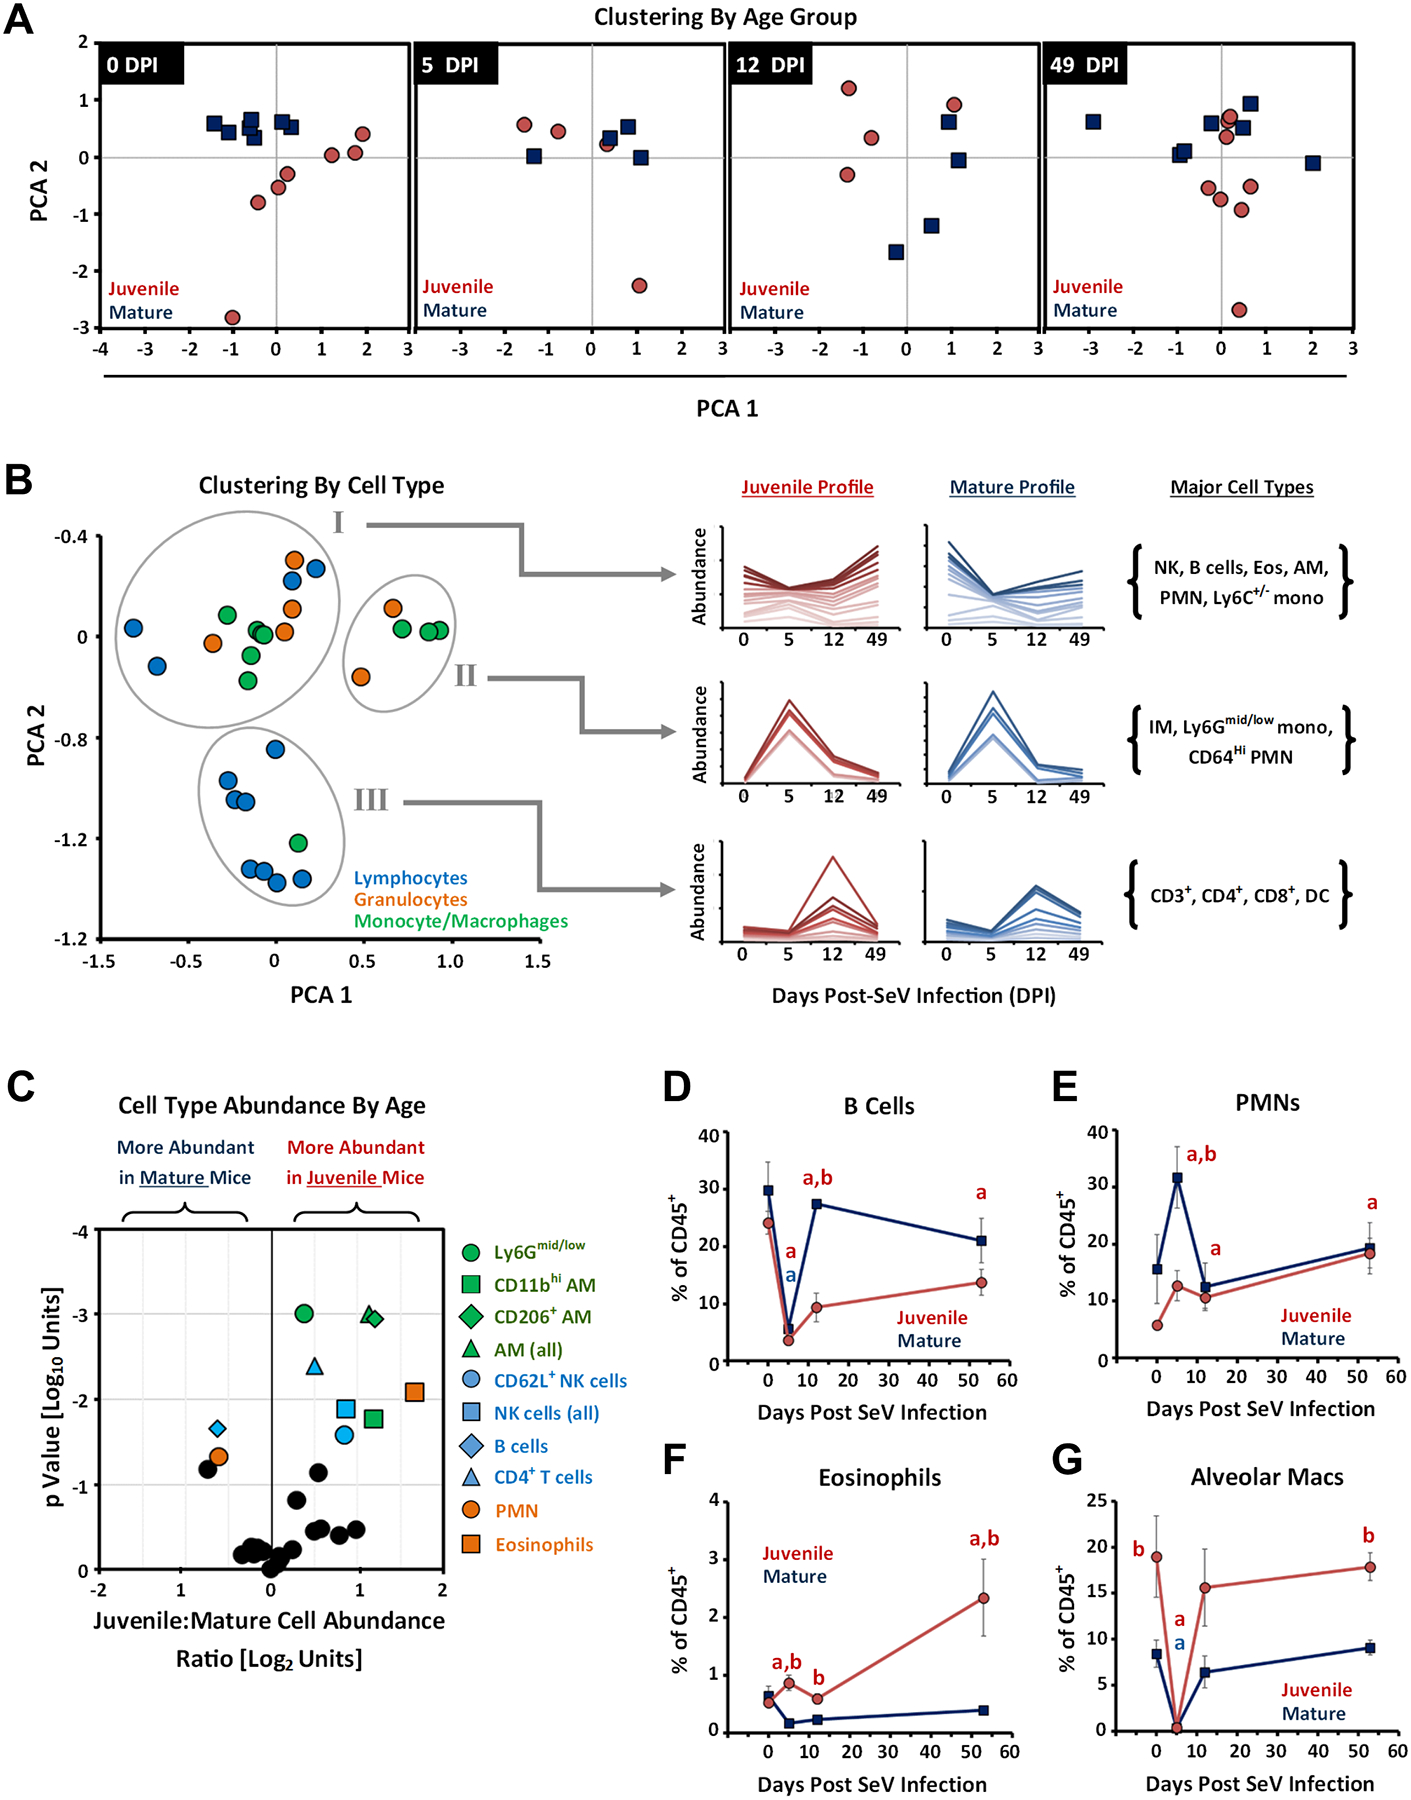
Data are representative of 2 independent mass cytometry analyses. (A) Principal Component Analysis (PCA) of lung leukocyte burden in juvenile (5 weeks old) and mature mice (11 months old) at various times after SeV infection (1.5×10⁵ pfu/mouse). Each symbol represents data from an individual mouse. (B) PCA clustering of leukocyte dynamics after SeV infection. Each data point represents an individual cell type. Co-clustering cell types are circumscribed by ovals. Stacked line graphs depicting the normalized cell frequencies as a percent of CD45+ cells in each of the 3 identified clusters is shown in the center of the panel. Examples of key cell types comprising the clusters are listed to the right. (C) Volcano plot depicting relative overall abundance of specific cell types in juvenile versus mature mice, combining all time points pre- and post-SeV infection. Cell types with statistically significant differences (p<0.05, Student’s 2-Tailed t-Test of log-normalized data) are depicted with colored symbols. Cell types that did not achieve statistical significance are depicted by black symbols. (D–G) Lung burden of B-cells (D), Polymorphonuclear Leukocytes (PMNs, (E)), Eosinophils (F), and Alveolar Macrophages (G) at various points after SeV infection. Data points represent the mean ± SE (n=4–7). ap<0.05 SeV-infected vs. PBS-treated; bp<0.05 juvenile vs. mature mice, Student’s 2-Tailed t-Test performed on log-normalized data. For additional cell types see Supplemental Fig. 1. Representative gates are shown in Supplemental Fig. 3A.
Extensive transcriptional reprogramming of AMs with aging.
Using visualization of t-distributed stochastic neighbor embedding (viSNE) analysis of mass cytometry data (56), we noticed that AMs from juvenile and mature mice congregated in distinct clusters that were strongly influenced by differential surface expression of MHC-II protein, both at baseline and at SeV 49 DPI (Figs. 9A,B). In the literature, mouse AMs are described as expressing low levels of MHC-II in the basal state (57), but this was based on observations from juvenile animals. We found that AMs developed MHC-IIHi status progressively with age achieving >60% prevalence by 7 months old in the absence of infection or other clear activating stimulus (Fig. 9C). Analysis of permeabilized cells by mass cytometry indicated that MHC-II upregulation was a selective feature of AM aging, although some upregulation in interstitial macrophages (IMs) was noted as well (Fig. 9D). Previous studies suggest that adenoviral infection can induce MHC-II expression in juvenile AMs (58). While we found that SeV infection can similarly induce MHC-II expression on AMs in juvenile mice, the frequency of MHC-IIhi AMs in juvenile mice were significantly lower than those seen in mature mice, even at baseline (Fig. 9E). Interestingly, MHC-II expression did not correlate with increased antigen processing activity as measured by the DQ-Ova assay (Fig. 9F). This made us wonder if the MHC-II expression we observed reflected a broader reprogramming of AM function with age rather than a re-tasking of these cells for antigen presentation.
To examine the transcriptional landscape of AM aging, we performed bulk RNAseq analysis of BAL samples from naïve mice, which are largely composed of AMs. We observed age-dependent expression of H2-aa and H2-eb1, genes that encode the 1A/1E MHC-II proteins detected by flow cytometry (Fig. 9G). Also upregulated was Ciita, a master regulator of MHC-II gene expression (59) (Fig. 9G). To put these findings in context, 1024 genes (2.5% of identified annotations) demonstrated age-dependent expression in BAL samples from naïve mice using a cutoff of p<0.05, with a slight majority (55%) demonstrating increased expression in the juvenile (<3 months old) compared to the mature (>7 months old) age range (Fig 9H). However, from an informatic perspective, all KEGG pathways found to be enriched in the total set of 1024 genes were entirely driven by the subset whose expression is higher with maturity (Fig. 9I, blue shaded terms). These KEGG terms included “asthma” and multiple pathways connected to antigen presentation, all of which include MHC-II genes in their functional annotation definitions (Fig. 9I). Thus, a major informatic feature of age-associated gene expression in BAL cells is the acquisition of MHC-II gene expression with aging. Finally, we asked whether MHC-II upregulation in AMs was cell-autonomous or was driven by environmental context. Interestingly, in vitro culture of AMs from mature donors led to a rapid downregulation of H2-aa expression, but expression levels were not affected in AMs from juvenile mice (Fig. 9J). Similarly, in vitro culture of AMs downregulated Pla2g2d expression, a gene that exhibited age-dependent expression in our BAL dataset (Fig. 9K). These data suggest that RNA signatures of AM aging are not cell autonomous and may be driven by the local microenvironment.
To further investigate whether MHC-II upregulation with aging was a specific feature of AMs, we performed single cell RNAseq on pooled BAL samples from naïve juvenile (6 weeks old) and mature (12 months old) mice (Fig. 10). UMAP analysis revealed that juvenile and mature mice harbor similar populations of cell types that tightly co-cluster (Fig. 10A). There were subtle differences in the cell differential, with mature BALs containing greater amounts of lymphocytes (Fig. 10B). We noted a higher cellular yield and a higher prevalence of mitotically active (KI-67+) AMs in BALs from juvenile mice compared to mature mice, consistent with prior reports (Fig. 10B) (60). The age-dependent upregulation of H2-aa seen by bulk RNAseq was confirmed by single cell analysis and mapped broadly across the entire AM cluster in mature mice (Fig. 10C). Examining global AM gene expression by scRNAseq revealed a distinct group of genes upregulated in mature compared to juvenile AMs that were predominantly MHC-II pathway genes (Fig. 10D, blue filled symbols). Age-regulated expression of these genes was specific to AMs and was not observed in the other cell types detected in BALs (Fig. 10E, arrow). Thus, scRNAseq confirmed differential MHC-II gene expression to be a prominent and selective informatic feature of AM aging in healthy mice. We should note that a recent report compared single cell gene expression in 4–6 months-old versus 18–24 months-old AMs sorted by flow cytometry but did not observe differences in MHC-II gene expression aside from CD74 (also found in our dataset) (61). However, this analysis left out juvenile mice where the major differences in MHC-II gene expression occur, and employed cells exposed to the stress of tissue dissociation and cell sorting.
We considered the possibility that AMs from mature animals might originate from bone marrow-derived monocytes as opposed to the embryonic yolk sac, and this alternate origin might explain differences in MHC-II expression. However, AMs from healthy mature mice exclusively expressed markers connoting embryonic but not bone marrow origin (Figs. 10F) (23). Altogether, our data demonstrate substantial AM programming with aging in terms of the number of these cells in the lung, global gene expression, antigen processing potential, and MHC-II class gene expression. Importantly, gene expression changes to AMs plateau by 7 months of age, indicating the phenomenon is one of organism maturation rather than senescence or old age.
AM depletion in mature mice restores post-viral airway pathology to juvenile levels.
To examine the significance of mature AMs in post-viral lung pathology we used clodronate liposomes to selectively deplete these cells prior to SeV challenge (23) (Fig. 11A). Intranasal delivery of clodronate liposomes substantially reduced AM abundance and normalized differences in AM number between juvenile and mature mice (Fig. 11B,C). In contrast, control liposomes did not affect age differences in AM number, although they had a slightly depressing effect on AM abundance in both age groups (Fig. 11C). AM depletion in mature mice prior to SeV infection led to a marked increase in post-viral lung disease that approached that of juvenile mice in terms of lung pathology, methacholine responsiveness, and mucous cell metaplasia (Fig. 11D–F). In contrast, AM depletion had only minimal effects on post-viral pathology in juvenile mice (Fig. 11D–F). The effect of AM depletion could not be explained by a differential increase in acute SeV severity in mature mice, since survival, weight loss and SeV RNA expression remained age-independent in clodronate-treated mice (Supplemental Fig. 2A–C). Additionally, clodronate treatment did not induce lung pathology in isolation (Supplemental Fig. 2D). These results indicate that AMs damp post-viral lung pathology specifically in mature mice, coincident with a transcriptional reprogramming of these cells with aging.
Figure 11. Alveolar macrophages suppress post-viral pathology specifically in mature mice.
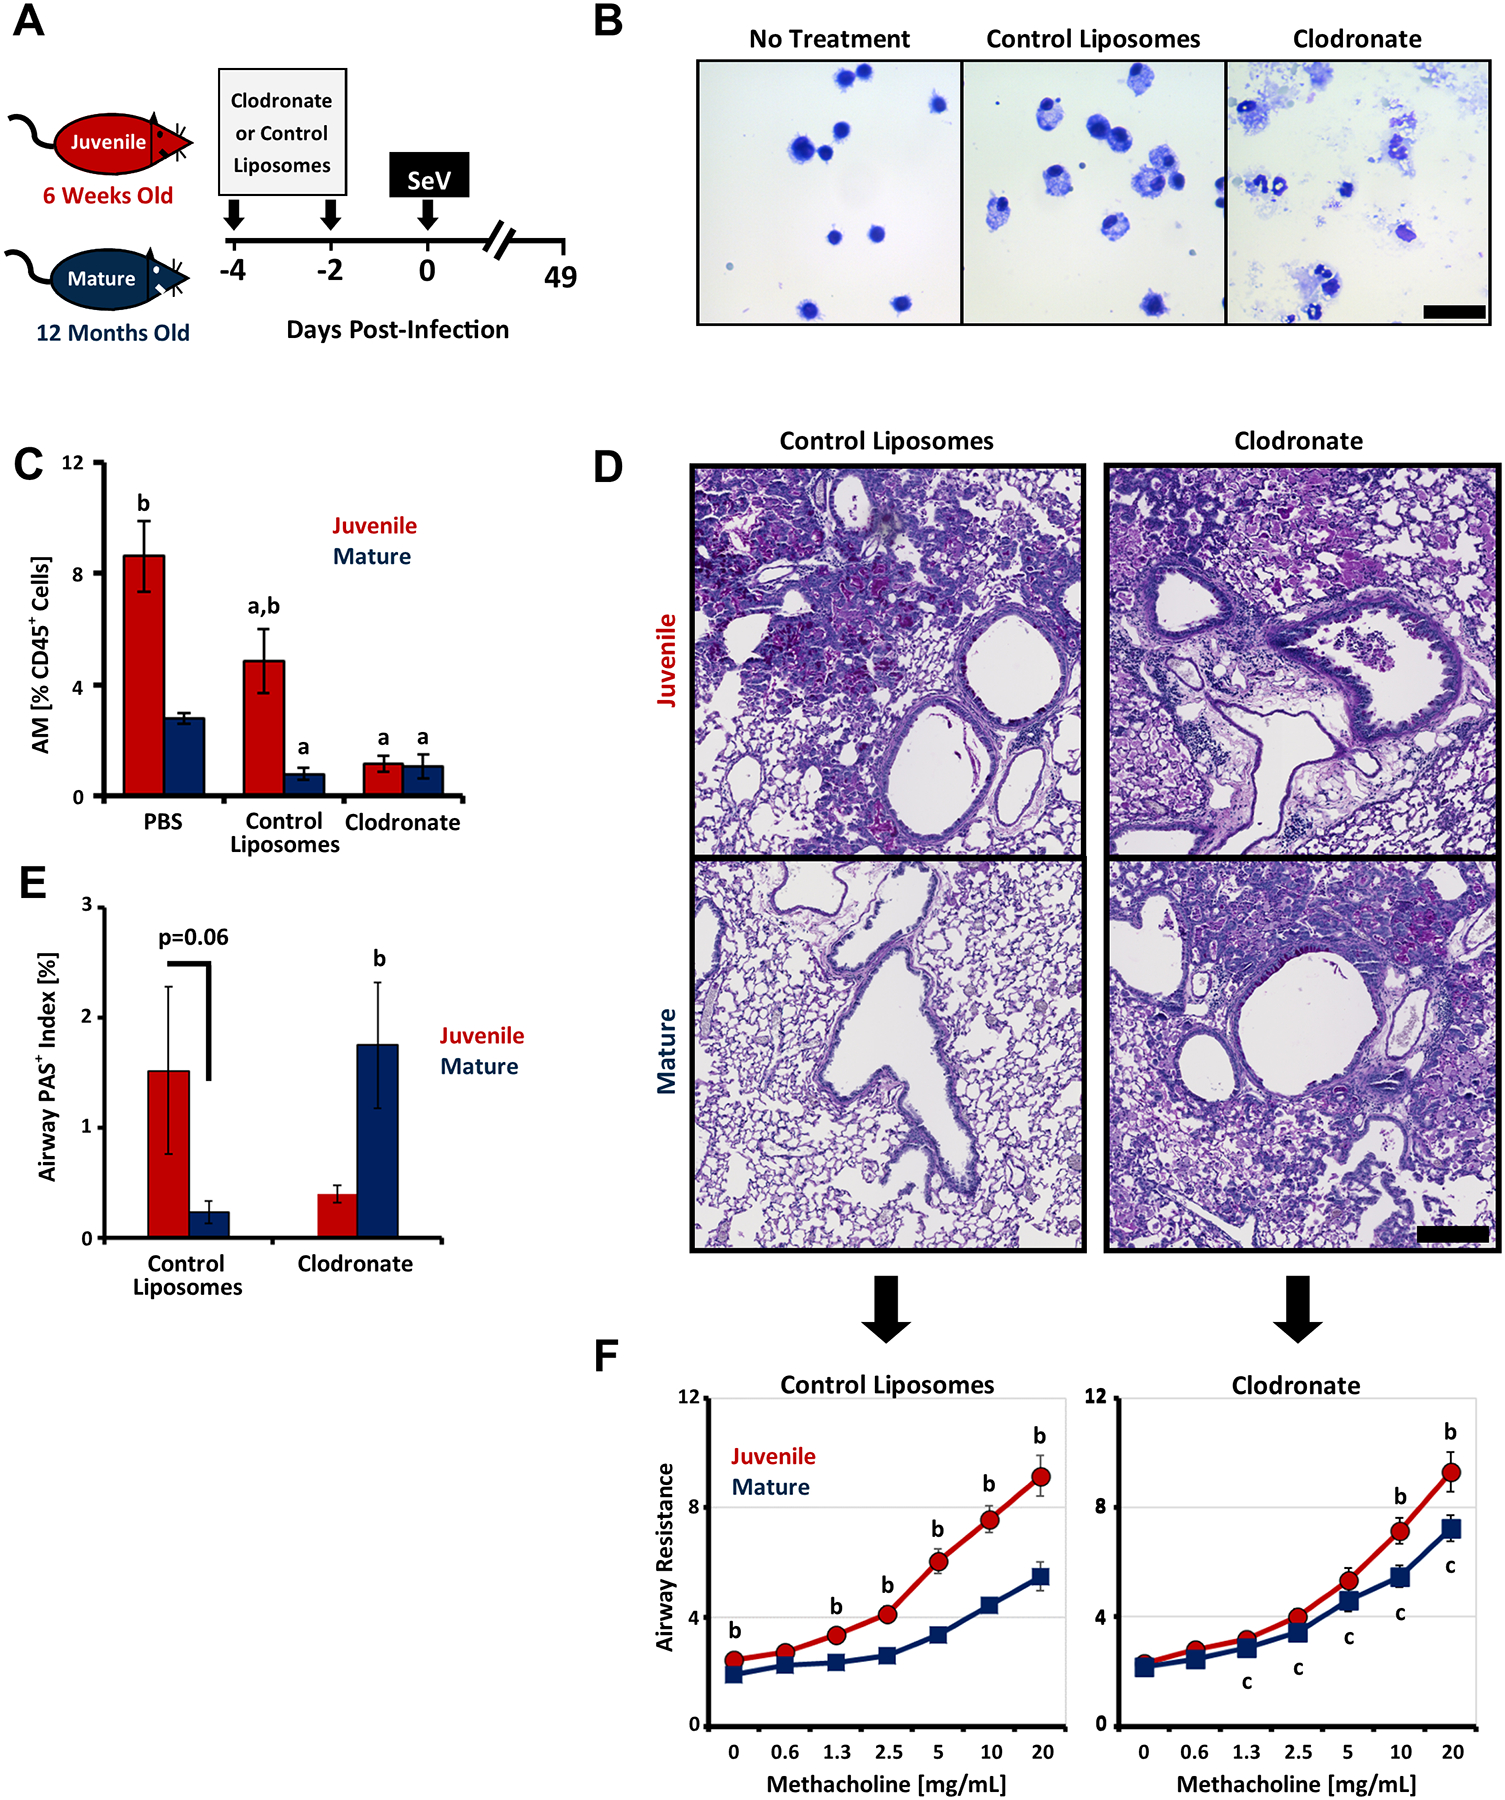
Data are pooled from 3 independent experiments comparing juvenile (6–8 weeks old) to mature (10–12 months old) mice. (A) Cartoon depicting our experimental approach for macrophage depletion (also see Methods). Mice received 2 intranasal doses of clodronate or control liposomes prior to infection with SeV (5×10⁵ pfu/mouse). (B) Representative micrographs of Diff-Qwik stained BALs from juvenile mice receiving control liposomes, clodronate liposomes, or no treatment. Scale bar=40 μm. (C) Flow cytometric quantification of AMs as a percentage of CD45+ live cells on the day of SeV infection (mean ± SE, n=3–8 pooled from two independent experiments). (D) Representative PAS-stained micrographs depicting lung pathology 49 days post-SeV infection. Scale bar=400 μm. Arrows point to corresponding methacholine challenge data (panel (E)). (E) Airway resistance (mean ± SE) as a function of methacholine exposure at SeV 49 DPI. The left panel depicts SeV-infected juvenile (n=10–11) and mature (n=7–8) mice pre-treated with control liposomes and the right depicts mice treated with clodronate liposomes. (F) Morphometric quantification of mucous cell metaplasia via airway PAS staining at SeV 49 DPI (mean ± SE) in SeV-infected juvenile (n=7–11) and mature (n=7–8) mice. ap<0.05 SeV-infected vs. PBS-treated; bp<0.05 juvenile vs. mature mice, Student’s 1-Tailed t-Test performed on log-normalized data.
DISCUSSION
Here, we detail an age-dependent host response to respiratory viruses that dictates whether an acute viral infection will result in lung pathology relevant to asthma. The age threshold for the decline in post-viral pathology in mice occurred at the juvenile-to-adult age transition. This phenomenon mirrors the decline in asthma exacerbation rates seen in childhood asthma remission. Systematic comparison of SeV-infected juvenile and mature mice revealed several points of divergence, all of which could contribute mechanistically to the age effect and are the subject of ongoing research. Mature age was marked by a lower propensity towards type 2 inflammation after viral challenge, a change in the distribution of infection within the bronchial tree, and alterations in both AM number and gene expression. Finally, our analysis of COVID-19-era clinical data strongly supports a connection between the aging out of asthma exacerbations and viral responses in children.
To our knowledge, our report represents the first mechanistic evidence connecting the host response to common respiratory viruses with childhood asthma remission, a phenomenon in which asthma control and asthma exacerbation rates gradually improve as some patients mature (55). When asthma arises in childhood, it usually presents as an acute wheezing illness, often triggered by common respiratory viruses like RSV, rhinovirus C, influenza, and parainfluenza (62). Rates of asthma remission in children tend to plateau roughly 10–15 years after disease onset, but the likelihood that remission will ever occur correlates inversely with age of asthma debut (63). This epidemiological relationship suggests that the pathophysiology usually associated with early-life asthma symptoms— viral infection— may also be connected to the process of remission. What our data add is a characterization of how age affects post-viral pathology using controlled mouse models, as well as an affirmation of clinical relevance through a novel analysis of asthma clinical activity during the COVID-19 pandemic.
In contrast to viruses, atopy is strong negative predictor of asthma remission and the resolution of asthmatic airway remodeling (7, 55, 63–65). As such, it is interesting that Alternaria-induced asthma phenotypes were less age-sensitive than those induced by SeV. Why developmental aging should impact virus-host responses differently than allergen-host responses is unclear but deserves further investigation. It is tempting to speculate that the dichotomy reflects an evolutionary need to limit lung injury in the face of yearly cycles of respiratory viral infection that, due to antigenic shifts, cannot entirely be forestalled by acquired immunity or immunologic tolerance.
Our data suggest an age-specific role for AMs in post-viral lung pathology. AMs represent the major immune cell in the lung micro-environment at baseline, and are a major source of IFNα/β production early in RNA respiratory viral infections (66). Studies show that AM depletion modifies the severity of various acute viral infections, in some cases exacerbating illness (influenza, RSV, vaccinia, and SeV as shown here) (67–69), and in other cases reducing acute illness (MHV-1 and mouse adapted SARS-CoV-1) (70, 71). Thus, AMs would seem a logical cell to influence acute host responses to viruses that later modulate chronic asthma phenotypes. Moreover, AMs were suggested to have age-specific functions in other contexts. In one report, depletion of AMs ameliorated mouse-adapted SARS pneumonia, but only in older mice (71). Future research will be needed to define specific aspects of AM reprogramming that are critical for mitigating post-viral lung pathology.
Using unsupervised mass cytometric and transcriptomic approaches, we identified upregulation of MHC-II pathway genes as a major informatic signature of AM aging. The functional significance of this change to AMs is at present unclear and will be the subject of future research. Our observation is compatible with prior reports of MHC-II upregulation in AMs from aged mice (>22 months old), particularly on CD11b+ AMs (72). Because MHC-IIHi AMs displayed more efficient phagocytosis of Mycobacterium tuberculosis (MTb) bacteria, the authors suggested senile AM changes could help explain why elderly patients are more susceptible to MTb (72). However, our study adds a key observation: MHC-II upregulation on AMs is saturating by 7 months of age in healthy mice and therefore correlates with the completion of adult maturation, not old age. The distinction is significant because published studies involving aging and immunologic responses usually report a comparison of extremes between “old” (generally >18 months old) and “young” animals (variably defined as 4 weeks to 4 months old). However, aging occurs continuously across the lifespan of an organism and there may be significant milestones relevant to disease between the extremes of age – milestones that could be missed or misinterpreted by a dichotomous approach to this biological variable. The phenomenon of asthma remission makes clear that clinically important changes to host responses occur across the childhood to adulthood aging landscape, and we show some of these can be recapitulated in mouse models. Research is needed to more precisely map how host-responses evolve across the entire continuum of aging.
It is worth mentioning some limitations to our methodological approach. Although mice are frequently used as a model organism to study inflammatory airway pathology, how far results obtained from mouse models can be generalized to human asthma is controversial (73). The scope of our data is most applicable to type 2Hi asthmatic endotypes found in children and does not address other mechanistically distinct forms of asthma found in adults like Th-17 predominant and obesity-associated disease. Our study employed predominantly male mice and further analysis of post-viral responses in female mice would be valuable. SeV induced asthmatic pathology occurs independently of T-cell function (42) and so caution should be used in extrapolating our results to acquired immune readouts like IgE production. While our study focused primarily on viral triggers because of their marked age sensitivity, our data does not exclude a role for allergen induced pathways in aspects of asthma remission. While VNAM treatment did not impact the age sensitivity of post-viral pathology, our data does not fully exclude a role for the microbiome in mediating age-dependent effects in asthma, particularly with regards to atopic triggers. Experiments in germ-free mice would constitute logical next steps. Our data examine the pathologic effects of discrete exposures to viruses or allergens as occurs during asthma exacerbations, but the clinical arc of human asthma involves recurrent exposures to such triggers over time. It is worth pointing out the C57BL6/J background is inherently primed for type 2 inflammatory responses (74, 75), so viral infection represents a second “hit” in this strain of mice. Nevertheless, further experiments involving recurrent viral challenge at different stages of development and correlation with biomarker studies in human asthma remission cohorts represent possible next steps. All considered however, our approach supplies a needed mouse model that can recapitulate aspects of childhood asthma remission, specifically the observed reduction in asthma exacerbations with older age. We anticipate it will facilitate future investigation of this poorly understood phenomenon.
In summary, we report an attenuation of post-viral chronic lung pathology and asthmatic phenotypes with maturation in mice. Alveolar macrophages have a role in mediating these age-related inflammatory differences. Our findings have implications for the natural history of asthma in children.
Supplementary Material
KEY POINTS.
The age-dependency of pediatric asthma is connected to societal viral burden.
Asthmatic phenotypes induced by viral infection attenuate with age in mice.
Alveolar macrophages contribute to the aging-out of asthmatic traits in mice.
ACKNOWLEDGEMENTS
We thank Robyn Puro and Steven Brody for their editorial input.
Funding:
This work was funded by NIH R01 HL135846, R01 HL152968, and the Children’s Discovery Institute PD-II-2016-529
Abbreviations Used in This Article:
- AM
alveolar macrophages
- COVID-19
Coronavirus Infectious Disease 2019
- ED
emergency department
- IAV
Influenza A Virus
- SeV
Sendai Virus
- scRNAseq
single cell RNA sequencing
Footnotes
DISCLOSURES
The authors report no conflict of interest.
REFERENCES
- 1.Mims JW 2015. Asthma: definitions and pathophysiology. Int Forum Allergy Rhinol 5 Suppl 1: S2–6. [DOI] [PubMed] [Google Scholar]
- 2.Yunginger JW, Reed CE, O’Connell EJ, Melton LJ 3rd, O’Fallon WM, and Silverstein MD. 1992. A community-based study of the epidemiology of asthma. Incidence rates, 1964–1983. The American review of respiratory disease 146: 888–894. [DOI] [PubMed] [Google Scholar]
- 3.Dharmage SC, Perret JL, and Custovic A. 2019. Epidemiology of Asthma in Children and Adults. Front Pediatr 7: 246. [DOI] [PMC free article] [PubMed] [Google Scholar]
- 4.Wenzel SE 2012. Asthma phenotypes: the evolution from clinical to molecular approaches. Nature medicine 18: 716–725. [DOI] [PubMed] [Google Scholar]
- 5.Strachan DP, Butland BK, and Anderson HR. 1996. Incidence and prognosis of asthma and wheezing illness from early childhood to age 33 in a national British cohort. BMJ (Clinical research ed.) 312: 1195–1199. [DOI] [PMC free article] [PubMed] [Google Scholar]
- 6.Sears MR, Greene JM, Willan AR, Wiecek EM, Taylor DR, Flannery EM, Cowan JO, Herbison GP, Silva PA, and Poulton R. 2003. A longitudinal, population-based, cohort study of childhood asthma followed to adulthood. The New England journal of medicine 349: 1414–1422. [DOI] [PubMed] [Google Scholar]
- 7.Vonk JM, Postma DS, Boezen HM, Grol MH, Schouten JP, Koeter GH, and Gerritsen J. 2004. Childhood factors associated with asthma remission after 30 year follow up. Thorax 59: 925–929. [DOI] [PMC free article] [PubMed] [Google Scholar]
- 8.Moorman JE, Akinbami LJ, Bailey CM, Zahran HS, King ME, Johnson CA, and Liu X. 2012. National surveillance of asthma: United States, 2001–2010. Vital Health Stat 3: 1–58. [PubMed] [Google Scholar]
- 9.Fleming DM, Cross KW, Sunderland R, and Ross AM. 2000. Comparison of the seasonal patterns of asthma identified in general practitioner episodes, hospital admissions, and deaths. Thorax 55: 662–665. [DOI] [PMC free article] [PubMed] [Google Scholar]
- 10.Sears MR 2008. Epidemiology of asthma exacerbations. The Journal of allergy and clinical immunology 122: 662–668. [DOI] [PubMed] [Google Scholar]
- 11.Tan WC 2005. Viruses in asthma exacerbations. Current opinion in pulmonary medicine 11: 21–26. [DOI] [PubMed] [Google Scholar]
- 12.St Louis M, Government. COVID-19 Emergency Orders. [Google Scholar]
- 13.Ehlers A, Xie W, Agapov E, Brown S, Steinberg D, Tidwell R, Sajol G, Schutz R, Weaver R, Yu H, Castro M, Bacharier LB, Wang X, Holtzman MJ, and Haspel JA. 2018. BMAL1 links the circadian clock to viral airway pathology and asthma phenotypes. Mucosal immunology 11: 97–111. [DOI] [PMC free article] [PubMed] [Google Scholar]
- 14.Keeler SP, Agapov EV, Hinojosa ME, Letvin AN, Wu K, and Holtzman MJ. 2018. Influenza A Virus Infection Causes Chronic Lung Disease Linked to Sites of Active Viral RNA Remnants. Journal of immunology (Baltimore, Md. : 1950) 201: 2354–2368. [DOI] [PMC free article] [PubMed] [Google Scholar]
- 15.Steed AL, Christophi GP, Kaiko GE, Sun L, Goodwin VM, Jain U, Esaulova E, Artyomov MN, Morales DJ, Holtzman MJ, Boon ACM, Lenschow DJ, and Stappenbeck TS. 2017. The microbial metabolite desaminotyrosine protects from influenza through type I interferon. Science (New York, N.Y.) 357: 498–502. [DOI] [PMC free article] [PubMed] [Google Scholar]
- 16.Planer JD, Peng Y, Kau AL, Blanton LV, Ndao IM, Tarr PI, Warner BB, and Gordon JI. 2016. Development of the gut microbiota and mucosal IgA responses in twins and gnotobiotic mice. Nature 534: 263–266. [DOI] [PMC free article] [PubMed] [Google Scholar]
- 17.Hamady M, Walker JJ, Harris JK, Gold NJ, and Knight R. 2008. Error-correcting barcoded primers for pyrosequencing hundreds of samples in multiplex. Nat Methods 5: 235–237. [DOI] [PMC free article] [PubMed] [Google Scholar]
- 18.Parada AE, Needham DM, and Fuhrman JA. 2016. Every base matters: assessing small subunit rRNA primers for marine microbiomes with mock communities, time series and global field samples. Environ Microbiol 18: 1403–1414. [DOI] [PubMed] [Google Scholar]
- 19.Apprill A, McNally S, Parsons R, and Weber L. 2015. Minor revision to V4 region SSU rRNA 806R gene primer greatly increases detection of SAR11 bacterioplankton. Aquatic Microbial Ecology 75: 129–137. [Google Scholar]
- 20.Callahan BJ, McMurdie PJ, Rosen MJ, Han AW, Johnson AJ, and Holmes SP. 2016. DADA2: High-resolution sample inference from Illumina amplicon data. Nat Methods 13: 581–583. [DOI] [PMC free article] [PubMed] [Google Scholar]
- 21.Wang Q, Garrity GM, Tiedje JM, and Cole JR. 2007. Naive Bayesian classifier for rapid assignment of rRNA sequences into the new bacterial taxonomy. Appl Environ Microbiol 73: 5261–5267. [DOI] [PMC free article] [PubMed] [Google Scholar]
- 22.McMurdie PJ, and Holmes S. 2013. phyloseq: an R package for reproducible interactive analysis and graphics of microbiome census data. PloS one 8: e61217. [DOI] [PMC free article] [PubMed] [Google Scholar]
- 23.Gibbings SL, Goyal R, Desch AN, Leach SM, Prabagar M, Atif SM, Bratton DL, Janssen W, and Jakubzick CV. 2015. Transcriptome analysis highlights the conserved difference between embryonic and postnatal-derived alveolar macrophages. Blood 126: 1357–1366. [DOI] [PMC free article] [PubMed] [Google Scholar]
- 24.Ritchie ME, Phipson B, Wu D, Hu Y, Law CW, Shi W, and Smyth GK. 2015. limma powers differential expression analyses for RNA-sequencing and microarray studies. Nucleic Acids Res 43: e47. [DOI] [PMC free article] [PubMed] [Google Scholar]
- 25.Law CW, Chen Y, Shi W, and Smyth GK. 2014. voom: Precision weights unlock linear model analysis tools for RNA-seq read counts. Genome Biol 15: R29. [DOI] [PMC free article] [PubMed] [Google Scholar]
- 26.Stuart T, Butler A, Hoffman P, Hafemeister C, Papalexi E, Mauck WM 3rd, Hao Y, Stoeckius M, Smibert P, and Satija R. 2019. Comprehensive Integration of Single-Cell Data. Cell 177: 1888–1902 e1821. [DOI] [PMC free article] [PubMed] [Google Scholar]
- 27.Söllner JF, Leparc G, Hildebrandt T, Klein H, Thomas L, Stupka E, and Simon E. 2017. An RNA-Seq atlas of gene expression in mouse and rat normal tissues. Sci Data 4: 170185. [DOI] [PMC free article] [PubMed] [Google Scholar]
- 28.Angelidis I, Simon LM, Fernandez IE, Strunz M, Mayr CH, Greiffo FR, Tsitsiridis G, Ansari M, Graf E, Strom TM, Nagendran M, Desai T, Eickelberg O, Mann M, Theis FJ, and Schiller HB. 2019. An atlas of the aging lung mapped by single cell transcriptomics and deep tissue proteomics. Nature communications 10: 963. [DOI] [PMC free article] [PubMed] [Google Scholar]
- 29.Haspel JA, Chettimada S, Shaik RS, Chu JH, Raby BA, Cernadas M, Carey V, Process V, Hunninghake GM, Ifedigbo E, Lederer JA, Englert J, Pelton A, Coronata A, Fredenburgh LE, and Choi AM. 2014. Circadian rhythm reprogramming during lung inflammation. Nature communications 5: 4753. [DOI] [PMC free article] [PubMed] [Google Scholar]
- 30.Brody SL, Gunsten SP, Luehmann HP, Sultan DH, Hoelscher M, Heo GS, Pan J, Koenitzer JR, Lee EC, Huang T, Mpoy C, Guo S, Laforest R, Salter A, Russell TD, Shifren A, Combadiere C, Lavine KJ, Kreisel D, Humphreys BD, Rogers BE, Gierada DS, Byers DE, Gropler RJ, Chen DL, Atkinson JJ, and Liu Y. 2021. Chemokine Receptor 2-targeted Molecular Imaging in Pulmonary Fibrosis. A Clinical Trial. American journal of respiratory and critical care medicine 203: 78–89. [DOI] [PMC free article] [PubMed] [Google Scholar]
- 31.von Garnier C, Wikstrom ME, Zosky G, Turner DJ, Sly PD, Smith M, Thomas JA, Judd SR, Strickland DH, Holt PG, and Stumbles PA. 2007. Allergic airways disease develops after an increase in allergen capture and processing in the airway mucosa. Journal of immunology (Baltimore, Md. : 1950) 179: 5748–5759. [DOI] [PubMed] [Google Scholar]
- 32.Genser B, Cooper PJ, Yazdanbakhsh M, Barreto ML, and Rodrigues LC. 2007. A guide to modern statistical analysis of immunological data. BMC Immunol 8: 27. [DOI] [PMC free article] [PubMed] [Google Scholar]
- 33.Huang da W, Sherman BT, and Lempicki RA. 2009. Systematic and integrative analysis of large gene lists using DAVID bioinformatics resources. Nat Protoc 4: 44–57. [DOI] [PubMed] [Google Scholar]
- 34.Huang da W, Sherman BT, and Lempicki RA. 2009. Bioinformatics enrichment tools: paths toward the comprehensive functional analysis of large gene lists. Nucleic Acids Res 37: 1–13. [DOI] [PMC free article] [PubMed] [Google Scholar]
- 35.Olsen SJ, Winn AK, Budd AP, Prill MM, Steel J, Midgley CM, Kniss K, Burns ER, Rowe A, Foust A, Jasso G, Merced-Morales A, Davis CT, Jang JE, Jones CD, Daly P, Gubareva L, Barnes J, Kondor R, Sessions W, Wentworth DE, Garg S, Havers FP, Fry AM, Hall AJ, Brammer L, and Silk BJ. 2021. Changes in Influenza and Other Respiratory Virus Activity During the COVID-19 Pandemic — United States, 2020–2021. MMWR Morb Mortal Wkly Rep 70: 1013–1101. [DOI] [PMC free article] [PubMed] [Google Scholar]
- 36.Edwards KM 2021. The Impact of Social Distancing for Severe Acute Respiratory Syndrome Coronavirus 2 on Respiratory Syncytial Virus and Influenza Burden. Clin Infect Dis 72: 2076–2078. [DOI] [PMC free article] [PubMed] [Google Scholar]
- 37.Kaseka ML, Ly M, Yea C, Longoni G, and Yeh EA. 2021. Impact of COVID-19 public health measures on myelin oligodendrocyte glycoprotein IgG-associated disorders in children. Mult Scler Relat Disord 56: 103286. [DOI] [PubMed] [Google Scholar]
- 38.Crichton ML, Shoemark A, and Chalmers JD. 2021. The Impact of the COVID-19 Pandemic on Exacerbations and Symptoms in Bronchiectasis: A Prospective Study. American journal of respiratory and critical care medicine 204: 857–859. [DOI] [PMC free article] [PubMed] [Google Scholar]
- 39.Alevy YG, Patel AC, Romero AG, Patel DA, Tucker J, Roswit WT, Miller CA, Heier RF, Byers DE, Brett TJ, and Holtzman MJ. 2012. IL-13-induced airway mucus production is attenuated by MAPK13 inhibition. The Journal of clinical investigation 122: 4555–4568. [DOI] [PMC free article] [PubMed] [Google Scholar]
- 40.Byers DE, Alexander-Brett J, Patel AC, Agapov E, Dang-Vu G, Jin X, Wu K, You Y, Alevy Y, Girard JP, Stappenbeck TS, Patterson GA, Pierce RA, Brody SL, and Holtzman MJ. 2013. Long-term IL-33-producing epithelial progenitor cells in chronic obstructive lung disease. The Journal of clinical investigation 123: 3967–3982. [DOI] [PMC free article] [PubMed] [Google Scholar]
- 41.Byers DE, Wu K, Dang-Vu G, Jin X, Agapov E, Zhang X, Battaile JT, Schechtman K, Yusen R, Pierce RA, and Holtzman MJ. 2018. Triggering Receptor Expressed on Myeloid Cells-2 Expression Tracks With M2-Like Macrophage Activity and Disease Severity in COPD. Chest 153: 77–86. [DOI] [PMC free article] [PubMed] [Google Scholar]
- 42.Kim EY, Battaile JT, Patel AC, You Y, Agapov E, Grayson MH, Benoit LA, Byers DE, Alevy Y, Tucker J, Swanson S, Tidwell R, Tyner JW, Morton JD, Castro M, Polineni D, Patterson GA, Schwendener RA, Allard JD, Peltz G, and Holtzman MJ. 2008. Persistent activation of an innate immune response translates respiratory viral infection into chronic lung disease. Nature medicine 14: 633–640. [DOI] [PMC free article] [PubMed] [Google Scholar]
- 43.Patel AC, Morton JD, Kim EY, Alevy Y, Swanson S, Tucker J, Huang G, Agapov E, Phillips TE, Fuentes ME, Iglesias A, Aud D, Allard JD, Dabbagh K, Peltz G, and Holtzman MJ. 2006. Genetic segregation of airway disease traits despite redundancy of calcium-activated chloride channel family members. Physiol Genomics 25: 502–513. [DOI] [PMC free article] [PubMed] [Google Scholar]
- 44.Walter MJ, Morton JD, Kajiwara N, Agapov E, and Holtzman MJ. 2002. Viral induction of a chronic asthma phenotype and genetic segregation from the acute response. The Journal of clinical investigation 110: 165–175. [DOI] [PMC free article] [PubMed] [Google Scholar]
- 45.Wang X, Wu K, Keeler SP, Mao D, Agapov EV, Zhang Y, and Holtzman MJ. 2021. TLR3-Activated Monocyte-Derived Dendritic Cells Trigger Progression from Acute Viral Infection to Chronic Disease in the Lung. Journal of immunology (Baltimore, Md. : 1950) [DOI] [PMC free article] [PubMed] [Google Scholar]
- 46.Wu K, Byers DE, Jin X, Agapov E, Alexander-Brett J, Patel AC, Cella M, Gilfilan S, Colonna M, Kober DL, Brett TJ, and Holtzman MJ. 2015. TREM-2 promotes macrophage survival and lung disease after respiratory viral infection. The Journal of experimental medicine 212: 681–697. [DOI] [PMC free article] [PubMed] [Google Scholar]
- 47.Wu K, Wang X, Keeler SP, Gerovac BJ, Agapov EV, Byers DE, Gilfillan S, Colonna M, Zhang Y, and Holtzman MJ. 2020. Group 2 Innate Lymphoid Cells Must Partner with the Myeloid-Macrophage Lineage for Long-Term Postviral Lung Disease. Journal of immunology (Baltimore, Md. : 1950) 205: 1084–1101. [DOI] [PMC free article] [PubMed] [Google Scholar]
- 48.Herring MJ, Putney LF, Wyatt G, Finkbeiner WE, and Hyde DM. 2014. Growth of alveoli during postnatal development in humans based on stereological estimation. American journal of physiology. Lung cellular and molecular physiology 307: L338–344. [DOI] [PMC free article] [PubMed] [Google Scholar]
- 49.Flurkey K 2009. The Jackson Laboratory Handbook on Genetically Standardized Mice Sixth Edition. The Jackson Laboratory, Bar Harbor, ME 04609 USA. [Google Scholar]
- 50.Chao CM, El Agha E, Tiozzo C, Minoo P, and Bellusci S. 2015. A breath of fresh air on the mesenchyme: impact of impaired mesenchymal development on the pathogenesis of bronchopulmonary dysplasia. Front Med (Lausanne) 2: 27. [DOI] [PMC free article] [PubMed] [Google Scholar]
- 51.Reynolds TH, Dalton A, Calzini L, Tuluca A, Hoyte D, and Ives SJ. 2019. The impact of age and sex on body composition and glucose sensitivity in C57BL/6J mice. Physiological reports 7: e13995. [DOI] [PMC free article] [PubMed] [Google Scholar]
- 52.Langille MGI, Meehan CJ, Koenig JE, Dhanani AS, Rose RA, Howlett SE, and Beiko RG. 2014. Microbial shifts in the aging mouse gut. Microbiome 2: 50. [DOI] [PMC free article] [PubMed] [Google Scholar]
- 53.Rosenberg HF, and Druey KM. 2018. Modeling asthma: Pitfalls, promises, and the road ahead. J Leukoc Biol 104: 41–48. [DOI] [PMC free article] [PubMed] [Google Scholar]
- 54.Burgess JA, Matheson MC, Gurrin LC, Byrnes GB, Adams KS, Wharton CL, Giles GG, Jenkins MA, Hopper JL, Abramson MJ, Walters EH, and Dharmage SC. 2011. Factors influencing asthma remission: a longitudinal study from childhood to middle age. Thorax 66: 508–513. [DOI] [PubMed] [Google Scholar]
- 55.Carpaij OA, Burgess JK, Kerstjens HAM, Nawijn MC, and van den Berge M. 2019. A review on the pathophysiology of asthma remission. Pharmacol Ther 201: 8–24. [DOI] [PubMed] [Google Scholar]
- 56.Amir el AD, Davis KL, Tadmor MD, Simonds EF, Levine JH, Bendall SC, Shenfeld DK, Krishnaswamy S, Nolan GP, and Pe’er D. 2013. viSNE enables visualization of high dimensional single-cell data and reveals phenotypic heterogeneity of leukemia. Nat Biotechnol 31: 545–552. [DOI] [PMC free article] [PubMed] [Google Scholar]
- 57.Misharin AV, Morales-Nebreda L, Mutlu GM, Budinger GR, and Perlman H. 2013. Flow cytometric analysis of macrophages and dendritic cell subsets in the mouse lung. American journal of respiratory cell and molecular biology 49: 503–510. [DOI] [PMC free article] [PubMed] [Google Scholar]
- 58.Yao Y, Jeyanathan M, Haddadi S, Barra NG, Vaseghi-Shanjani M, Damjanovic D, Lai R, Afkhami S, Chen Y, Dvorkin-Gheva A, Robbins CS, Schertzer JD, and Xing Z. 2018. Induction of Autonomous Memory Alveolar Macrophages Requires T Cell Help and Is Critical to Trained Immunity. Cell 175: 1634–1650.e1617. [DOI] [PubMed] [Google Scholar]
- 59.Reith W, LeibundGut-Landmann S, and Waldburger JM. 2005. Regulation of MHC class II gene expression by the class II transactivator. Nat Rev Immunol 5: 793–806. [DOI] [PubMed] [Google Scholar]
- 60.Wong CK, Smith CA, Sakamoto K, Kaminski N, Koff JL, and Goldstein DR. 2017. Aging Impairs Alveolar Macrophage Phagocytosis and Increases Influenza-Induced Mortality in Mice. Journal of immunology (Baltimore, Md. : 1950) 199: 1060–1068. [DOI] [PMC free article] [PubMed] [Google Scholar]
- 61.McQuattie-Pimentel AC, Ren Z, Joshi N, Watanabe S, Stoeger T, Chi M, Lu Z, Sichizya L, Aillon RP, Chen CI, Soberanes S, Chen Z, Reyfman PA, Walter JM, Anekalla KR, Davis JM, Helmin KA, Runyan CE, Abdala-Valencia H, Nam K, Meliton AY, Winter DR, Morimoto RI, Mutlu GM, Bharat A, Perlman H, Gottardi CJ, Ridge KM, Chandel NS, Sznajder JI, Balch WE, Singer BD, Misharin AV, and Budinger GRS. 2021. The lung microenvironment shapes a dysfunctional response of alveolar macrophages in aging. The Journal of clinical investigation 131. [DOI] [PMC free article] [PubMed] [Google Scholar]
- 62.Jartti T, Bonnelykke K, Elenius V, and Feleszko W. 2020. Role of viruses in asthma. Semin Immunopathol 42: 61–74. [DOI] [PMC free article] [PubMed] [Google Scholar]
- 63.De Marco R, Locatelli F, Cerveri I, Bugiani M, Marinoni A, Giammanco G, and g. Italian Study on Asthma in Young Adults study. 2002. Incidence and remission of asthma: a retrospective study on the natural history of asthma in Italy. The Journal of allergy and clinical immunology 110: 228–235. [DOI] [PubMed] [Google Scholar]
- 64.Carpaij OA, Nieuwenhuis MAE, Koppelman GH, van den Berge M, Postma DS, and Vonk JM. 2017. Childhood factors associated with complete and clinical asthma remission at 25 and 49 years. The European respiratory journal 49. [DOI] [PubMed] [Google Scholar]
- 65.van den Toorn LM, Overbeek SE, de Jongste JC, Leman K, Hoogsteden HC, and Prins JB. 2001. Airway inflammation is present during clinical remission of atopic asthma. American journal of respiratory and critical care medicine 164: 2107–2113. [DOI] [PubMed] [Google Scholar]
- 66.Kumagai Y, Takeuchi O, Kato H, Kumar H, Matsui K, Morii E, Aozasa K, Kawai T, and Akira S. 2007. Alveolar macrophages are the primary interferon-alpha producer in pulmonary infection with RNA viruses. Immunity 27: 240–252. [DOI] [PubMed] [Google Scholar]
- 67.Schneider C, Nobs SP, Heer AK, Kurrer M, Klinke G, van Rooijen N, Vogel J, and Kopf M. 2014. Alveolar macrophages are essential for protection from respiratory failure and associated morbidity following influenza virus infection. PLoS Pathog 10: e1004053. [DOI] [PMC free article] [PubMed] [Google Scholar]
- 68.Eichinger KM, Egana L, Orend JG, Resetar E, Anderson KB, Patel R, and Empey KM. 2015. Alveolar macrophages support interferon gamma-mediated viral clearance in RSV-infected neonatal mice. Respiratory research 16: 122. [DOI] [PMC free article] [PubMed] [Google Scholar]
- 69.Rivera R, Hutchens M, Luker KE, Sonstein J, Curtis JL, and Luker GD. 2007. Murine alveolar macrophages limit replication of vaccinia virus. Virology 363: 48–58. [DOI] [PMC free article] [PubMed] [Google Scholar]
- 70.Hartwig SM, Holman KM, and Varga SM. 2014. Depletion of alveolar macrophages ameliorates virus-induced disease following a pulmonary coronavirus infection. PloS one 9: e90720. [DOI] [PMC free article] [PubMed] [Google Scholar]
- 71.Zhao J, Zhao J, Van Rooijen N, and Perlman S. 2009. Evasion by stealth: inefficient immune activation underlies poor T cell response and severe disease in SARS-CoV-infected mice. PLoS Pathog 5: e1000636. [DOI] [PMC free article] [PubMed] [Google Scholar]
- 72.Lafuse WP, Rajaram MVS, Wu Q, Moliva JI, Torrelles JB, Turner J, and Schlesinger LS. 2019. Identification of an Increased Alveolar Macrophage Subpopulation in Old Mice That Displays Unique Inflammatory Characteristics and Is Permissive to Mycobacterium tuberculosis Infection. Journal of immunology (Baltimore, Md. : 1950) 203: 2252–2264. [DOI] [PMC free article] [PubMed] [Google Scholar]
- 73.Wenzel S, and Holgate ST. 2006. The mouse trap: It still yields few answers in asthma. American journal of respiratory and critical care medicine 174: 1173–1176; discussion 1176–1178. [DOI] [PubMed] [Google Scholar]
- 74.Morokata T, Ishikawa J, Ida K, and Yamada T. 1999. C57BL/6 mice are more susceptible to antigen-induced pulmonary eosinophilia than BALB/c mice, irrespective of systemic T helper 1/T helper 2 responses. Immunology 98: 345–351. [DOI] [PMC free article] [PubMed] [Google Scholar]
- 75.Teufelberger AR, Van Nevel S, Hulpiau P, Nordengrün M, Savvides SN, De Graeve S, Akula S, Holtappels G, De Ruyck N, Declercq W, Vandenabeele P, Hellman L, Bröker BM, Krysko DV, Bachert C, and Krysko O. 2020. Mouse Strain-Dependent Difference Toward the Staphylococcus aureus Allergen Serine Protease-Like Protein D Reveals a Novel Regulator of IL-33. Frontiers in immunology 11. [DOI] [PMC free article] [PubMed] [Google Scholar]
Associated Data
This section collects any data citations, data availability statements, or supplementary materials included in this article.