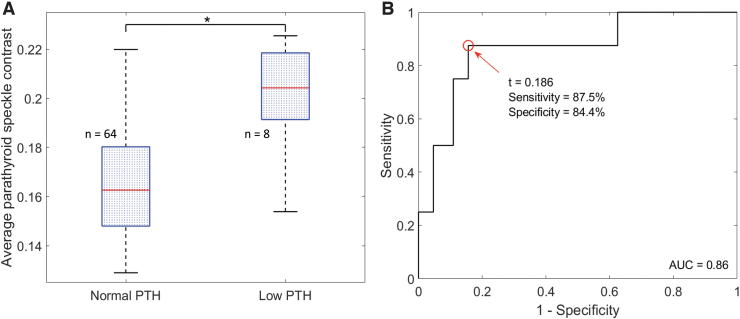
FIG. 2.
(A) Distribution of average parathyroid speckle contrast values in patients with normal and low levels of PTH on POD1. Medians are indicated by horizontal red lines, and each box spans the 25th to 75th percentile of that group. Whiskers extend to the most extreme data points not considered outliers. (B) ROC curve resulting from using average speckle contrast as a classifier. The two groups were significantly different (*:p < 10−4), and the optimum speckle contrast value (t) separating them was 0.186. POD1, postoperative day 1; PTH, parathyroid hormone; ROC, receiver operating characteristic. Color images are available online.

