

Abstract
The number-line task has been extensively used to study the mental representation of numbers in children. However, studies suggest that proportional reasoning provides a better account of children’s performance. Ninety 4- to 6-year-olds were given a number-line task with symbolic numbers, with clustered dot arrays that resembled a perceptual scaling task, or with spread-out dot arrays that involved numerical estimation. Children performed well with clustered dot arrays, but poorly with symbolic numbers and spread-out dot arrays. Performances with symbolic numbers and spread-out dot arrays were highly correlated and were related to counting skill; neither was true for clustered dot arrays. Overall, results provide evidence for the role of mental representation of numbers in the symbolic number-line task.
Humans use space to organize and represent many concepts, namely time (Boroditsky, 2000), relations (Gentner & Colhoun, 2010; Gick & Holyoak, 1983), emotion (Meier & Robinson, 2004), social power (Schubert, 2005) etc. Numbers are not exception. It has been suggested that adults organize symbolic numbers along a mental number line (e.g., Dehaene, Dupoux, & Mehler, 1990; Gallistel & Gelman, 1992; Restle, 1970), leading to a signature set of behaviors in number-related tasks. Adults, for example, respond faster to small numbers if they are on the left side than the right side of a screen, but respond faster to big numbers if they are on the right side than the left side (Dehaene et al., 1990). However, the structure of the mental number line varies according to one’s culture (Göbel, Shaki, & Fischer, 2011; Núñez, Cooperrider, & Wassmann, 2012), familiarity with the numbers (Hurst, Leigh Monahan, Heller, & Cordes, 2014), and—particularly—age (e.g., Booth & Siegler, 2006; Seron & Fayol, 1994; Siegler & Opfer, 2003).
To study the development of the mental number line, the number-line estimation task is commonly used. In this task, participants are shown an Arabic number and are asked to indicate where the number would go on a continuous number line with marked endpoints such as 0 and 100 (Booth & Siegler, 2006). Performance on this task has been considered as an indication of the individual’s mental representation of numbers, and there is a strong predictive relation between performance in this task and general mathematical competency in children. Recent studies, however, have seriously questioned this assumption (Barth & Paladino, 2011; Cohen & Sarnecka, 2014). Since the number-line task represents a case of number-to-space mapping, developments in either or both of the two domains—knowledge of the to-be-mapped numbers, and/or the spatial representation of the number line and the ability to map any magnitude dimension, not just number, proportionally to space—could drive performance. Both number representation and proportional reasoning are highly relevant to mathematics (Booth & Siegler, 2006; Boyer & Levine, 2015; Mix, Levine, & Newcombe, 2016; Newcombe, Levine, & Mix, 2015; Sasanguie, De Smedt, Defever, & Reynvoet, 2012), but it is important to know the core competency that the number-line task measures. Answers to this question are not only important for addressing the concerns about using the number-line estimation task as a measure of symbolic number understanding, but they also potentially change the explanations for a host of important findings on the development of number concepts and mathematical skills.
Performance on the number-line task has been traditionally interpreted as reflecting the underlying mental representations of numbers (e.g., Berteletti, Lucangeli, Piazza, & Zorzi, 2010; Booth & Siegler, 2006; Dehaene, Izard, Spelke, & Pica, 2008; Geary, 2007; Laski & Siegler, 2007; Opfer, Thompson, & Kim, 2016; Siegler & Opfer, 2003). Adults from an indigenous Amazonian culture who have a reduced number lexicon and little or no formal training show a logarithmic estimation on the number-line task, in which small numbers are systematically overestimated while large numbers are underestimated (Dehaene et al., 2008). Prior to formal instruction on the full range of numbers on the number-line task, young children from Western societies also showed a similar logarithmic estimation, for example, the number 20 may be estimated to be halfway between 1 and 100 on the number line where 50 should be. With learning and development, older children’s and adults’ performance resemble a linear function where the estimated locations and the true locations are highly correlated. This change in development has been theorized as a “representational shift” in which the mental representation of numbers undergoes a change from logarithmic to linear (Siegler & Opfer, 2003), driven by the acquisition of a number symbol system (Hurst et al., 2014) with corresponding changes in the neural tuning curves for the individual numbers (Prather, 2012). The view that performance in the number-line task is closely linked to an individual’s mental representations of numbers is further supported by the strong predictive relation between performance on the number-line task and general mathematical abilities, and by training studies showing that training on the number-line task led to significant improvement in children’s mathematics skills (Kucian et al., 2011; Link, Moeller, Huber, Fischer, & Nuerk, 2013; Ramani & Siegler, 2008, 2011; Siegler & Ramani, 2009). Although it has been suggested that both strategy use (White & Szucs, 2012) and general attentional skills (Anobile, Cicchini, & Burr, 2012) are related to number-line estimation, it is widely believed that the number-line task measures children’s developing mental representations of symbolic numbers.
Recently, however, the view that the number-line estimation task reflects the mental representations of numbers has been questioned in research with both adults (Cohen & Blanc-Goldhammer, 2011; Cohen & Sarnecka, 2014) and children (Barth & Paladino, 2011; Rouder & Geary, 2014; Slusser, Santiago, & Barth, 2013). These studies have suggested that the use of task-specific strategies provides a better explanation for how number-line estimation develops. In particular, it has been argued that proportional reasoning may underlie adults’ and children’s performance in the number-line task (Barth & Paladino, 2011; Slusser et al., 2013). For example, when asked where the number 45 would go on the number line, a participant may divide the number line into two parts, for example, 0–50 and 50–100, and use the midline boundary to calibrate their estimations, for example, 45 should be slightly left of 50. The number line can be further divided into four quadrants to provide even more precise calibration, for example, 28 should be slightly right of 25 (the first quadrant of the number line). Consistent with this line of reasoning, several studies report that computational models based on proportional judgment better predict children’s estimates in the number-line task compared to either the logarithmic or the linear function (Barth & Paladino, 2011; Cohen & Sarnecka, 2014; Slusser et al., 2013). Other studies have used the unbounded number-line task in which participants were shown on a computer screen a line with the unit of 1 and were asked to drag the line with a mouse to produce a particular number (e.g., 20). Under this condition, adults’ performance was better described by models that incorporate biases based on proportional reasoning. Thus, adults may indeed approach the number-line task like a proportional reasoning task (Cohen & Blanc-Goldhammer, 2011), which may also be true for older children who already have a good grasp of the number symbol system. It is less clear what drives young children’s behavior in this task: are their poor performances in the number-line task primarily due to their poor proportional reasoning skills or to developing numerical representations?
Research on the development of proportional reasoning or scaling ability has shown strong early competence, with young children, and even infants in some cases, showing early scaling ability (Boyer & Levine, 2015; Frick & Newcombe, 2012; Huttenlocher, Newcombe, & Vasilyeva, 1999). In one study (Huttenlocher, Newcombe, & Sandberg, 1994; Huttenlocher, Vasilyeva, Newcombe, & Duffy, 2008), 3- and 4-year-olds were given a one-dimensional map indicating the location of a hidden disk. They were asked to find the disk buried in a long rectangle sandbox that was 7.5 times larger than the map. Although there was a systematic bias toward the midline of the sandbox, even 3-year-olds searched in places that followed a linear function of the true locations. Based on this and other evidence that demonstrates early scaling ability, a form of proportional reasoning (Frick & Newcombe, 2012; Huttenlocher et al., 1999), it is reasonable to expect that young children have sufficient proportional reasoning skill to allow them to perform competently in the number-line task, if proportional reasoning is the only or most significant competency involved in this task. Furthermore, the scaling task resembles the number-line estimation task in that it requires the child to map from one dimension (a small-scale map; the magnitude of numbers) to another dimension (a large-scale space; a number line). The difference is this: in the case of the scaling task, no estimation of the first dimension (or the target location on the map) was required since the map was always presented in front of the participants during the experiment (Huttenlocher et al., 1994, 2008); thus, this task primarily measures proportional mapping ability. In contrast, in the case of the number-line task, it is possible that the mental representation of the numbers in young children may be imprecise and exhibit a different overall function from that found in older children and adults, resulting in a different location estimation pattern on the number line.
To weigh in with the debate between the mental number representation account and the proportional reasoning account in children’s performance on the number-line task, the majority of past research has used computational modeling (Barth & Paladino, 2011; Cohen & Sarnecka, 2014; Opfer, Siegler, & Young, 2011). Here, we took an experimental approach in which we contrasted the performance on the traditional symbolic number-line estimation task with a nonsymbolic version of the number-line task that resembles a scaling task. As shown in Figure 1A, in the symbolic number condition, 4- to 6-year-olds were shown a symbolic number and were asked where the number would go on the number line, marked with 1 and 1,000. Based on past research, we expected that most 4- to 6-year-olds would produce a logarithmic estimation for a number line of this scale. In the clustered dots condition, children were shown an array with clustered dots in which the contour area (or convex hull) of the array is a linear function of the number of dots such that a smaller array would have a smaller contour area. Children were asked to indicate where the array would go on a number line marked with pictures of 1 dot and 1,000 clustered dots. This design not only allows children to use a number of perceptual features (e.g., contour area, accumulative area, density) in solving the task, but also resembles a scaling task in which the participants can directly map the area of a dot array to the possible range of areas on the line. If proportional reasoning is the main determining factor in young children’s performance in the number-line estimation task, we should see similar patterns of responses in these two conditions. In contrast, if number representation matters in the number-line task and children at this age are fairly competent proportional mappers, but lack sophisticated number knowledge, we would see better performance in the clustered dots condition than in the symbolic number condition.
Figure 1.
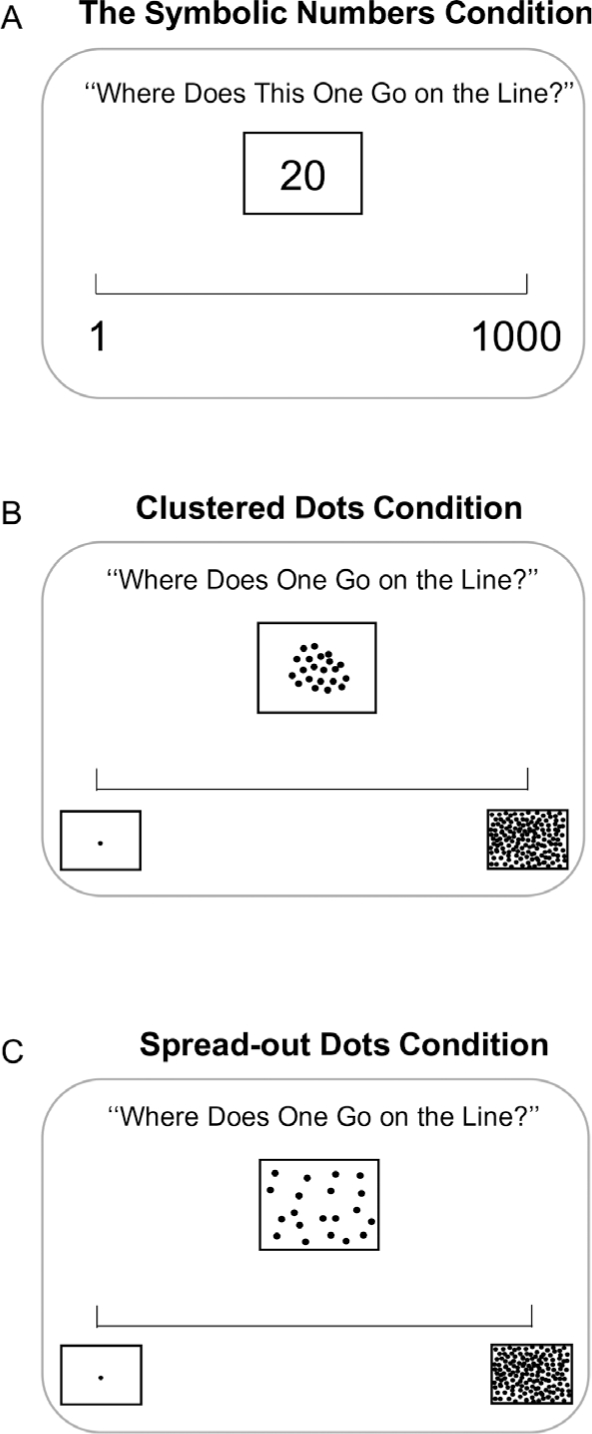
Schematic illustrations of the experimental conditions: (A) The symbolic numbers condition, (B) the clustered dot array condition, and (C) the spread-out dot array condition.
We also included an additional condition—the spread-out dots condition, in which children were shown an array with spread-out dots such that the contour areas of the arrays were comparable across trials—and they were asked to indicate where the array would go on a number line marked with pictures of 1 dot and 1,000 spread-out dots. Thus, contour area was not available as a directly perceived dimension that could be potentially scaled to the spatial array. However, other dimensions that vary with set size, for example, the accumulative area, density and numerosity of the dots, were all available and could, in principle, be used. However, prior research has linked the magnitude estimation of spread-out dot arrays to individual’s numerical competency and specifically the perception of discrete quantity (Libertus, Feigenson, & Halberda, 2013; Mazzocco, Feigenson, & Halberda, 2011). Thus, we suspected that this task would tap into numerical estimation and, thus, would likely be more similar to performance in the symbolic number condition.
In brief, if the number-line task measures proportional reasoning skills, uninfluenced by children’s abilities to represent discrete quantities, then performance should be similar across all three conditions. In contrast, if the number-line task reflects emerging numerical representations, performance in the clustered dots condition should be superior to that in the symbolic number condition (and also, likely, the spread-out dots condition). Furthermore, individual children who participated in the symbolic number condition and clustered dots condition should show no correlation between their performance in the two tasks because performance in the first requires (by hypothesis) numerical representations whereas the second may be solved by perceived area. However, if the symbolic number task and the spread-out dots task both tap into numerical representations, children who participated in both tasks should show significantly correlated performance. Finally, to link performance in the number-line task to numerical knowledge, we assessed children’s counting skill with the prediction being that counting should be linked to performance in the symbolic number-line task (and likely the spread-out dots task), if numerical knowledge matters to performance in the traditional number-line estimation task. And this should not be the case in the clustered dots condition which is hypothesized to primarily involve proportional reasoning with respect to two directly perceived dimensions (area of clustered dots and space on the number line itself).
Method
Participants
Ninety (42 females and 48 males) 4- to 6-year-olds participated in the study. Their ages ranged from 47 to 79 months, with a median age of 64 months. Families were contacted about the study through a consented database or through local preschools and day-care centers that serve families from a wide range of socioeconomic backgrounds in Monroe County, Indiana. The sample of children was broadly representative of the local population: 84% European American, 5% African American, 5% Asian American, 2% Latino, 4% Other) and consisted of predominantly working- and middle-class families. Eighteen percent of the children attended day cares or lived in neighborhoods served by schools with over a 50% participation in the free-lunch program. Informed consents were obtained from the participants’ legal guardian prior to the study. All participants completed the traditional symbolic number-line task. Fifty participants also completed the spread-out dot array task and forty participants completed the clustered dot array task.
Materials and Apparatus
The number line was a physical line of 1 m in length. It was made from a 1-m length rule (participants only saw the back of it and thus could not see any of the marks on the rule). Using this large physical number line rather than a one printed on a piece of paper allowed us to measure children’s estimation with more precision. The number line was pasted on the top of a wooden board (1 m wide and 0.5 m tall) that was displayed on a table in front of the participant. The number line was covered with Velcro, and a marker with Velcro was given to the participants to put on the number line to indicate their responses.
For the symbolic number task, the endpoints of the number line were labeled “1” and “1,000.” Eighteen 5 × 3 in. cards were made to display the following numbers: 3, 871, 206, 7, 245, 36, 10, 344, 526, 98, 739, 610, 150, 64, 814, 437, 952, 291. Numbers were printed in Arial and font size of 30.
For the nonsymbolic dot array tasks, the endpoints of the number line were labeled with a picture of 1 dot and a picture of 1,000 clustered dots or 1,000 spread-out dots (for the clustered dot array task and the spread-out dot array task respectively). Eighteen 5 × 3 in. cards were made to display dot arrays that represented the same set of numbers as in the symbolic number-line task. Figure 2 shows sample stimuli cards and the perceptual properties—including cumulative area, contour area (or convex hull) and density—of the stimuli used in the two dot array tasks. For both tasks, the stimuli cards were created using same-sized dots. Thus, multiple perceptual magnitudes were correlated with the set sizes of the arrays. For both the clustered dot array task and the spread-out dot array task, the cumulative area of the arrays and their set sizes were highly correlated. However, the clustered dot array task provided a more salient and reliable convex hull cue to the set size of the arrays. Given the strong influence of contour area on magnitude judgment for both children and adults (Clayton, Gilmore, & Inglis, 2015; Leibovich, Katzin, Harel, & Henik, 2017; Leroux et al., 2009), there is good reason to expect that children can encode contour area and may map it directly to spaces on the number line, resulting in a superior performance among all the tasks—an expectation that was confirmed by the results as reported later.
Figure 2.

Sample stimuli and perceptual properties of all stimuli used in the two dot arrays tasks. Rows 1–5: sample stimuli in the spread-out dot array task and in the clustered dot array task. Rows 6–9: the cumulative area, convex hull, and density statistics (i.e., mean, min, max values, and correlation to set size) for the spread-out dot array task and the clustered dots array task. The cumulative area was quantified by the sum of the areas of all dots. The convex hull (or contour area) was quantified by the area of the smallest polygon containing all items. The density was quantified by dividing the cumulative area by the convex hull. All statistics were proportional to the total area of the stimuli cards. Cor to SS = correlation to set size.
Procedures
Number-Line Estimation
Participants completed two versions of the number-line estimation task: (a) with symbolic digits and (b) with nonsymbolic objects (either with the clustered dot arrays or the spread-out dot arrays). Thus, all the participants completed the symbolic version of the number-line task. Fifty participants completed the spread-out dot arrays task and forty completed the clustered dot array task.
The order of the tasks was counterbalanced. For all conditions, the experimenter placed the number-line board on a table. The child sat on a chair facing the middle of the number-line board. The experimenter sat behind the board and presented the stimulus card by holding it above the center of the board. Children indicated their estimations by placing the marker on the number line. Since both the marker and the number line had Velcro attached to one side as described earlier, they could stick together via the Velcro. The marker was removed after each trial. No feedback was given and there was no time limit.
The experimenter first introduced the task to the child,
Today we are going to play a game. In this game, we are going to figure out where numbers go on our number line. See this white line here? This is our number line. There are numbers that go all along this line. We have these little men (show them the markers) and we are going to put them on the line anywhere we think the number goes.
The experimenter stressed that the numbers can go anywhere on the line. She then demonstrated that the number “1” (or 1 dot) goes to the leftmost point and the number “1,000” (or 1,000 dots) goes to the rightmost point. The experimenter also demonstrated where the number “2” (or 2 dots) and “999” (or 999 dots) goes on the number line to make sure that the child understood the task. There were 18 trials in total and demonstrations (with the numbers or dots 1, 1,000, 2, and 999) were given every six trials to ensure that participants understood the task. We chose to use the 1–1,000 range of the number-line task because it is a challenging task for 4- to 6-year-olds based on prior studies and thus may better discriminate performance in the three stimulus conditions (Cohen & Sarnecka, 2014; Reeve, Paul, & Butterworth, 2015; Siegler & Opfer, 2003).
Counting
Participants were prompted to count to 100 and were coded as either successful or unsuccessful. The experimenter provided a prompt if the participant paused, for example, “what’s after 21?” Participants who made three or fewer mistakes in counting to 100 were coded as counters. By this measure, roughly half of the participants were coded as counters while the other half were coded as noncounters. Specifically, there were 41 counters and 45 noncounters in the symbolic number condition, 21 counters and 18 noncounters in the clustered dot array condition, and 20 counters and 30 noncounters in the spread-out dot array condition.
Results
We first report analyses in which we fit participants’ number-line estimations to known functions of the target locations both on a group-level and on an individual-level. We then quantified the precision of each individual’s estimations using two established measures. Within each child, we also examined the relation between the estimation precision in the symbolic number-line task and that in the nonsymbolic number-line tasks. Finally, we report results on the various effects of counting on the different types of the number-line task performance.
The Function Fitting of the Estimations
The traditional data-analytic approach in the number-line task fits the estimated locations to both a logarithmic function and a linear function of the true locations (Booth & Siegler, 2006; Siegler & Opfer, 2003). Later studies have suggested alternative functions for fitting number-line estimation data (Barth & Paladino, 2011; Dackermann, Huber, Bahnmueller, Nuerk, & Moeller, 2015; Ebersbach, Luwel, Frick, Onghena, & Verschaffel, 2008). Our goal was not to identify the best fitting model but rather to investigate how responses differ among the experimental conditions. Accordingly, we fit the data to the traditional linear and logarithmic functions as well as a mixed logarithm–linear function, a method for quantifying performance that may be characterized by the combination of the logarithmic and the linear functions (Anobile et al., 2012; Cicchini, Anobile, & Burr, 2014; Kim & Opfer, 2017; Opfer et al., 2016). We also fit the data to proportional reasoning models (i.e., cyclic power models), which did not provide a good fit for the current data and are not discussed further; see Supporting Information for all the modeling results and all of the functions used in the following analyses.
We first report model fitting results for the linear function and the logarithmic function. Following past research, the analysis was done both on a group-level and on an individual-level. For the group-level analysis, for each number, we calculated the median estimation from the group and fit these estimations to both a logarithmic and a linear function of the true locations. As in all model fitting to this type of data, multiple models fit reasonably well and multiple criterion can be used to quantify the best model (Dackermann et al., 2015). Following past research (Booth & Siegler, 2006; Cohen & Blanc-Goldhammer, 2011), we used the amount of variance explained by the model (or R2) and the Akaike information criterion (AIC) goodness-of-fit measure to quantify model fitting. As shown in Figure 3A, estimations in the symbolic number-line condition were better fit by a logarithmic function (F(1, 16) = 605, p < .001, R2 = .97, AIC = 188) as opposed to a linear function (F(1, 16) = 24, p < .001, R2 = .60, AIC = 236). In contrast, estimations in the clustered dot array condition were better fit by a linear function (F(1, 16) = 169, p < .001, R2 = .91, AIC = 220) than a logarithmic function (F(1, 16) = 88, p < .001, R2 = .85, AIC = 230). Similar to the symbolic number-line condition, estimations in the spread-out dot array condition were better fit by a logarithmic function (F(1, 16) = 805, p < .001, R2 = .98, AIC = 190) as opposed to a linear function (F(1, 16) = 44, p < .001, R2 = .73, AIC = 238).
Figure 3.

Results from fitting the data to the linear or the logarithmic functions. (A) The better fit function (i.e., linear or logarithmic) for the group median estimate in each condition. (B) The proportion of children whose estimations were better fit by either the linear or the logarithmic function by condition.
This pattern of results was also reflected in an individual-level analysis. For each child, we fit the estimations by both a linear function and a logarithmic function of the true locations and calculated which one was the better fit for the child based on the AIC scores. We then calculated for all conditions the proportion of children whose estimations were better fit by a logarithmic function or by a linear function. A chi-squared test of independence was calculated comparing the better fit function in the symbolic number condition and that in the clustered dot array condition; a significant interaction was found, χ2(1) = 32.49, p < .001. As shown in Figure 3B, in the symbolic number condition, more children whose estimations were better characterized by the logarithmic function as opposed to the linear function (87% vs. 12%). In contrast, in the clustered dot array condition, more children whose estimations were better characterized by the linear as opposed to the logarithmic function (63% vs. 37%). In the spread-out dot array condition, similar to the symbolic number condition, more children whose estimations were better fit by the logarithmic function as opposed to the linear function (90% vs. 10%).
Fitting data to the mixed logarithm–linear function corroborates the above results. The mixed model combines the linear and algorithmic functions to capture the data that might be a combination of both (see Supporting Information for the corresponding mathematical function). The degree of logarithmic compression is quantified by the λ value (set to be between 0 and 1) with higher values indicating more compression (Anobile et al., 2012; Cicchini et al., 2014; Kim & Opfer, 2017; Opfer et al., 2016). As shown in Figure 4A, the mixed logarithm–linear function fits well with the median estimations from the groups. And consistent with the previous results, the λ value was highest in the symbolic number-line condition (λ = 1) and lowest in the clustered dot array condition (λ = .37) with the value in the spread-out dot array condition in the middle (λ = .77). Fitting the mixed logarithmic–linear function to individual children’s data revealed a similar pattern. Figure 4B shows the λ values for all children in the three conditions. As can be seen, the λ values in both the symbolic number-line condition and the spread-out dot array condition were significantly skewed with most of the values being close to the upper limit 1. In contrast, λ values in the clustered dot array condition were more evenly distributed between 0 and 1 with some children having very little evidence of logarithmic compression in their estimation while others showing more logarithmic biases.
Figure 4.

Results from fitting the data to the mixed logarithmic– linear function. (A) The best fit function for the group median estimate in each condition. (B) Boxplot of the lambda values for each participants’ (shown as dots) best fitting function by condition.
Overall, the model fits at the group-level and individual-level data provide converging and robust evidence that young children’s performance in the symbolic number-line condition shows more logarithmic compression than their performance in the clustered dot array condition.
The Precision of the Estimations
Proportion of absolute error (PAE) has been commonly used to measure the precision of the number-line task performance for individual children (Booth & Siegler, 2006; Sasanguie et al., 2012). As shown further down, it is computed by averaging the deviations of the estimations from the true values and then dividing it by the scale of the number line. However, this approach is particularly sensitive to extreme values; a large deviation on a single trial can significantly influence the overall score.
Another way to quantify the precision of number-line estimations is to calculate the correlation between the estimated locations and the true locations (Dehaene et al., 2008). As shown further down, this method essentially calculates the z scores for the estimated locations and the true locations and provides a quantification of their similarity.
Based on these considerations, we calculated both a PAE score and a correlation score for each child. For the PAE score analysis, a linear mixed effect model was conducted using the lme4 package (Bates, Maechler, Bolker, & Walker, 2015) in the R environment (R Development Core Team, 2007). Significant values were obtained using the afex package (Singmann, Bolker, Westfall, & Aust, 2015) with the likelihood ratio test method, which performs a likelihood ratio test using the Kenward-Roger approximation. Condition was entered as a fixed factor and subject was entered as a random factor (Pinheiro & Bates, 2000). As shown in Figure 5A, there was a significant main effect of condition, χ2(2) = 41.53, p < .001. Post hoc tests correcting for multiple comparisons using the emmeans package (Lenth, Singmann, Love, Buerkner, & Herve, 2019) showed that: deviations in the symbolic number condition (M = .3, SD = .08) were significantly greater than those in the clustered dot array condition (M = .21, SD = .07), t(115) = 6.91, p < .001; in contrast, there was no significant difference between the deviations in symbolic number condition and those in the spread-out dot array condition (M = .3, SD = .08), t(108) = −0.67, p = .78. The difference between the two dot array condition was also statistically significant, t(149) = 6.05, p < .001.
Figure 5.

Results from the precision of estimation analysis. (A) Proportion of absolute error scores by condition. (B) Correlation between the estimated locations and the true locations by condition. For both A and B, the bars indicate group average; the red lines indicate the standard errors of the group; the black dots indicate the performance from individual children.
For the correlation score analysis, following past research (Slusser et al., 2013), participants who produced negative correlations between their estimation and the true location on the number line (N = 5) were excluded from this and following analyses using correlation scores as the dependent measure but not on other measures (e.g., PAE). A linear mixed effect model was conducted in which the condition was entered as a fixed factor and subject was entered as a random factor. As shown in Figure 5B, there was a significant main effect of condition, χ2(2) = 43.35, p < .001. Post hoc tests correcting for multiple comparisons showed that: correlations between the true values and the estimated values in the symbolic number condition (M = .56, SD = .26) were significantly lower than those in the clustered dot array condition (M = .77, SD = .21), t (114) = −6.99, p < .001. Correlations in the symbolic number condition were also significantly lower than those in the spread-out dot array condition (M = .70, SD = .17), t(105) = −3.60, p < .01. The difference between the two dot array condition was also statistically significant, t(150) = 3.12, p < .01.
Overall, the main finding is that estimations were less deviant from and more correlated to the true locations in the clustered dots condition than the symbolic number condition. These findings, in conjunction with the fits of functions, strongly suggest that for 4- to 6-year-old children, the number-line tasks with clustered dots and with symbols are not tapping into the same strategies and underlying mental representations.
The Relation Among Variations of the Number-Line Task Within Individual Children
To examine how performance in the symbolic number-line task and the nonsymbolic number-line tasks were related within individual children, we calculated the correlation between performance in the symbolic number condition and performance in the clustered dots condition, as well as the correlation between performance in the symbolic number condition and performance in the spread-out dot array condition. For the PAE scores, as shown in Figure 6 (top panel), there was a large and significant correlation between the symbolic number condition and that in the spread-out dot array condition within individual children, r = .51, t (48) = 4.15, p < .001. In contrast, PAE scores in the symbolic number condition and those in the clustered dot array condition were only weakly correlated, r = .35, t(38) = 2.26, p = .03. For the correlation scores, as shown in Figure 6 (bottom panel), there was a large and significant correlation between the symbolic number condition and those in the spread-out dot array condition, r = .45, t (47) = 3.5, p = .001. In contrast, correlation scores in the symbolic number condition and those in the clustered dot array condition were not significantly correlated, r = .23, t(35) = 1.39, p = .17.
Figure 6.

Correlation between performance in the symbolic and nonsymbolic number-line tasks within individual children. Left panel: the correlation between the symbolic numbers condition and the spread-out dot array condition. Right panel: the correlation between the symbolic numbers condition and the clustered dot array condition. Top panel: proportion of absolute error (PAE) scores. Bottom panel: correlation scores.
Overall, the performance in the symbolic number condition was highly related to the individual’s performance in the spread-out dot array condition, presumably because they both involved mapping numerical magnitudes to space. In contrast, performance in the symbolic number condition and that in the clustered dot array condition were either not significantly correlated or correlated but to a much lesser degree, suggesting that these tasks might involve the use of different skills.
The Role of Counting in Variations of the Number-Line Task
If the hypothesis is correct that the symbolic number-line condition measures mental representations of numbers while the nonsymbolic clustered dot array condition mainly involves a proportional mapping between two perceptual features, we would expect counting to be related to performance in the symbolic number-line condition but not in the clustered dot arrays condition. To test this, we separated participants into two groups—counters and noncounters—and compared their PAE scores and correlation scores across the conditions. Table 1 shows the results from both groups as well as the comparison between them across all conditions. As shown in Figures 7A and 7B, counting skill was strongly related to how well children performed in the symbolic number condition—counters’ estimations were significantly less deviant and more correlated with the true locations than those of noncounters—but not in the clustered dot array condition. Counting skill also appeared to predict the performance in the spread-out dot array condition by the measure of correlation score.
Table 1.
Performance of Counters and Noncounters Across Conditions
| Counters | Noncounters | t-tests | ||
|---|---|---|---|---|
|
| ||||
| PAE score | Symbolic numbers | M = .28 (SD = .08) | M = .3 (SD = .08) | t(88) = −1.99, p = .049 |
| Clustered dots | M = .20 (SD = .07) | M = .23 (SD = .06) | t(38) = −1.64, p = .10 | |
| Spread-out dots | M = .3 (SD = .06) | M = .31 (SD = .09) | t(48) = −0.29, p = .77 | |
| Correlation score | Symbolic numbers | M = .67 (SD = .15) | M = .45 (SD = .29) | t(84) = 3.90, p < .001 |
| Clustered dots | M = .82 (SD = .16) | M = .71 (SD = .25) | t(37) = 1.29, p = .20 | |
| Spread-out dots | M = .77 (SD = .07) | M = .65 (SD = .19) | t(48) = 2.61, p = .01 | |
Note. PAE = proportion of absolute error.
Figure 7.

Results from the counting skills analysis. (A) Proportion of absolute error (PAE) scores for counters and noncounters by condition. (B) Correlation scores for counters and noncounters by condition. (C) Better fit functions for the group median estimates from the counters and noncounters by condition. Statistical significance was based on two sample t-test.
*p < .05. **p < .01.
Fitting the group median estimations to different functions of the true locations showed a similar trend as the above analyses. As shown in Figure 7C, the tendency of overestimating smaller numbers and underestimating large numbers was slightly less potent in the counters than the noncounters in the symbolic number condition (counters: λ = .94, noncounters: λ = 1) and in the spread-out dot array condition (counters: λ = .76, noncounters: λ = .78), suggesting that both are related to number knowledge. In contrast, in the clustered dot array condition, the linear regression lines for the counters and noncounters essentially overlapped with each other, indicating that the skill involved in this task was independent from the participant’s number knowledge.
Discussion
Research on human numerical cognition has shown qualitative differences as a function of age in the mental representation of numbers with corresponding behavioral and neurological changes (Ansari, Garcia, Lucas, Hamon, & Dhital, 2005; Brannon, 2002; Dehaene, 1992; Gallistel & Gelman, 1992; Prather, 2012; Rivera, Reiss, Eckert, & Menon, 2005; Rosenberg-Lee, Barth, & Menon, 2011; Watts, Duncan, Siegler, & Davis-Kean, 2014). Thus, developmental changes in number representation are not in question; what has been debated is whether performance in the number-line task reflects these representational changes (Barth & Paladino, 2011; Cohen & Sarnecka, 2014; Opfer et al., 2011, 2016). If proportional reasoning skill is the core competency driving the developmental changes in the number-line task as has been suggested (Barth & Paladino, 2011; Cohen & Sarnecka, 2014; Rouder & Geary, 2014; Slusser et al., 2013), then young children who perform poorly in the number-line task should also do so in a comparable task that mainly involves basic proportional reasoning ability. On the contrary, the current study showed that 4- to 6-year-olds were much more competent in the clustered dot array task—readily solvable by basic proportional reasoning skills—than in the symbol number-line task, suggesting that proportional reasoning is not the only or even the main contributing factor in young children’s number-line task performance. This empirical evidence goes beyond the modeling approach that has been commonly used in the literature (Barth & Paladino, 2011; Opfer et al., 2011; Slusser et al., 2013), and strongly suggests a role of mental number representation in the number-line task for young children.
Using a variety of different measures (e.g., function fitting, proportional of absolute errors, correlation), the current study showed that: when asked to map symbolic numbers to a symbolic number line with endpoints marked “1” and “1,000,” 4- to 6-year-olds produced less accurate and logarithmic estimations, consistent with previous research on children’s performance in the number-line task (Booth & Siegler, 2006; Siegler & Opfer, 2003). In contrast, when asked to map clustered dot arrays to a nonsymbolic number line with endpoints marked 1 dot and 1,000 clustered dots—a task that resembled a scaling task—children produced more accurate and linear estimations. When asked to map spread-out dot arrays to a nonsymbolic number line with endpoints marked 1 dot and 1,000 spread-out dots—a task that likely required some degree of numerical estimation—children performed quite similar to the symbolic number-line task. Furthermore, within individual children, performance in the symbolic number-line task was strongly correlated with the performance in the spread-out dot array task, and both were related to the child’s counting skill; neither of these was true for the performance in the clustered dot array task.
The overall result is consistent with the “representational shift” account of number-line development (Booth & Siegler, 2006, 2008; Opfer et al., 2016; Siegler & Opfer, 2003). For young children (4- to 6-year-olds) who have limited knowledge on the 1 to 1,000 number range, their number-line estimations followed a logarithmic function of the true locations. However, these children performed significantly better in the clustered dot array version of the number-line task in which basic scaling ability sufficed. This result is also consistent with what we know about the development of proportional reasoning (Mix et al., 2016; Vasilyeva & Lourenco, 2012). Numerous studies have shown that very young children, even infants in some cases, show early sensitivity to scaling, and can proportionally map the locations shown on a small-scale map to a large-scale space (Huttenlocher et al., 1994, 1999, 2008). The unique contribution of the current study is to show the critical dissociation between early proportional reasoning ability and young children’s performance in the number-line estimation task. We demonstrate empirically that young children’s poor performance in the number-line task is not due to poor proportional reasoning ability; rather, the mental representation of numbers seems to be the major limiting factor in their number-line estimation.
The claim is not that proportional reasoning is not important for the symbolic number-line task. To perform competently in the number-line estimation task, one needs to be able to: (a) accurately represent the magnitudes of the to-be-mapped symbolic numbers, and (b) place these symbolic numbers proportionally to the number line. Young children who have very limited knowledge of the number symbol system—who may not even know that the middle between 1 and 1,000 is 500—are less likely to be able to successfully deploy their proportional reasoning skills to solve the symbolic number-line estimation task, even though scaling ability between two perceptual dimensions emerges quite early (Huttenlocher et al., 1994, 1999, 2008). Proportional reasoning is likely a significant contributing factor in the number-line performance for older children and adults who have more in-depth knowledge about the number symbol system and increased proportional reasoning skills both in the ability to use categorical encoding (Plumert, Hund, & Recker, 2007; Quinn, Norris, Pasko, Schmader, & Mash, 1999; Sandberg, Huttenlocher, & Newcombe, 1996) and to calibrate targets according to category boundaries (Jeong, Levine, & Huttenlocher, 2007; Newcombe, Huttenlocher, & Learmonth, 1999; Plumert et al., 2007). Once an individual develops knowledge on the full scale of numbers on a number line, the number-line task indeed highly resembles a proportional reasoning task. In fact, using an unbounded number-line task, research has shown that it is the approach that most adults take (Cohen, Blanc-Goldhammer, & Quinlan, 2018).
Current understanding of the life-span development in the number-line task can benefit from considering the dynamic influence of multiple factors on an individual’s performance. Number knowledge (Booth & Siegler, 2006; Siegler & Opfer, 2003), proportional reasoning (Barth & Paladino, 2011; Slusser et al., 2013), relational thinking (Rattermann & Gentner, 1998; Thompson & Opfer, 2010), categorical language (Landy, Charlesworth, & Ottmar, 2016), awareness and adoption of strategies (White & Szucs, 2012), as well as visual attention and calibration skills (Anobile et al., 2012; Cicchini et al., 2014) are all likely factors that determine an individual’s performance in the number-line task. The fact that even the same child or adult can have different estimation patterns depending on the scale of the number line (Landy, Charlesworth, & Ottmar, 2014; Landy et al., 2016; Siegler & Opfer, 2003; Slusser et al., 2013) attests to the fluidity of this task and to the influence of multiple factors on an individual’s behavior. Number knowledge certainly matters in the number-line task (Booth & Siegler, 2006, 2008), but so do the awareness and successful deployment of strategies during online processing of the task, which can be reflected by the individual’s eye movements (van’t Noordende, van Hoogmoed, Schot, & Kroesbergen, 2016; Reinert, Huber, Nuerk, & Moeller, 2015; Sullivan, Juhasz, Slattery, & Barth, 2011).
Proportional reasoning skill itself undergoes significant changes both in the complexity of categorical encoding and the ability to calibrate the target according to category boundaries (Plumert et al., 2007; Quinn et al., 1999; Sandberg et al., 1996). Similarly, number knowledge also continues to increase with development (Ansari et al., 2005; Brannon, 2002; Dehaene, 1992; Gallistel & Gelman, 1992; Rivera et al., 2005), so does the ability to use relational thinking to expand on the number scales that we already know to the ones that are vastly beyond human perception of quantities (e.g., 1 million, 1 trillion; Thompson & Opfer, 2010). All of these are potential contributing factors for the number-line task performance; however, all of these component skills likely have distinct developmental trajectories and may exert different degrees of the influence to the number-line task for different age groups.
Limitations
Further research is needed to assess these larger issues and we note here several limitations of the present study. First, the current study only assessed the children’s performance in the number-line task during one session. A longitudinal design that tracks individual children’s behavioral changes over time as well as other direct measures of emerging number skills would provide more insight into the development of the number-line task and its relation to developing numerical representations. Second, the current study assessed only a global measure of numerical development (counting). To better understand the processes that link developing number knowledge to performance, fine-grained and converging measures of symbolic number knowledge are required. Lastly, while children’s final responses were the primary dependent measures in the current study, incorporating other methodologies such as eye-tracking would provide more information on the real-time dynamic processes involved in the task and potential differences in strategy use. All of these factors should be taken into consideration for a full understanding of an individual’s ability to map numbers to space in the number-line estimation task.
Conclusion
The main finding, and one critical to current assessments and theories of developing number knowledge, is this: the number-line task remains a useful measure and predictor of young children’s changing numerical representations (Schneider et al., 2018).
Supplementary Material
Acknowledgments
This research was supported by NSF DRL 1621-93 grant to Linda B. Smith and Kelly S. Mix, IES R305A080287 grant to Linda B. Smith and Kelly S. Mix, and NICHD F32 HD090827-02 grant to Lei Yuan.
Footnotes
Supporting Information
Additional supporting information may be found in the online version of this article at the publisher’s website:
Appendix S1. Mathematical functions and model fitting results.
Contributor Information
Lei Yuan, Indiana University.
Richard Prather, University of Maryland.
Kelly S. Mix, University of Maryland
Linda B. Smith, Indiana University and University of East Anglia
References
- Anobile G, Cicchini GM, & Burr DC (2012). Linear mapping of numbers onto space requires attention. Cognition, 122, 454–459. 10.1016/J.COGNITION.2011.11.006 [DOI] [PubMed] [Google Scholar]
- Ansari D, Garcia N, Lucas E, Hamon K, & Dhital B (2005). Neural correlates of symbolic number processing in children and adults. NeuroReport, 16, 1769–1773. 10.1097/01.wnr.0000183905.23396.f1 [DOI] [PubMed] [Google Scholar]
- Barth HC, & Paladino AM (2011). The development of numerical estimation: Evidence against a representational shift. Developmental Science, 14, 125–135. 10.1111/j.1467-7687.2010.00962.x [DOI] [PubMed] [Google Scholar]
- Bates D, Maechler M, Bolker B, & Walker S (2015). lme4: Linear mixed-effects models using Eigen and S4. R package version 1.1–7. 2014. [Google Scholar]
- Berteletti I, Lucangeli D, Piazza M, & Zorzi M (2010). Numerical estimation in preschoolers. Developmental Psychology, 46, 545–551. 10.1037/a0017887 [DOI] [PubMed] [Google Scholar]
- Booth JL, & Siegler RS (2006). Developmental and individual differences in pure numerical estimation. Developmental Psychology, 42, 189–201. 10.1037/0012-1649.41.6.189 [DOI] [PubMed] [Google Scholar]
- Booth JL, & Siegler RS (2008). Numerical magnitude representations influence arithmetic learning. Child Development, 79, 1016–1031. 10.1111/j.1467-8624.2008.01173.x [DOI] [PubMed] [Google Scholar]
- Boroditsky L (2000). Metaphoric structuring: understanding time through spatial metaphors. Cognition, 75(1), 1–28. 10.1016/S0010-0277(99)00073-6 [DOI] [PubMed] [Google Scholar]
- Boyer TW, & Levine SC (2015). Prompting children to reason proportionally: Processing discrete units as continuous amounts. Developmental Psychology, 51, 615–620. 10.1037/a0039010 [DOI] [PubMed] [Google Scholar]
- Brannon EM (2002). The development of ordinal numerical knowledge in infancy. Cognition, 83, 223–240. 10.1016/S0010-0277(02)00005-7 [DOI] [PubMed] [Google Scholar]
- Cicchini GM, Anobile G, & Burr DC (2014). Compressive mapping of number to space reflects dynamic encoding mechanisms, not static logarithmic transform. Proceedings of the National Academy of Sciences of the United States of America, 111, 7867–7872. 10.1073/pnas.1402785111 [DOI] [PMC free article] [PubMed] [Google Scholar]
- Clayton S, Gilmore C, & Inglis M (2015). Dot comparison stimuli are not all alike: The effect of different visual controls on ANS measurement. Acta Psychologica, 161, 177–184. 10.1016/J.ACTPSY.2015.09.007 [DOI] [PubMed] [Google Scholar]
- Cohen DJ, & Blanc-Goldhammer D (2011). Numerical bias in bounded and unbounded number line tasks. Psychonomic Bulletin & Review, 18, 331–338. 10.3758/s13423-011-0059-z [DOI] [PMC free article] [PubMed] [Google Scholar]
- Cohen DJ, Blanc-Goldhammer D, & Quinlan PT (2018). A mathematical model of how people solve most variants of the number-line task. Cognitive Science, 42, 2621–2647. 10.1111/cogs.12698 [DOI] [PMC free article] [PubMed] [Google Scholar]
- Cohen DJ, & Sarnecka BW (2014). Children’s number-line estimation shows development of measurement skills (not number representations). Developmental Psychology, 50, 1640–1652. 10.1037/a0035901 [DOI] [PMC free article] [PubMed] [Google Scholar]
- Dackermann T, Huber S, Bahnmueller J, Nuerk H-C, & Moeller K (2015). An integration of competing accounts on children’s number line estimation. Frontiers in Psychology, 6, 884. 10.3389/fpsyg.2015.00884 [DOI] [PMC free article] [PubMed] [Google Scholar]
- Dehaene S (1992). Varieties of numerical abilities. Cognition, 44(1–2), 1–42. 10.1016/0010-0277(92)90049-N [DOI] [PubMed] [Google Scholar]
- Dehaene S, Dupoux E, & Mehler J (1990). Is numerical comparison digital? Analogical and symbolic effects in two-digit number comparison. Journal of Experimental Psychology. Human Perception and Performance, 16(3), 626–641. 10.1037//0096-1523.16.3.626 [DOI] [PubMed] [Google Scholar]
- Dehaene S, Izard V, Spelke E, & Pica P (2008). Log or linear? Distinct intuitions of the number scale in Western and Amazonian indigene cultures. Science, 320, 1217–1220. 10.1126/science.1156540 [DOI] [PMC free article] [PubMed] [Google Scholar]
- Ebersbach M, Luwel K, Frick A, Onghena P, & Verschaffel L (2008). The relationship between the shape of the mental number line and familiarity with numbers in 5- to 9-year old children: Evidence for a segmented linear model. Journal of Experimental Child Psychology, 99(1), 1–17. 10.1016/J.JECP.2007.08.006 [DOI] [PubMed] [Google Scholar]
- Frick A, & Newcombe NS (2012). Getting the big picture: Development of spatial scaling abilities. Cognitive Development, 27, 270–282. 10.1016/j.cogdev.2012.05.004 [DOI] [Google Scholar]
- Gallistel CR, & Gelman R (1992). Preverbal and verbal counting and computation. Cognition, 44(1–2), 43–74. 10.1016/0010-0277(92)90050-R [DOI] [PubMed] [Google Scholar]
- Geary DC (2007). Development of mathematical understanding. Handbook of Child Psychology, 2, 777–810. 10.1002/9780470147658.chpsy0218 [DOI] [Google Scholar]
- Gentner D, & Colhoun J (2010). Analogical processes in human thinking and learning. In Glatzeder B, Goel V, & Müller A (Eds.), Towards a theory of thinking (pp. 35–48). Berlin, Heidelberg, Germany: Springer. 10.1007/978-3-642-03129-8_3 [DOI] [Google Scholar]
- Gick ML, & Holyoak KJ (1983). Schema induction and analogical transfer. Cognitive Psychology, 15(1), 1–38. 10.1016/0010-0285(83)90002-6 [DOI] [Google Scholar]
- Göbel SM, Shaki S, & Fischer MH (2011). The cultural number line: A review of cultural and linguistic influences on the development of number processing. Journal of Cross-Cultural Psychology, 42, 543–565. 10.1177/0022022111406251 [DOI] [Google Scholar]
- Hurst M, Leigh Monahan K, Heller E, & Cordes S (2014). 123s and ABCs: Developmental shifts in logarithmic-to-linear responding reflect fluency with sequence values. Developmental Science, 17, 892–904. 10.1111/desc.12165 [DOI] [PubMed] [Google Scholar]
- Huttenlocher J, Newcombe N, & Sandberg EH (1994). The coding of spatial location in young children. Cognitive Psychology, 27, 115–147. 10.1006/cogp.1994.1014 [DOI] [PubMed] [Google Scholar]
- Huttenlocher J, Newcombe N, & Vasilyeva M (1999). Spatial scaling in young children. Psychological Science, 10, 393–398. 10.1111/1467-9280.00175 [DOI] [Google Scholar]
- Huttenlocher J, Vasilyeva M, Newcombe N, & Duffy S (2008). Developing symbolic capacity one step at a time. Cognition, 106(1), 1–12. 10.1016/j.cognition.2006.12.006 [DOI] [PubMed] [Google Scholar]
- Jeong Y, Levine SC, & Huttenlocher J (2007). The development of proportional reasoning: Effect of continous versus discrete quantities. Journal of Cognition and Development, 8, 237–256. 10.1080/15248370701202471 [DOI] [Google Scholar]
- Kim D, & Opfer JE (2017). A unified framework for bounded and unbounded numerical estimation. Developmental Psychology, 53, 1088–1097. 10.1037/dev0000305 [DOI] [PubMed] [Google Scholar]
- Kucian K, Grond U, Rotzer S, Henzi B, Schönmann C, Plangger F, . . . von Aster M (2011). Mental number line training in children with developmental dyscalculia. NeuroImage, 57, 782–795. 10.1016/J.NEUROIMAGE.2011.01.070 [DOI] [PubMed] [Google Scholar]
- Landy D, Charlesworth A, & Ottmar E (2014). Cutting in line: Discontinuities in the use of large numbers by adults. Proceedings of the Cognitive Science Society. Retrieved from https://escholarship.org/uc/item/7tb2h41q [Google Scholar]
- Landy D, Charlesworth A, & Ottmar E (2016). Categories of large numbers in line estimation. Cognitive Science, 41, 326–353. 10.1111/cogs.12342 [DOI] [PubMed] [Google Scholar]
- Laski EV, & Siegler RS (2007). Is 27 a big number? Correlational and causal connections among numerical categorization, number line estimation, and numerical magnitude comparison. Child Development, 78, 1723–1743. 10.1111/j.1467-8624.2007.01087.x [DOI] [PubMed] [Google Scholar]
- Leibovich T, Katzin N, Harel M, & Henik A (2017). From “sense of number” to “sense of magnitude:” The role of continuous magnitudes in numerical cognition. Behavioral and Brain Sciences, 40, e164. 10.1017/S0140525X16000960 [DOI] [PubMed] [Google Scholar]
- Lenth R, Singmann H, Love J, Buerkner P, & Herve M (2019). Package “emmeans”: Estimated marginal means, aka least-squares means. The Comprehensive R Archive Network, 1–67. [Google Scholar]
- Leroux G, Spiess J, Zago L, Rossi S, Lubin A, Turbelin M-R, . . . Joliot M (2009). Adult brains don’t fully overcome biases that lead to incorrect performance during cognitive development: An fMRI study in young adults completing a Piaget-like task. Developmental Science, 12, 326–338. 10.1111/j.1467-7687.2008.00785.x [DOI] [PubMed] [Google Scholar]
- Libertus ME, Feigenson L, & Halberda J (2013). Is approximate number precision a stable predictor of math ability? Learning and Individual Differences, 25, 126–133. 10.1016/J.LINDIF.2013.02.001 [DOI] [PMC free article] [PubMed] [Google Scholar]
- Link T, Moeller K, Huber S, Fischer U, & Nuerk H-C (2013). Walk the number line—An embodied training of numerical concepts. Trends in Neuroscience and Education, 2, 74–84. 10.1016/J.TINE.2013.06.005 [DOI] [Google Scholar]
- Mazzocco MMM, Feigenson L, & Halberda J (2011). Impaired acuity of the approximate number system underlies mathematical learning disability (dyscalculia). Child Development, 82, 1224–1237. 10.1111/j.1467-8624.2011.01608.x [DOI] [PMC free article] [PubMed] [Google Scholar]
- Meier BP, & Robinson MD (2004). Why the sunny side is up: association between affect and vertical position. Psychological Science, 15, 243–247. 10.1111/j.0956-7976.2004.00659.x [DOI] [PubMed] [Google Scholar]
- Mix KS, Levine SC, & Newcombe NS (2016). Development of quantitative thinking across correlated dimensions.In Henik A (Ed.), Continuous issues in numerical cognition: how many or how much (pp. 1–33).New York, NY: Academic Press. 10.1016/B978-0-12-801637-4.00001-9 [DOI] [Google Scholar]
- Newcombe N, Huttenlocher J, & Learmonth A (1999). Infants’ coding of location in continuous space. Infant Behavior and Development, 22, 483–510. 10.1016/S0163-6383(00)00011-4 [DOI] [Google Scholar]
- Newcombe NS, Levine SC, & Mix KS (2015). Thinking about quantity: the intertwined development of spatial and numerical cognition. Wiley Interdisciplinary Reviews: Cognitive Science, 6, 491–505. 10.1002/wcs.1369 [DOI] [PubMed] [Google Scholar]
- Núñez R, Cooperrider K, & Wassmann J (2012). Number concepts without number lines in an indigenous group of papua new guinea. PLoS ONE, 7, e35662. 10.1371/journal.pone.0035662 [DOI] [PMC free article] [PubMed] [Google Scholar]
- Opfer JE, Siegler RS, & Young CJ (2011). The powers of noise-fitting: reply to Barth and Paladino. Developmental Science, 14, 1194–1204. 10.1111/j.1467-7687.2011.01070.x [DOI] [PubMed] [Google Scholar]
- Opfer JE, Thompson CA, & Kim D (2016). Free versus anchored numerical estimation: A unified approach. Cognition, 149, 11–17. 10.1016/J.COGNITION.2015.11.015 [DOI] [PubMed] [Google Scholar]
- Pinheiro JC, & Bates DM (2000). Linear mixed-effects models: basic concepts and examples. Mixed-effects models in S and S-Plus, 3–56. [Google Scholar]
- Plumert JM, Hund AM, & Recker KM (2007). Organism-environment interaction in spatial development. In Plumert JM and Spencer JP (Eds.), The emerging spatial mind (pp. 25–52). New York, NY: Oxford University Press. 10.1093/acprof:oso/9780195189223.003.0002 [DOI] [Google Scholar]
- Prather RW (2012). Connecting neural coding to number cognition: A computational account. Developmental Science, 15, 589–600. 10.1111/j.1467-7687.2012.01156.x [DOI] [PMC free article] [PubMed] [Google Scholar]
- Quinn PC, Norris CM, Pasko RN, Schmader TM, & Mash C (1999). Formation of a categorical representation for the spatial relation between by 6- to 7-month-old infants. Visual Cognition, 6, 569–585. 10.1080/135062899394948 [DOI] [Google Scholar]
- R Development Core Team. (2007). R: A language and environment for statistical computing. Vienna, Austria: R Foundation for Statistical Computing. [Google Scholar]
- Ramani GB, & Siegler RS (2008). Promoting broad and stable improvements in low-income children’s numerical knowledge through playing number board games. Child Development, 79, 375–394. 10.1111/j.1467-8624.2007.01131.x [DOI] [PubMed] [Google Scholar]
- Ramani GB, & Siegler RS (2011). Reducing the gap in numerical knowledge between low- and middle-income preschoolers. Journal of Applied Developmental Psychology, 32, 146–159. 10.1016/J.APPDEV.2011.02.005 [DOI] [Google Scholar]
- Rattermann MJ, & Gentner D (1998). More evidence for a relational shift in the development of analogy: Children’s performance on a causal-mapping task. Cognitive Development, 13, 453–478. 10.1016/S0885-2014(98)90003-X [DOI] [Google Scholar]
- Reeve RA, Paul JM, & Butterworth B (2015). Longitudinal changes in young children’s 0–100 to 0–1000 number-line error signatures. Frontiers in Psychology, 6, 647. 10.3389/fpsyg.2015.00647 [DOI] [PMC free article] [PubMed] [Google Scholar]
- Reinert RM, Huber S, Nuerk HC, & Moeller K (2015). Strategies in unbounded number line estimation? Evidence from eye-tracking. Cognitive Processing, 16, 359–363. 10.1007/s10339-015-0675-z [DOI] [PubMed] [Google Scholar]
- Restle F (1970). Speed of adding and comparing numbers. Journal of Experimental Psychology, 83(2, Pt. 1), 274–278. 10.1037/h0028573 [DOI] [Google Scholar]
- Rivera SM, Reiss AL, Eckert MA, & Menon V (2005). Developmental changes in mental arithmetic: Evidence for increased functional specialization in the left inferior parietal cortex. Cerebral Cortex, 15, 1779–1790. 10.1093/cercor/bhi055 [DOI] [PubMed] [Google Scholar]
- Rosenberg-Lee M, Barth M, & Menon V (2011). What difference does a year of schooling make?: Maturation of brain response and connectivity between 2nd and 3rd grades during arithmetic problem solving. NeuroImage, 57, 796–808. 10.1016/J.NEUROIMAGE.2011.05.013 [DOI] [PMC free article] [PubMed] [Google Scholar]
- Rouder JN, & Geary DC (2014). Children’s cognitive representation of the mathematical number line. Developmental Science, 17, 525–536. 10.1111/desc.12166 [DOI] [PMC free article] [PubMed] [Google Scholar]
- Sandberg EH, Huttenlocher J, & Newcombe N (1996). The devel-opment of hierarchical representation of two-dimensional space. Child Development, 67, 721– 10.2307/1131858. [DOI] [PubMed] [Google Scholar]
- Sasanguie D, De Smedt B, Defever E, & Reynvoet B (2012). Association between basic numerical abilities and mathematics achievement. British Journal of Developmental Psychology, 30, 344–357. 10.1111/j.2044-835X.2011.02048.x [DOI] [PubMed] [Google Scholar]
- Schneider M, Merz S, Stricker J, De Smedt B, Torbeyns J, Verschaffel L, & Luwel K (2018). Associations of number line estimation with mathematical competence: A meta-analysis. Child Development, 89, 1467–1484. 10.1111/cdev.13068 [DOI] [PubMed] [Google Scholar]
- Schubert TW (2005). Your highness: Vertical positions as perceptual symbols of power. Journal of Personality and Social Psychology, 89(1), 1–21. 10.1037/0022-3514.89.1.1 [DOI] [PubMed] [Google Scholar]
- Seron X, & Fayol M (1994). Number transcoding in children: A functional analysis. British Journal of Developmental Psychology, 12, 281–300. 10.1111/j.2044-835X.1994.tb00635.x [DOI] [Google Scholar]
- Siegler RS, & Opfer JE (2003). The development of numerical estimation: evidence for multiple representations of numerical quantity. Psychological Science, 14, 237–243. 10.1111/1467-9280.02438 [DOI] [PubMed] [Google Scholar]
- Siegler RS, & Ramani GB (2009). Playing linear number board games—But not circular ones—Improves low-income preschoolers’ numerical understanding. Journal of Educational Psychology, 101, 545–560. 10.1037/a0014239 [DOI] [Google Scholar]
- Singmann H, Bolker B, Westfall J, & Aust F (2015). afex: Analysis of factorial experiments. R package version 0.13–145. Retrieved from https://cran.r-project.org/web/packages/afex/index.html [Google Scholar]
- Slusser EB, Santiago RT, & Barth HC (2013). Developmental change in numerical estimation. Journal of Experimental Psychology. General, 142, 193–208. 10.1037/a0028560 [DOI] [PubMed] [Google Scholar]
- Sullivan JL, Juhasz BJ, Slattery TJ, & Barth HC (2011). Adults’ number-line estimation strategies: Evidence from eye movements. Psychonomic Bulletin and Review, 18, 557–563. 10.3758/s13423-011-0081-1 [DOI] [PMC free article] [PubMed] [Google Scholar]
- Thompson CA, & Opfer JE (2010). How 15 hundred is like 15 cherries: Effect of progressive alignment on representational changes in numerical cognition. Child Development, 81, 1768–1786. 10.1111/j.1467-8624.2010.01509.x [DOI] [PubMed] [Google Scholar]
- van’t Noordende JE, van Hoogmoed AH, Schot WD, & Kroesbergen EH (2016). Number line estimation strategies in children with mathematical learning difficulties measured by eye tracking. Psychological Research Psychologische Forschung, 80, 368–378. 10.1007/s00426-015-0736-z [DOI] [PMC free article] [PubMed] [Google Scholar]
- Vasilyeva M, & Lourenco SF (2012). Development of spatial cognition. Wiley Interdisciplinary Reviews: Cognitive Science, 3, 349–362. 10.1002/wcs.1171 [DOI] [PubMed] [Google Scholar]
- Watts TW, Duncan GJ, Siegler RS, & Davis-Kean PE (2014). What’s past is prologue: Relations between early mathematics knowledge and high school achievement. Educational Researcher, 43, 352–360. 10.3102/0013189X14553660 [DOI] [PMC free article] [PubMed] [Google Scholar]
- White SL, & Szucs D (2012). Representational change and strategy use in children’s number line estimation during the first years of primary school. Behavioral and Brain Functions, 8(1), 1. 10.1186/1744-9081-8-1 [DOI] [PMC free article] [PubMed] [Google Scholar]
Associated Data
This section collects any data citations, data availability statements, or supplementary materials included in this article.