Fig. 1.
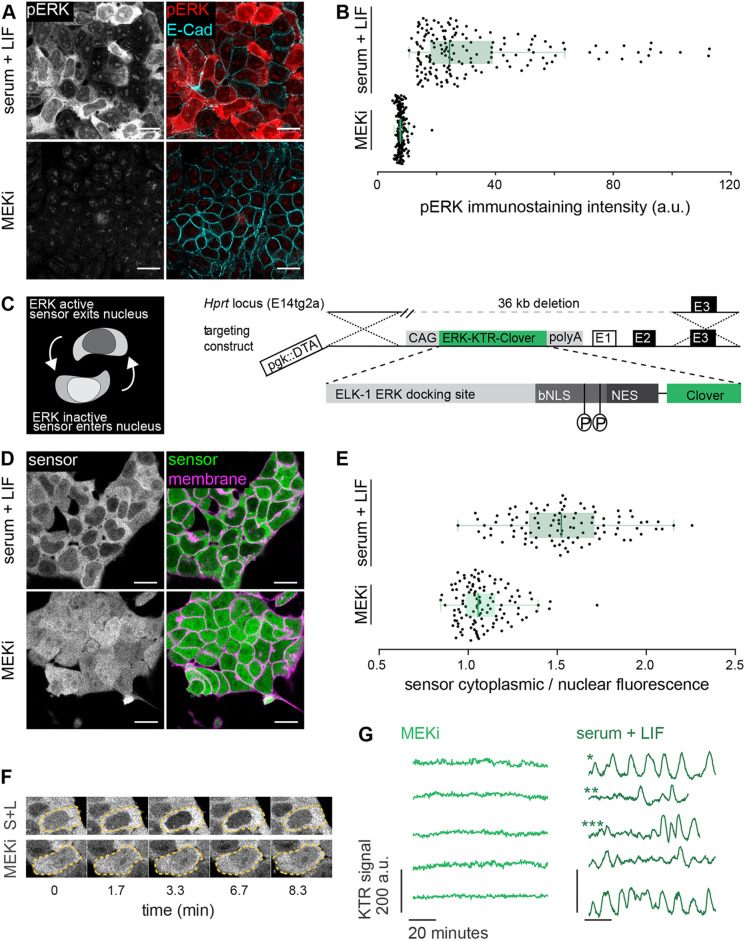
A targeted translocation sensor reveals pulsatile ERK activity in ESCs. (A) Immunostaining of mESCs growing in serum+LIF (S+L) medium without (top) or with (bottom) MEKi for pERK and E-cadherin to mark membranes. The punctate pERK staining within the nucleus is insensitive to MEK inhibition, suggesting it is non-specific. (B) Quantification of fluorescence staining intensities in single cells stained as in A. n≥100 per condition, green bars indicate medians (medianS+L=24.39 a.u., medianMEKi=7.75 a.u.; CVS+L=0.67, CVMEKi=0.17), box bounds are the 25 and 75 percentiles of the distributions, and whiskers are the 5 and 95 percentiles. (C) Schematic of the ERK-KTR sensor and targeting construct for integration into the Hprt locus. (D) Subcellular localization of ERK-KTR sensor in live cells in serum+LIF without (top) and with (bottom) MEKi. Membranes are stained with live-cell membrane dye CellMaskRed. (E) Quantification of cytoplasmic to nuclear ratio of sensor fluorescence in single cells imaged as in D. Green bars indicate medians (medianS+L=1.52, medianMEKi=1.05; CVS+L=0.18, CVMEKi=0.13), box bounds are the 25 and 75 percentiles of the distributions, and whiskers are the 5 and 95 percentiles. (F) Stills from a movie of ERK-KTR-expressing cells growing in serum+LIF without (top) and with (bottom) MEKi. Dashed line indicates cell outlines. (G) Representative traces of the KTR signal obtained as the mean inverted fluorescence intensity within a nuclear ROI in single cells growing in serum+LIF without (right) and with (left) MEKi. *, cell showing regular pulsing; ** cell showing isolated pulses; ***, cell showing transitions between non-pulsing and pulsing behavior. Scale bars: 20 μm.

