Abstract
A dual-channel optical coherence tomography system with wavelengths in the visible and near-infrared light ranges can provide both structural and functional information for retinal microvasculature simultaneously. We applied this integrated system in an ongoing clinical study of patients with various retinal pathologies. Here, we present case study results of patients with diabetic retinopathy, central retinal vein occlusion, and sickle cell retinopathy compared to a healthy subject. For the first time, this comparison validates the system’s ability to detect structural anomalies in both en face and B-scan images with simultaneous retinal optical coherence tomography angiography and measurement of sO2 in parafoveal vessels that are around 20–30 µm in diameter. This integrated system represents a powerful instrument with potentially far-reaching clinical implications for the early detection and diagnosis of retinal vascular diseases.
Keywords: Visible light optical coherence tomography, retinal oximetry, angiography
Impact statement
The diagnosis and management of retinal vascular diseases benefit from advanced ophthalmic imaging techniques. An integrated dual-channel visible light optical coherence tomography system can provide multifunctional information including optical coherence tomography angiography and microvascular blood oxygen saturation (sO2), so that both vascular structures and functions can be investigated. For the first time, we demonstrated this system in three types of retinal vasculopathies to showcase the feasibility and potential for diagnosis and fundamental understanding of the pathologies.
Introduction
Optical coherence tomography (OCT) has become an indispensable tool in ophthalmology since first being introduced in 1991. Its ability to non-invasively provide high-resolution 3D structural images has revolutionized the diagnosis and treatment of vitreoretinal diseases. 1 Numerous variant techniques based on OCT have been derived for specific diagnostic and functional measurements. Optical coherence tomography angiography (OCTA) and retinal oximetry with visible light optical coherence tomography (VIS-OCT) are examples of such emerging technologies which have attracted substantial interest recently.2–7 OCTA uses motion contrast caused by blood flow in consecutive B-scans to localize the retinal vessels.8,9 The technique offers a non-invasive alternative to conventional fluorescein angiography (FA) which requires intravenous injection of contrast dyes for vessel imaging. Additional benefits of OCTA over FA include its rapid image acquisition time and the ability to use 3D segmentation to image individual vascular plexuses throughout the thickness of the retina. 8 Unlike FA, however, OCTA is not able to visualize dye leakage, a sign of blood–retinal barrier breakdown common in many retinal diseases. Fundus-based dual-wavelength photography has been commercialized for retinal oximetry. 10 This technique uses differential absorption coefficients for oxygenated and deoxygenated hemoglobin between the two wavelengths to measure sO2. Despite its commercial availability, considerable drawbacks including inaccurate measurement of vessel diameter, blood cell scattering, and pigmentation absorption limit its clinical value. 11 Additionally, as fundus photography is a 2D imaging modality, it lacks the axial resolution needed to isolate individual capillary plexuses.
VIS-OCT, on the other hand, provides 3D volumetric imaging. 7 By using shorter wavelength light in the visible range, it provides refined axial resolution compared to NIR OCT.12,13 The distinct absorption spectra of oxy- and deoxyhemoglobin for light in the visible wavelengths allows quantification of sO2.14–16 Although retinal oximetry using VIS-OCT is still in the early-stages of investigation, it has shown great promise.
We designed a multifunctional optical coherence tomography (mfOCT) to meet clinical imaging demands that would be challenging with single wavelength OCT devices. 17 The mfOCT is an integrated, dual-channel OCT device capable of providing structural images with both NIR and visible light wavelengths, retinal microvascular oximetry measurements with VIS-OCT, and mapping of the retinal capillary network with NIR OCTA. We are currently testing this imaging modality in several clinical studies focused on various retinal pathologies. Here, we demonstrate the capability of the mfOCT device to provide angiography, sO2, and structural images by comparing a normal eye to the eyes of patients with diabetic retinopathy (DR), central retinal vein occlusion (CRVO), and sickle cell retinopathy (SCR).
Materials and methods
Several clinical studies aiming to evaluate the use of the dual-channel OCT system and investigate the accuracy of sO2 calculations as a principal biomarker for ischemic retinal pathologies are currently being conducted. This study received approval from the Institutional Review Board of Boston University School of Medicine and adhered to the tenets of the Declaration of Helsinki and complies with the Health Insurance Portability and Accountability Act. Subjects with retinal vascular disease were screened for eligibility using clinical data gathered from standard-of-care (SOC) examinations with pupillary dilation by retinal specialists at Boston Medical Center and recruited following an informed consent conversation explaining the purpose of the research. A healthy subject with no retinal disease was recruited as a control to compare with the pathological cases.
Imaging protocol and OCT image processing
Our previous publications illustrate the setup of the dual-channel OCT system and scanning patterns.15,18 The power of incident light in the visible and NIR bands are 0.25 and 0.9 mw, respectively, which are below the established American National Standards Institute (ANSI) threshold. We scanned the macular area of 2.5 mm × 2.5 mm for 400 × 320-pixel density. The A-line rate was 100 kHz with an exposure time of 9.1 µs. We repeated the scanning at the same B-scan location three times for 12 ms before moving to the next. It took 3.84 s to complete the whole scanning process.
After completing the acquisition of the raw signals, the datasets in both bands were processed by removal of DC spectrum, k space resampling, and dispersion compensation. 19 We averaged the repeated 3 (N) frames to generate the structural datasets of VIS-OCT and NIR-OCT.
| (1) |
| (2) |
where and were the complex signals from the Vis and NIR bands after Fourier Transform to form the B-scans.
For NIR OCTA, we used split spectrum method 9 to generate complex B-scans, and two adjacent frames in the same slow scan location produced the one B-scan frame of angiography contrast. Finally, two angiographic B-scans were averaged into one OCTA frame.
| (3) |
Segmentation and sO2 calculation
After obtaining OCT and OCTA images, we performed segmentation to present en face projection, and for sO2 calculation within blood vessels. Using the stronger signal of each A-line in NIR-OCT, we first segmented the retinal pigment epithelium (RPE) by detecting the location of maximum intensities and sequentially found the location of maximum intensity gradient in the area above the RPE for internal limiting membrane (ILM). We refined the segmentation by outlier detection and removal and curve fitting. 20 With the known RPE segmentation in each B-scan frame, we can calculate the coefficient of variation (COV) for the RPE depth. This COV value would vary significantly in certain frames due to the RPE segmentation failure. We applied the same outlier detection on the COV among all frames to detect segmentation failure 20 and replaced the segmentation with the one in the nearest frame. After the segmentation for ILM and RPE, we interpolated the depth dimension in VIS-OCT to have the same depth scale as NIR-OCT, so that the segmentation can be applied to both channels with a shift.
The en face images of NIR-OCT angiography were created by the maximum intensity projection (MIP) in the most superficial 90 pixels of the inner retina. The A-line signals in the full thickness retina between the RPE and ILM were averaged to make the en face images of VIS-OCT. An adaptive threshold was used to binarize the en face image to find the whole vessel mask. 21 Then, we manually chose the parafoveal vessels within the region of interest (ROI) for later processing.
In order to calculate sO2, the short-time Fourier transform (STFT) with 11 Gaussian windows swept the whole 3D volume of Vis-OCT to generate 4D data. Normalization of spectra was done by dividing the averaged signals of non-vascular parts in the nerve fiber layer (NFL) in each window.4,22 The spectra in terms of depth I ( ) was obtained by averaging all the signals within in ROI vessels of 4D data, then was averaged within a depth range of 5 pixel above and 10 pixel below at the vessel bottom. This averaged spectra was used to calculate the sO2 of targeted vessels using a least square fitting. 15
| (4) |
where is the spectrum of light sources; is the reflectance of reference arm which is assumed to be constant; (dimensionless) is the reflectance at the vessel wall modelled by a power law , with A being a dimensionless constant and modelling the decaying scattering spectrum from the vessel wall. The optical attenuation coefficient is determined by the coefficients of absorption and scattering .
| (5) |
where W is a scaling factor for the scattering coefficient which was 0.2 used here; 16 Hb and HbO2 denote the contribution from the deoxygenated and oxygenated blood, respectively; z denotes the light-penetration length through vessels. We can transform the equation (4) to (5), then performed a least square fitting to calculate the sO2.
| (6) |
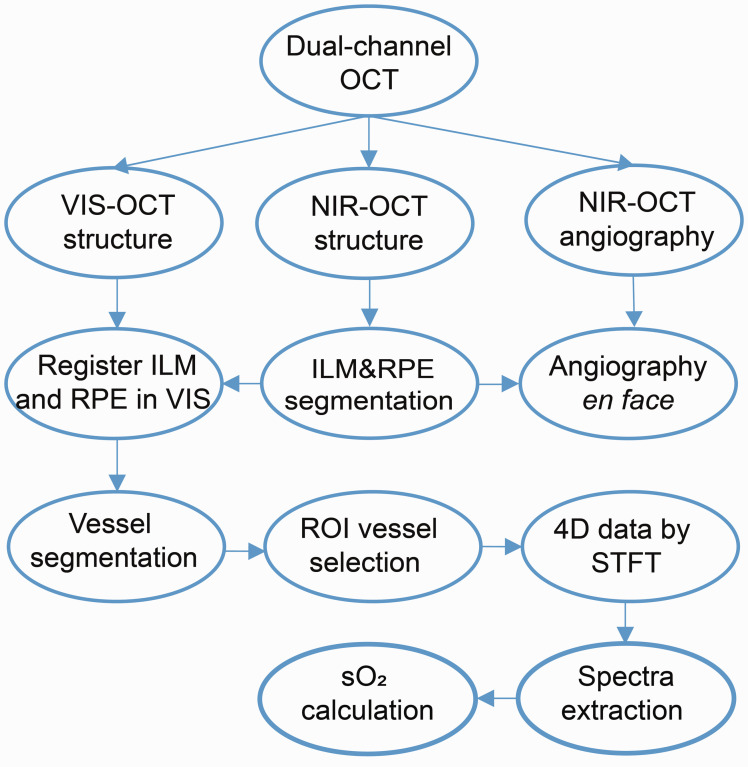
The general procedures can be seen in Figure 1. We processed the datasets for one eye each of a healthy subject and patients with DR, CRVO, and SCR, obtaining functional OCTA and sO2 data and structural NIR-OCT and VIS-OCT images.
Figure 1.
Data processing of dual-channel OCT. (A color version of this figure is available in the online journal.) ILM: internal limiting membrane; RPE: retinal pigment epithelium; ROI: region of interest; STFT: short-time Fourier transform.
Results
We used the dual-channel OCT system to compare healthy and diseased eyes. Representative examples of the findings from these studies are showcased in Figures 2 to 5.
Figure 2.
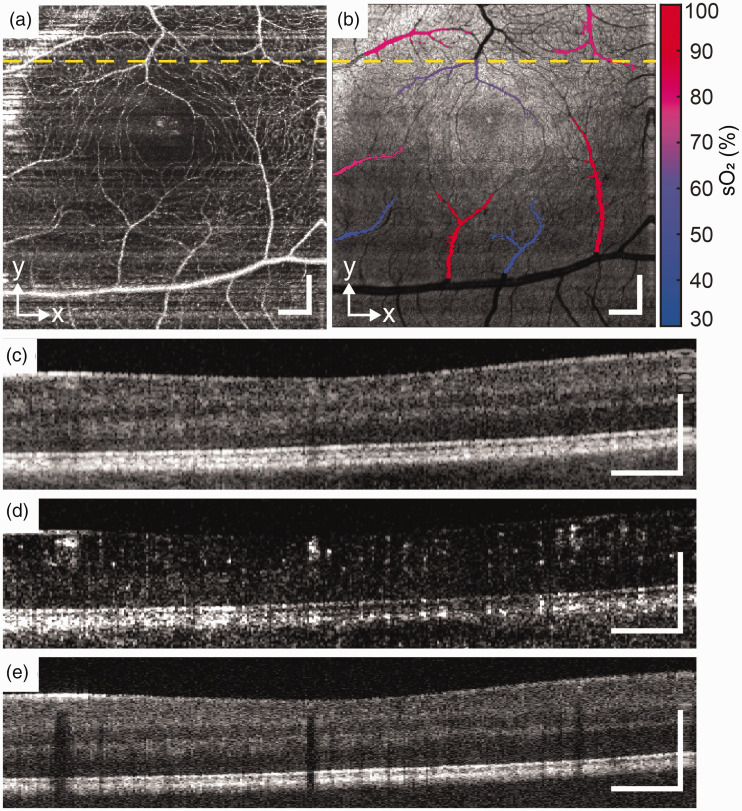
Healthy subject. (a) and (b) En face images of OCTA and VIS-OCT. (c), (d) and (e) B-scans of NIR-OCT, OCTA, and VIS-OCT from the location of yellow dash line. Scale bar: 200 µm. (A color version of this figure is available in the online journal.)
Figure 3.
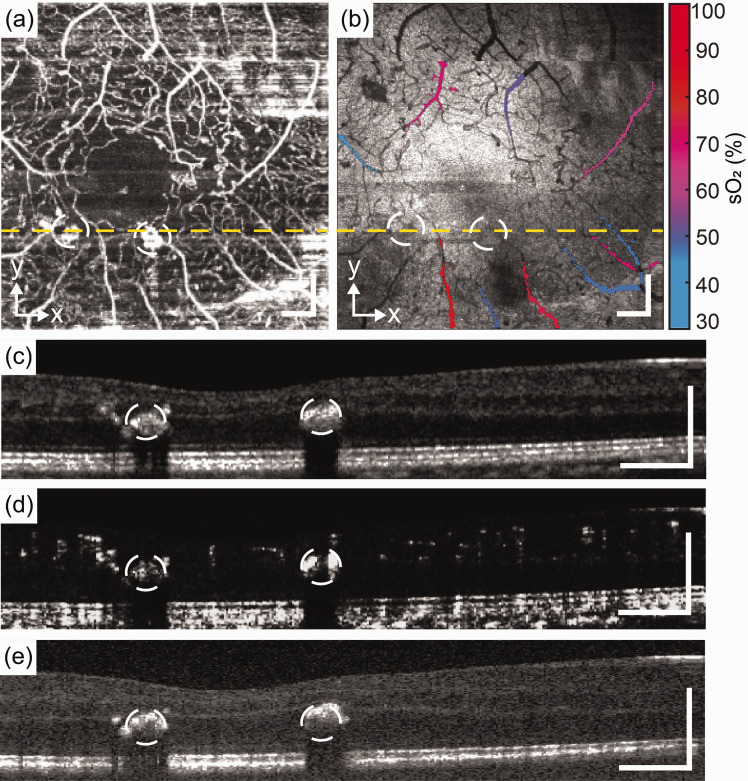
Patient with moderate NPDR without macular edema. (a) and (b) En face images of OCTA and VIS-OCT. (c), (d) and (e) B-scans of NIR-OCT, OCTA, and VIS-OCT from the location of yellow dash line. Scale bar: 200 µm. (A color version of this figure is available in the online journal.)
Figure 4.
CRVO patient. (a) and (b) En face images of OCTA and VIS-OCT. (c), (d) and (e) B-scan of NIR-OCT, OCTA, and VIS-OCT from the location of yellow dash line. Scale bar: 200 µm. (A color version of this figure is available in the online journal.)
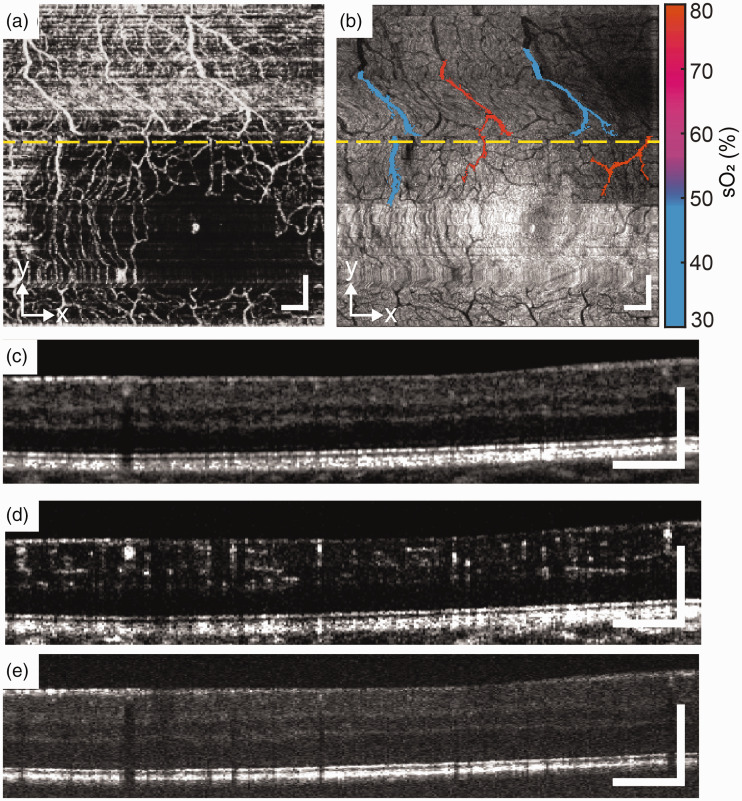
Figure 5.
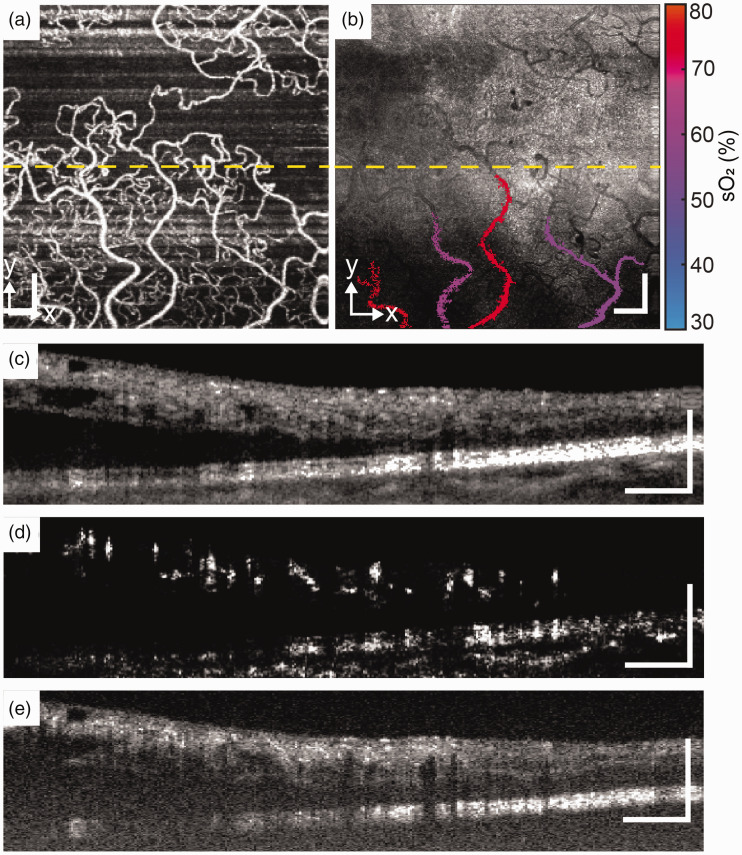
SCR patient. (a) and (b) En face images of OCTA and VIS-OCT. (c), (d) and (e) B-scan of NIR-OCT, OCTA, and VIS-OCT from the location of yellow dash line. Scale bar: 200 µm. (A color version of this figure is available in the online journal.)
The en face images of OCTA and VIS-OCT were used to identify comparable vasculature of the larger vessels. The OCTA algorithm allowed visualization of the retinal capillary network showing reduced capillary density in patients with retinopathy of all three cases when compared to the healthy subject eye. While the NIR-OCT can penetrate the retina to the level of the choroid, the high light attenuation of VIS-OCT makes it difficult to image tissues below the RPE. Consequently, vessel shadows in the VIS-OCT were more distinguishable. The stratified retinal anatomies were clearly represented in both bands.
Figure 2 shows the result from a healthy subject. The right eye of 29-year-old female with no known past ocular history and no history of cardiovascular disease, hematologic disease, or diabetes mellitus was imaged. Best corrected visual acuity was 20/20. The en face OCTA and VIS-OCT demonstrated a regular foveal avascular zone (FAZ) with an alternating pattern of arterioles and venules in the parafoveal macula (Figure 2(a) and (b)). Note the prominent shadowing deep to the retinal vessels caused by light absorption in the VIS-OCT images (Figure 2(e)). The mean sO2 of arterioles (n = 5) and venules (n = 3) were 82.6 ± 6.2% and 52.6 ± 9.7%.
Figure 3 are images taken from the left eye of a 29-year-old male with clinical diagnosis of moderate non-proliferative diabetic retinopathy without macular edema and visual acuity of 20/20. The subject’s medical history includes Type 1 diabetes mellitus of 21 year duration as well as hyperopia with astigmatism. The en face OCTA and Vis-OCT images show mild irregularity of the FAZ, telangiectasia of the capillaries with decreased capillary density, and microaneurysms (white circles). The microaneurysms result in significant shadowing in both NIR- and VIS-OCT B scans. Differing signal intensity within the aneurysms as seen on both en face and transverse B scan OCTA images may represent variations in blood flow within the vessel irregularities. 23 The mean sO2 of arterioles (n = 5) and venules (n = 4) were calculated 71.2 ± 8.7% and 47.4 ± 3.6%.
Figure 4 shows the results from a CRVO patient. Right eye of 58-year-old female with clinical diagnosis of central retinal vein occlusion with macular edema and best corrected visual acuity of 20/60 was imaged. The subject’s ophthalmic history includes central retinal vein occlusion with macular edema, epiretinal membranes, nuclear cataracts, and suspicion of glaucoma of both eyes. The borders of the FAZ are indistinguishable, and there is a vessel crossing the horizontal midline indicative of collateral vessel formation. Both the en face OCTA and transverse VIS-OCT images show reduced image quality potentially due to macular edema and subretinal fluid visible in the NIR-OCT transverse B scans. The choroid is visible in the NIR-OCT but not the VIS-OCT images. Two arterioles and two venules were selected, the sO2 of arterioles were 76.6% and 75.0%, and 61.2% and 57.5% for venules.
Figure 5 shows the results from an SCR patient. Images were taken from left eye of 46-year-old male with clinical diagnosis of non-proliferative sickle cell retinopathy and best corrected visual acuity of 20/20. The subject’s medical history includes sickle cell disease with a history of crisis (last 2017), age-related nuclear cataracts, iridodialysis, and myopia with astigmatism of both eyes. En face OCTA images show decreased capillary density and an irregular, enlarged FAZ, although image quality is limited by motion artifact. The normal retinal layers and RPE are well visualized in both the NIR- and VIS-OCT B scan images without apparent thinning. The mean sO2 of venules (n = 3) were 46.8 ± 2.4%, and the sO2 of two selected arterioles were 77.2% and 78.5%.
Discussion
The dual-channel OCT system with integrated functions of angiography and retinal oximetry was developed for the purpose of identifying markers of common retinal pathologies. The utility of this device is under ongoing investigation in several clinical trials.
The use of a simultaneous, dual-channel system offers several advantages when compared to NIR- or VIS-OCT alone. Segmentation can be challenging for VIS-OCT for pathological retinas. We found that missing VIS-OCT signals in either the RPE or ILM were often, especially for subjects with significant macular edema. The simultaneous NIR-OCT is helpful in segmentation of the ILM and RPE, and when used in conjunction with en face images in VIS-OCT, allows us to obtain images with maximal contrast between vascular and non-vascular tissues by averaging the signals near the RPE. Thus, this dual-channel OCT system facilitates segmentation compared to the single band VIS-OCT. In addition, we used NIR-OCT for the initial eye alignment when imaging to avoid the excessive visible light exposure. Because two channels are coaligned with our fiber optics design, the NIR-OCT initial alignment greatly facilitates the focus fine tuning with VIS-OCT on retina. This approach greatly improved our imaging yield for pathological cases and aged eyes.
Additionally, the dual-channel system provides functional information including angiography and sO2. The NIR OCTA images demonstrate the densities and distributions of vascular plexuses in different depths which can be affected by the ocular diseases, which is compatible to most of the findings by the existing clinical devices. In the DR case, the hyper-reflective microaneurysms can be precisely located and in the SCR case, enlargement of the FAZ may represent pre-clinical vascular alteration that could precede visual impairment. 24 OCTA can be used to locate the vessel signals in VIS-OCT and especially to locate vessel bottoms, a crucial step for retinal oximetry with VIS-OCT. 15
As this technology is quite new, we do not yet have enough clinical data to precisely interpret the sO2 results in our individual patients. In each of the ischemic retinal diseases imaged, however, the arteriolar sO2 was consistently decreased compared to the healthy control. While this case series demonstrates significant alterations in retinal oximetry when comparing a healthy eye to several retinal pathologies, additional work is needed to verify and elucidate the importance of these findings. Our findings, which measure sO2 in the smaller parafoveal vessels with diameter around 20–30 µm, cannot necessarily be compared directly to previously published data relying on fundus-based dual-wavelength imaging that focuses on the larger vessels near the optic nerve head. 25
We found several limitations to image quality when using the VIS-OCT. To minimize acquisition time and reduce patient discomfort caused by visible light, we used a 100 kHz scan rate to acquire the images. However, the short exposure time resulted in a relatively weak signal and low contrast. Scattering of visible light through the cornea and aging cataractous lens can also decrease transmittance and impact posterior segment imaging quality. 26 Due to attenuation of visible light in retinal tissues and RPE, the choroid was difficult to image in VIS-OCT, but the simultaneous NIR-OCT can supplement this information.
Conclusions
We tested the dual-channel OCT system by comparing a healthy subject eye to subjects with DR, CRVO, and SCR taken from ongoing clinical trials testing the device. We demonstrated the ability of this system to provide functional (angiography and sO2) and structural information of NIR-OCT and VIS-OCT. Although the clinical application of this technology is not without its limitations, it shows great promise as an avenue of approach for multifunctional, non-invasive, diagnostic imaging. Functional information provided by this system can potentially be used in the early detection and diagnosis of retinal pathologies, especially those ischemic in nature. The ultimate goal is to deploy this system in the clinical setting, contributing to the diagnostic capability of medical doctors by virtue of non-invasive detection of key markers of pathological processes within the retina.
Footnotes
AUTHORS’ CONTRIBUTIONS: JY supervised this project. JW, SN, and JY analyzed the results. AB performed the experiments and collected data. JW, AB, SN, JY, MLS, and XC contributed the article. SN, MS, NS, and XC assisted in subject screening and recruitment.
DECLARATION OF CONFLICTING INTERESTS: The author(s) declared no potential conflicts of interest with respect to the research, authorship, and/or publication of this article.
FUNDING: The author(s) disclosed receipt of the following financial support for the research, authorship, and/or publication of this article: This work was supported by a NIH grant (R01NS108464).
ORCID iD: Jingyu Wang https://orcid.org/0000-0002-1614-4426
References
- 1.Huang D, Swanson EA, Lin CP, Schuman JS, Stinson WG, Chang W, Hee MR, Flotte T, Gregory K, Puliafito CA. Optical coherence tomography. Science 1991; 254:1178–81 [DOI] [PMC free article] [PubMed] [Google Scholar]
- 2.Jia Y, Bailey ST, Wilson DJ, Tan O, Klein ML, Flaxel CJ, Potsaid B, Liu JJ, Lu CD, Kraus MF. Quantitative optical coherence tomography angiography of choroidal neovascularization in age-related macular degeneration. Ophthalmology 2014; 121:1435–44 [DOI] [PMC free article] [PubMed] [Google Scholar]
- 3.Dadkhah A, Paudel D, Jiao S. Comparative study of optical coherence tomography angiography algorithms for rodent retinal imaging. Exp Biol Med (Maywood) 2021; 246:2207–13 [DOI] [PMC free article] [PubMed] [Google Scholar]
- 4.Chong SP, Bernucci M, Radhakrishnan H, Srinivasan VJ. Structural and functional human retinal imaging with a fiber-based visible light OCT ophthalmoscope. Biomed Opt Express 2017; 8:323–37 [DOI] [PMC free article] [PubMed] [Google Scholar]
- 5.Yi J, Chen S, Shu X, Fawzi AA, Zhang HF. Human retinal imaging using visible-light optical coherence tomography guided by scanning laser ophthalmoscopy. Biomed Opt Express 2015; 6:3701–13 [DOI] [PMC free article] [PubMed] [Google Scholar]
- 6.Pi S, Hormel TT, Wei X, Cepurna W, Wang B, Morrison JC, Jia Y. Retinal capillary oximetry with visible light optical coherence tomography. Proc Natl Acad Sci USA 2020; 117:11658–66 [DOI] [PMC free article] [PubMed] [Google Scholar]
- 7.Shu X, Beckmann LJ, Zhang HF. Visible-light optical coherence tomography: a review. J Biomed Opt 2017; 22:121707. [DOI] [PMC free article] [PubMed] [Google Scholar]
- 8.Kashani AH, Chen C-L, Gahm JK, Zheng F, Richter GM, Rosenfeld PJ, Shi Y, Wang RK. Optical coherence tomography angiography: a comprehensive review of current methods and clinical applications. Prog Retin Eye Res 2017; 60:66–100 [DOI] [PMC free article] [PubMed] [Google Scholar]
- 9.Jia Y, Tan O, Tokayer J, Potsaid B, Wang Y, Liu JJ, Kraus MF, Subhash H, Fujimoto JG, Hornegger J. Split-spectrum amplitude-decorrelation angiography with optical coherence tomography. Opt Express 2012; 20:4710–25 [DOI] [PMC free article] [PubMed] [Google Scholar]
- 10.Hardarson SH, Harris A, Karlsson RA, Halldorsson GH, Kagemann L, Rechtman E, Zoega GM, Eysteinsson T, Benediktsson JA, Thorsteinsson A. Automatic retinal oximetry. Invest Ophthalmol Vis Sci 2006; 47:5011–6 [DOI] [PubMed] [Google Scholar]
- 11.Garg AK, Knight D, Lando L, Chao DL. Advances in retinal oximetry. Transl Vis Sci Technol 2021; 10:5. [DOI] [PMC free article] [PubMed] [Google Scholar]
- 12.Rubinoff I, Beckmann L, Wang Y, Fawzi AA, Liu X, Tauber J, Jones K, Ishikawa H, Schuman JS, Kuranov R. Speckle reduction in visible-light optical coherence tomography using scan modulation. Neurophotonics 2019; 6:041107. [DOI] [PMC free article] [PubMed] [Google Scholar]
- 13.Chong SP, Zhang T, Kho A, Bernucci MT, Dubra A, Srinivasan VJ. Ultrahigh resolution retinal imaging by visible light OCT with longitudinal achromatization. Biomed Opt Express 2018; 9:1477–91 [DOI] [PMC free article] [PubMed] [Google Scholar]
- 14.Chen S, Shu X, Nesper PL, Liu W, Fawzi AA, Zhang HF. Retinal oximetry in humans using visible-light optical coherence tomography. Biomed Opt Express 2017; 8:1415–29 [DOI] [PMC free article] [PubMed] [Google Scholar]
- 15.Song W, Shao W, Yi W, Liu R, Desai M, Ness S, Yi J. Visible light optical coherence tomography angiography (vis-OCTA) facilitates local microvascular oximetry in the human retina. Biomed Opt Express 2020; 11:4037–51 [DOI] [PMC free article] [PubMed] [Google Scholar]
- 16.Yi J, Wei Q, Liu W, Backman V, Zhang HF. Visible-light optical coherence tomography for retinal oximetry. Opt Lett 2013; 38:1796–98 [DOI] [PMC free article] [PubMed] [Google Scholar]
- 17.Song W, Zhou L, Zhang S, Ness S, Desai M, Yi J. Fiber-based visible and near infrared optical coherence tomography (vnOCT) enables quantitative elastic light scattering spectroscopy in human retina. Biomed Opt Express 2018; 9:3464–80 [DOI] [PMC free article] [PubMed] [Google Scholar]
- 18.Song W, Fu S, Song S, Zhang S, Zhang L, Ness S, Desai M, Yi J. Longitudinal detection of retinal alterations by visible and near-infrared optical coherence tomography in a dexamethasone-induced ocular hypertension mouse model. Neurophotonics 2019; 6:041103. [DOI] [PMC free article] [PubMed] [Google Scholar]
- 19.Wojtkowski M, Srinivasan VJ, Ko TH, Fujimoto JG, Kowalczyk A, Duker JS. Ultrahigh-resolution, high-speed, Fourier domain optical coherence tomography and methods for dispersion compensation. Opt Express 2004; 12:2404–22 [DOI] [PubMed] [Google Scholar]
- 20.Zhang X, Yousefi S, An L, Wang RK. Automated segmentation of intramacular layers in Fourier domain optical coherence tomography structural images from normal subjects. J Biomed Opt 2012; 17:046011. [DOI] [PMC free article] [PubMed] [Google Scholar]
- 21.Bradley D, Roth G. Adaptive thresholding using the integral image. J Graph Tools 2007; 12:13–21 [Google Scholar]
- 22.Chong SP, Merkle CW, Leahy C, Radhakrishnan H, Srinivasan VJ. Quantitative microvascular hemoglobin mapping using visible light spectroscopic optical coherence tomography. Biomed Opt Express 2015; 6:1429–50 [DOI] [PMC free article] [PubMed] [Google Scholar]
- 23.Ishibazawa A, Nagaoka T, Takahashi A, Omae T, Tani T, Sogawa K, Yokota H, Yoshida A. Optical coherence tomography angiography in diabetic retinopathy: a prospective pilot study. Am J Ophthalmol 2015; 160:35–44 e1 [DOI] [PubMed] [Google Scholar]
- 24.Ong SS, Linz MO, Li X, Liu TA, Han IC, Scott AW. Retinal thickness and microvascular changes in children with sickle cell disease evaluated by optical coherence tomography (OCT) and OCT angiography. Am J Ophthalmol 2020; 209:88–98 [DOI] [PubMed] [Google Scholar]
- 25.Stefánsson E, Olafsdottir OB, Eliasdottir TS, Vehmeijer W, Einarsdottir AB, Bek T, Torp TL, Grauslund J, Eysteinsson T, Karlsson RA. Retinal oximetry: metabolic imaging for diseases of the retina and brain. Prog Retin Eye Res 2019; 70:1–22 [DOI] [PubMed] [Google Scholar]
- 26.Shu X, Beckmann L, Wang Y, Rubinoff I, Lucy K, Ishikawa H, Wollstein G, Fawzi AA, Schuman JS, Kuranov RV. Designing visible-light optical coherence tomography towards clinics. Quant Imaging Med Surg 2019; 9:769. [DOI] [PMC free article] [PubMed] [Google Scholar]


