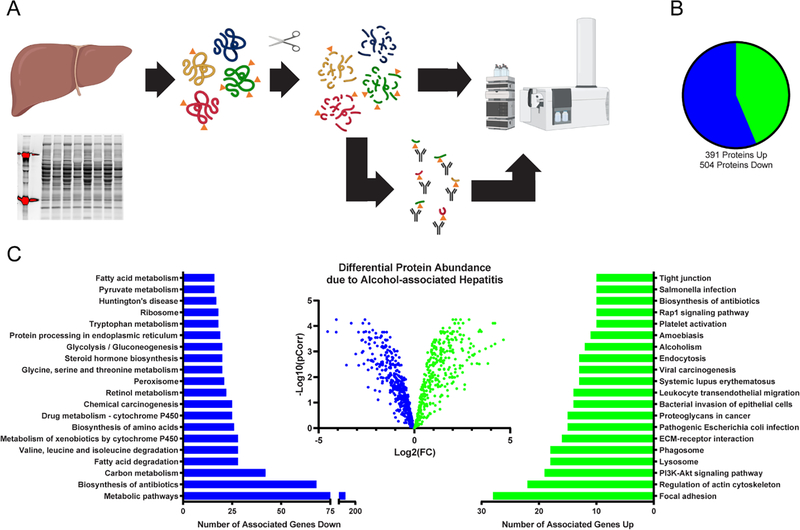
Figure 1. Proteomic analysis of hepatic tissue from normal and alcohol-associated hepatitis explants.
(A) Schematic of general protein quantitation and acetylation quantitation by mass spectrometry. Normal, n=5; AH, n=4. (B) The pie graph depicts the number of proteins identified to be significantly changed in AH by protein quantitation. (C) The volcano plot represents the individual proteins found to be altered in the alcohol-associated hepatitis samples. The number of associated genes that are significantly changed in a particular pathway is detailed in the bar charts.

