Abstract
Objectives:
(1) To quantitatively characterize human enamel porosity and surface area in vitro before and after etching for variable etching times; and (2) to evaluate shear bond strength after variable etching times. Specifically, our goal was to identify the presence of any correlation between enamel porosity and shear bond strength.
Materials and Methods:
Pore surface area, pore volume, and pore size of enamel from extracted human teeth were analyzed by Brunauer-Emmett-Teller (BET) gas adsorption before and after etching for 15, 30, and 60 seconds with 37% phosphoric acid. Orthodontic brackets were bonded with Transbond to the samples with variable etch times and were subsequently applied to a single-plane lap shear testing system.
Results:
Pore volume and surface area increased after etching for 15 and 30 seconds. At 60 seconds, this increase was less pronounced. On the contrary, pore size appears to decrease after etching. No correlation was found between variable etching times and shear strength. Samples etched for 15, 30, and 60 seconds all demonstrated clinically viable shear strength values.
Conclusions:
The BET adsorption method could be a valuable tool in enhancing our understanding of enamel characteristics. Our findings indicate that distinct quantitative changes in enamel pore architecture are evident after etching. Further testing with a larger sample size would have to be carried out for more definitive conclusions to be made.
Keywords: Dental enamel, Porosity, Etching, Shear strength
INTRODUCTION
The introduction of composites and of the acid-etch technique1 has fundamentally changed the approach to clinical practice in orthodontics. Introduced by Buonocore in 1955, phosphoric acid treatment applied to the enamel surface creates a porous surface layer that, when penetrated by a low-viscosity resin-bonding agent, facilitates interlocking between composite resin and enamel. This enamel-to-composite interface is a critical factor that enables brackets to be bonded to the tooth surface.
Current clinical techniques use 37% phosphoric acid for 30 seconds,1 resulting in five types of demineralization patterns in human dental enamel.2 Porosity, surface area, and related bonding characteristics of these different patterns are not completely understood, and it is often assumed that a clinical “frosty” appearance provides sufficient evidence that the etched surface is adequately prepared for bonding.
Much research has been devoted to characterization of the physical and chemical properties of etched enamel.3–8 Historically, scanning electron microscopy (SEM) has been considered the gold standard in the study of surface topography6–8; however, the qualitative nature of the data makes comparisons among studies difficult.
The Brunauer-Emmett-Teller (BET) gas adsorption method has demonstrated the potential in a limited number of studies9,10 to provide quantifiable data on topographic enamel properties such as surface area and porosity. This method, described by Brunauer et al.11 in 1938, determines the surface area of materials via absorption of gases in multimolecular layers. Since that time, the BET gas adsorption method has become the most widely used standard procedure for the determination of surface areas of finely divided and porous materials.12 The small size of the krypton gas molecule used in the BET method, with a diameter of only 3.8 angstroms, is ideal for gaining easy access to the system of pores in enamel, which ranges from 10 to 300 angstroms in diameter.13
In orthodontics, the use of bonding brackets has become standard practice; however, even with advances in dental materials, bond failure rates range from 0.5% to 16%.14–16 Increased bond failure results in prolonged treatment time, which could result in a higher prevalence of white spot lesions and eventual caries. Thus, a better understanding of enamel properties would provide additional insight that is needed to improve upon the reliability of the enamel bonding procedure.
The purposes of this study were (1) to quantitatively characterize human enamel porosity and surface area in vitro before and after etching for variable etching times; and (2) to evaluate shear bond strength after variable etching times. Specifically, our goal was to identify the presence of any correlation between enamel porosity and shear bond strength.
MATERIALS AND METHODS
Enamel Sample Preparation
Fifteen human first upper premolars extracted from individuals as part of their orthodontic treatment were used. Subjects' ages ranged from 12 to 15 years. Buccal enamel was sectioned with a water-cooled diamond saw at low speed (Buehler, Lake Bluff, Ill). The samples measured approximately 5 mm in width, 5 mm in length, and 5 mm in depth. All surfaces of the sample were painted with one layer of red nail polish (Revlon, New York, NY), except for the buccal surfaces, which were manually polished with 280-400-600-1200 grit silicon carbide papers (Buehler Micropolish, Buehler) to provide a flattened, standardized surface as a baseline finish.
Prepared samples were divided into three groups of five samples each: group I was acid-etched with 37% phosphoric acid solution (Ormco Etching Solution, Ormco, Glendora, Calif) for 15 seconds, group II for 30 seconds, and group III for 60 seconds, followed by 5 seconds of water rinsing and 5 seconds of air drying.
Gas Adsorption Measurement
Prepared samples were analyzed before and after acid-etching at Micromeritics Analytical Services (Norfolk, Ga). Samples were degassed at 40°C for 16 hours prior to analysis and then were placed in a sample tube and heated under vacuum or flowing gas to remove contaminants on their surfaces. The sample tube was placed in the analysis port of a 2420 Accelerated Area and Porosimetry System (Micromeritics) for automatic analysis. The krypton adsorption isotherm was recorded at 120°K. Specific surface area, pore volume, and pore size were calculated for each group according to the standard BET method12 (Figure 1).
Figure 1.
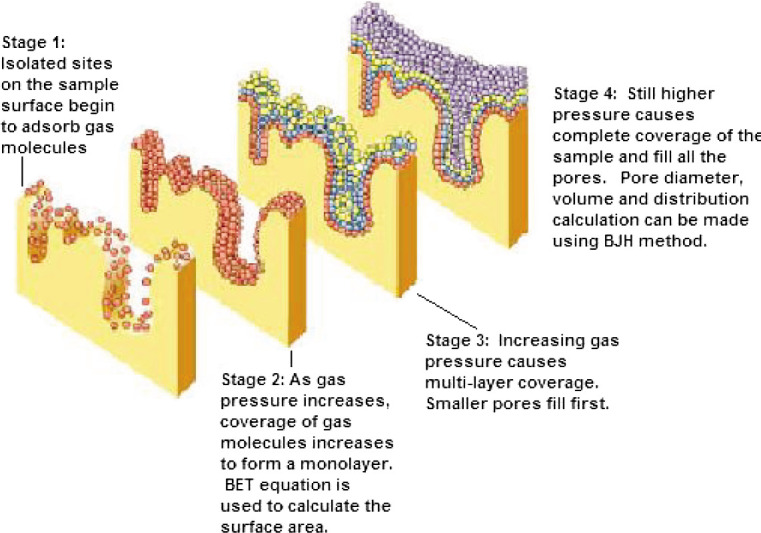
BET gas adsorption method. (From Orellana MF et al., 2007, with permission.)
Shear Bond Strength Testing
Eighteen human molars were prepared as described previously. Nine of the prepared samples were analyzed via the BET gas adsorption method after acid-etching. Each sample was mounted in the single-plane lap shear device shown in Figure 217 and was secured within one side of the two-piece Plexiglass platform with dental stone (Die-Keen, Miles Inc, South Bend, Ind). The etched enamel sample was prepared with Ortho-Solo Plus (Ormco). Light-cured adhesive (Transbond XT Light Cured Adhesive, 3M Unitek, Monrovia, Calif) was used to bond an orthodontic button (Ormco) to each enamel sample with a weight. All samples were stored at room temperature (approximately 21°C) in water for 24 hours to allow complete polymerization of the resin components. After 24 hours, the second side of the two-piece Plexiglass platform was put in place and subsequently was filled with dental stone to engage the orthodontic button.
Figure 2.
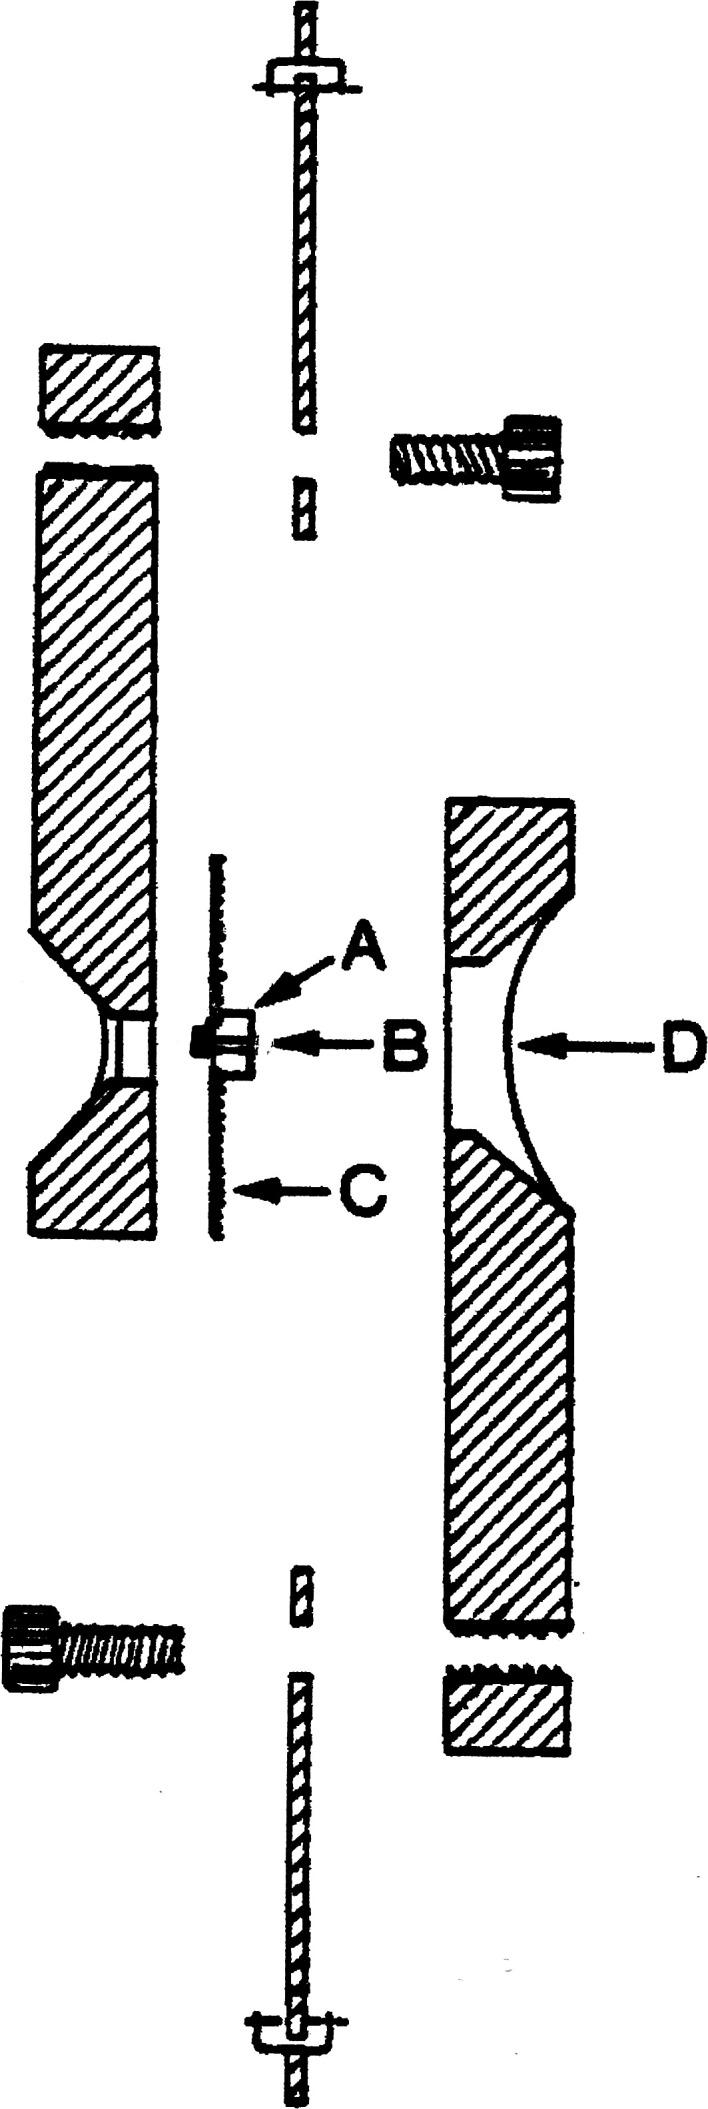
Diagram for shear assembly used for shear bond strength testing. (Adapted from Watanabe LG et al., 1996, with permission.) (A) Enamel specimen mounted on dental stone. (B) Enamel specimen with button bonded to its surface. (C) Mylar. (D) Dental stone.
Eighteen shear assemblies were made and tested in a universal mechanical testing machine (Instron Model 1122, Instron, Canton, Mass) at a constant crosshead speed of 1 mm/min. Shear bond testing simulates vertical forces similar to biting forces as the two sides of the Plexiglass platform are sheared apart.17 The plates drive the force straight through the bond-tooth interface, and the result is the amount of force (in MPa) needed to disengage the orthodontic button from the tooth surface.
RESULTS
Enamel Surface Area, Pore Volume, and Pore Size After Variable Etch Times
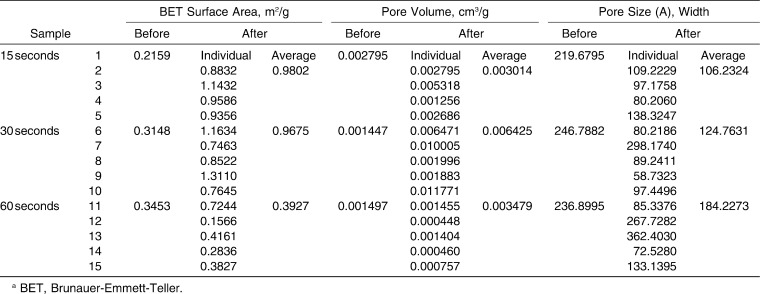
The BET surface area, pore volume, and pore size measurements for each of our groups are summarized in Table 1.
Table 1.
Surface Area, Pore Volume, and Pore Size of Enamel Samples Before and After Acid-Etching as Determined by the BETa Gas Adsorption Method
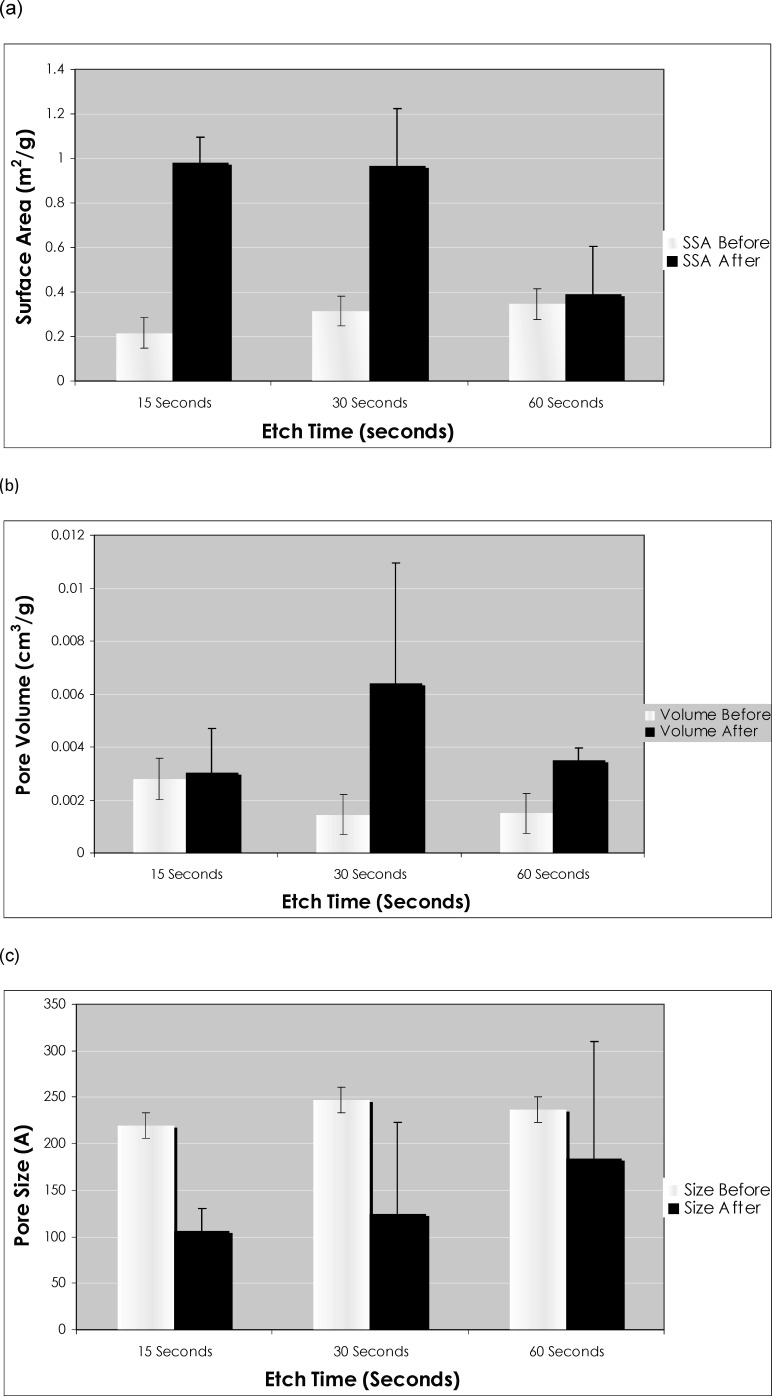
Comparison of surface area measurements reveals an increase in surface area for all three groups after etching (Figure 3a). The increase in the 15-second etch group and in the 30-second etch group, at 354% and 207%, respectively, is much more substantial than the mild 14% increase seen in the 60-second etch group.
Figure 3.
(a) Comparison of surface area, (b) pore volume, and (c) pore size before and after acid-etching as determined by the BET gas adsorption method.
Total pore volume increased in all three groups after etching (Figure 3b). The greatest increase was observed in the 30-second etch group at 344%. Changes in the other two groups were much less dramatic in comparison. Pore volume in the 15-second etch group increased by 8% after etching, and pore volume in the 60-second etch group increased by 132%.
Conversely, average pore size decreased in all three groups after etching (Figure 3c). The decreases in pore size observed in the 15-second etch group and in the 30-second etch group were comparable, at 51% and 49%, respectively. A smaller decrease of 22% was seen in the 60-second etch group.
Shear Bond Strength After Variable Etch Times
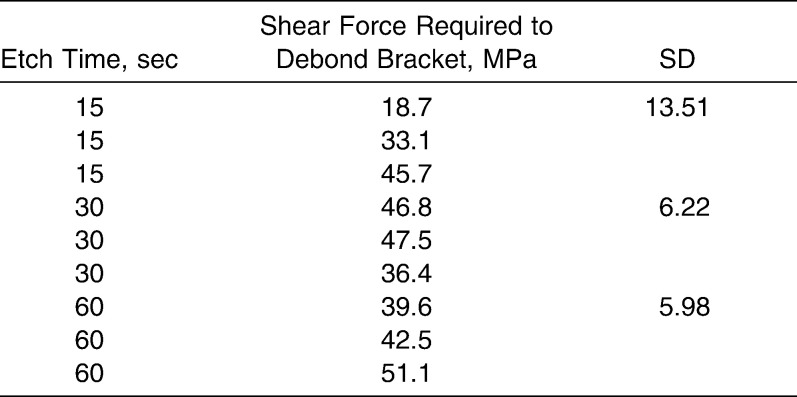
A great amount of variation in shear force was observed among individual samples (Table 2). Greatest variation was noted in the 15-second group, where values ranged from 18 MPa to 45 MPa (standard deviation [SD] = 13). The 18-MPa reading, however, may be a confounder, in that the sample was found to be fractured before shear strength testing was performed. The 30-second group and the 60-second group values displayed as much variation, with values ranging from 36 MPa to 47 MPa (SD = 6.22) and from 39 MPa to 51 MPa (SD = 5.98), respectively.
Table 2.
Summary of Shear Forces Required to Debond Brackets After Variable Etch Times
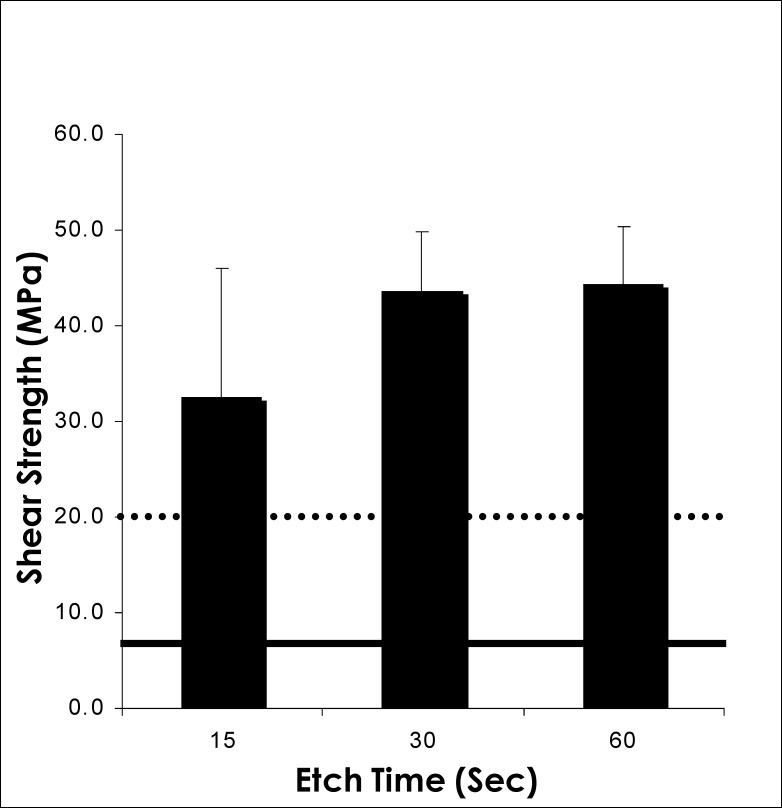
Mean shear strengths of our samples after 15-, 30-, and 60-second etch times were 32.5 MPa, 43.6 MPa, and 44.4 MPa, respectively (Figure 4). These are well above the minimum clinical bond strength requirements reported in the literature—7.8 MPa for anterior teeth18,19 and 20 MPa for posterior teeth.20,21
Figure 4.
Comparison of mean shear bond strengths after variable etch times. Anterior teeth (solid), posterior teeth (dotted).
Correlation Between Enamel Architecture and Shear Bond Strength
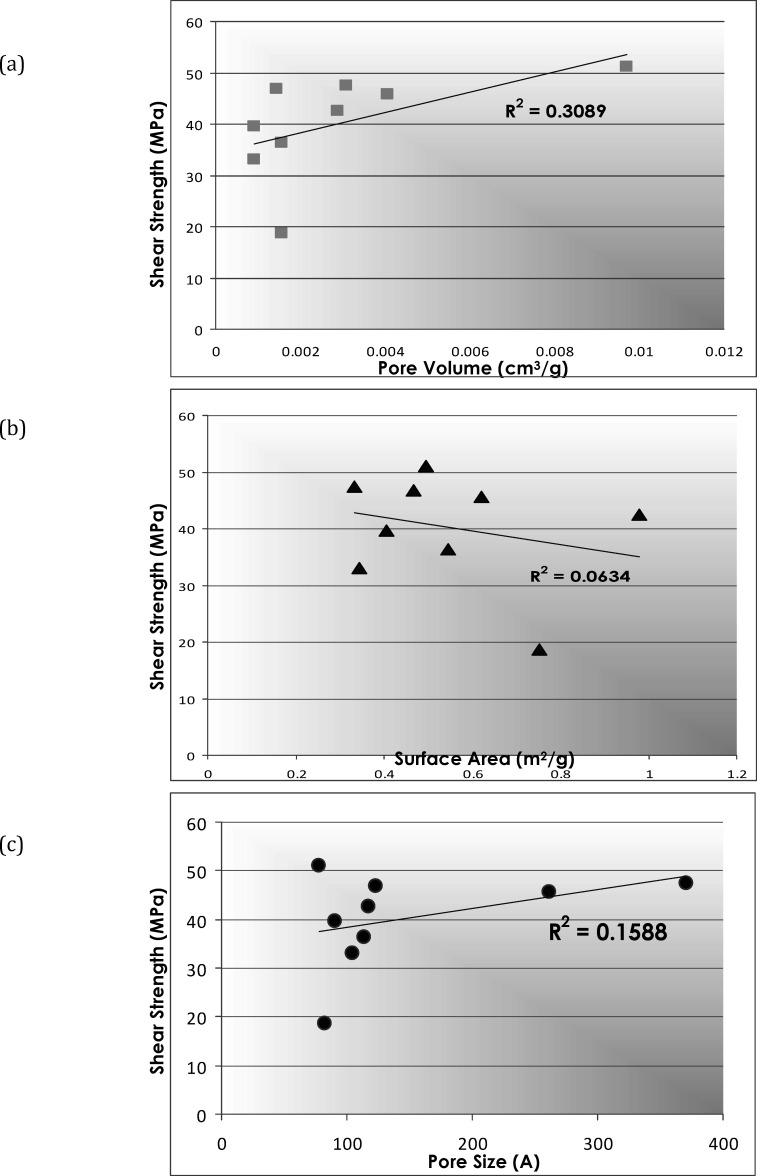
The BET surface area, pore volume, and pore size measurements for each of our samples were compared with shear strength, as summarized in Table 3. These relationships are further illustrated in the scatterplots shown in Figure 5. A correlation test was used to determine whether any relationship could be seen between shear force and various enamel properties. The r2 values for all three scatterplots—pore volume, surface area, and pore size—were 0.31, 0.06, and 0.16, respectively. This demonstrated the lack of a linear relationship to shear strength values and, thus, a very weak correlation.
Table 3.
Comparison of Surface Area, Pore Volume, and Pore Size of Enamel Samples vs Shear Strength Values
Figure 5.
Correlation between shear bond strength and (a) pore volume, (b) surface area, and (c) pore size.
DISCUSSION
Scanning electron microscopy (SEM) has been the traditional method used to study the overall microscopic “surface structure” of dental tissues3,7,8,22–24; however, it is not a surface-specific technique. A significant difficulty associated with the use of SEM in examining etched enamel is the lack of consensus on grading systems.10 Recent studies using the BET gas adsorption method support the suggestion that enamel porosity, surface area, and pore size are more important toward an understanding of enamel topography than is a defined etch pattern.10 Gas adsorption has been studied theoretically for most of the 21st century, and the simplest of the resulting theories has provided the insight needed for most applications. Still, the number of studies on dental enamel that used the gas absorption method is limited.10,25,26 We sought to expand on the knowledge of enamel topography by using this same method in our studies to compare how enamel properties are altered by acid-etching procedures.
When phosphoric acid is applied to the dental enamel surface, it dissolves the outer smear layer, which is approximately 5 to 10 microns in thickness. The outer 5 to 50 micron ends of the enamel prisms are selectively dissolved as well.27 As a result, microscopic pores and enamel crystallites are exposed, resulting in a retentive surface for the primer.1 It is assumed that this increase in the number of pores and in surface irregularities results in a larger exposed area of enamel, which creates a greater area for bonding and higher subsequent bond strengths.28 Eventually, too much acid exposure will cause the enamel crystallites to be gradually dissolved and broken down until the structure of enamel is destroyed.29 It is assumed that the once-opened enamel pores will slowly become obliterated by collapsing enamel structures.
Figures 3a and 3b illustrate the changes in surface area and pore volume that were observed after variable etch times. When all three time points are compared, a clear increase in surface area and pore volume was evident after etching. This increased etch time may have contributed to an increased number of exposed pores and, thus, to increased surface area and pore volume through the dissolving action of phosphoric acid. After 60 seconds of etching, however, both surface area and pore volume were much lower than for the other time points. This finding may be due to the aforementioned collapse of structures and the obliteration of some pores, leading to an overall decrease in both surface area and pore volume that can be detected by the BET gas adsorption method.
Figure 3c shows the changes in pore size that were observed after variable etch times. A comparison of all three time points shows a decrease in pore size among our samples as etch time increased. This can be explained by the assumption that etching will lead to a greater number of pores, but that the average size of each pore is smaller. At the microscopic level, dental enamel consists of a network of interprismatic and intraprismatic compartments among a complex arrangement of crystallites in enamel prisms.30 As phosphoric acid is applied to the tooth, new, presumably smaller microstructures are exposed to the surface, thereby reducing the average pore size of our samples. After 60 seconds of etching, however, the average pore size does not decrease as much as for other time points. This actually is in line with our other findings in that it may be due to collapse of structures and obliteration of smaller pores, making the decrease in average pore size less dramatic in this time group.
Minimum shear bond strengths of 5 to 7 MPa are required for a successful clinical bond on anterior teeth.19,31 On posterior teeth, because of functional demands and wear, a minimum shear bond strength of 20 MPa is required to sustain an adequate clinical bond.20,21 The shear bond strengths exhibited by enamel samples in all three of our etch groups (15 seconds, 30 seconds, and 60 seconds) are presented in Figure 4. These shear strength values were found to be well above the minimum levels considered clinically acceptable.
Pearson's correlation test showed very little to no relationship between shear strength and various enamel properties. Figures 5a through 5c illustrate a very random distribution among nine samples in this portion of the study. Natural variability in the arrangement of crystallites is apparent in enamel prisms from within a tooth and from tooth to tooth.30 These significant variations in porosity apparently affect interprismatic and intraprismatic compartments, both within a single tooth and between tooth types.29 As a result, variable permeability and differing responses to chemical and mechanical exposures are often observed.29 Therefore, the degree of shear bond strength exhibited by each sample is dictated by underlying structural details beyond pore size, pore volume, and surface area.
With the aim of controlling for the confounding variable of inherent surface differences, samples were polished before the etching procedure was undertaken. One of the limitations of this study is that unpolished samples were not analyzed and compared with polished samples.
Because of the sample size limitations of this study, additional experiments will have to be conducted using the BET method with a larger sample size to confirm these findings and to identify new findings. This may be a challenge, given the high cost of processing each enamel sample. Also, some concerns have arisen regarding how the BET gas adsorption method may alter the general structure of enamel samples, somehow affecting shear strength values.
We anticipate that this research will lead to a better understanding of both dental enamel and the effects of acid etching.
CONCLUSIONS
The effect of acid-etching appears to differ at 60 seconds compared with effects at 15 and 30 seconds. Nevertheless, 15, 30, or 60 seconds of etching time were all found to provide a shear bond strength value that is clinically acceptable for orthodontic brackets.
Application of the BET gas adsorption method to quantify enamel properties provides an alternative view of the porous enamel structure.
REFERENCES
- 1.Buonocore M. G. A simple method of increasing the adhesion of acrylic filling materials to enamel surfaces. J Dent Res. 1955;34:849–853. doi: 10.1177/00220345550340060801. [DOI] [PubMed] [Google Scholar]
- 2.Mattick C. R, Hobson R. S. A comparative micro-topographic study of the buccal enamel of different tooth types. J Orthod. 2000;27:143–148. doi: 10.1093/ortho/27.2.143. [DOI] [PubMed] [Google Scholar]
- 3.Mahoney E, Ismail F. S, Kilpatrick N, Swain M. Mechanical properties across hypomineralized/hypoplastic enamel of first permanent molar teeth. Eur J Oral Sci. 2004;112:497–502. doi: 10.1111/j.1600-0722.2004.00162.x. [DOI] [PubMed] [Google Scholar]
- 4.Hobson R. S, McCabe J. F, Hogg S. D. Bond strength to surface enamel for different tooth types. Dent Mater. 2001;17:184–189. doi: 10.1016/s0109-5641(00)00068-3. [DOI] [PubMed] [Google Scholar]
- 5.Hobson R. S, McCabe J. F. Relationship between enamel etch characteristics and resin-enamel bond strength. Br Dent J. 2002;192:463–468. doi: 10.1038/sj.bdj.4801401. [DOI] [PubMed] [Google Scholar]
- 6.Hobson R. S, Rugg-Gunn A. J, Booth T. A. Acid-etch patterns on the buccal surface of human permanent teeth. Arch Oral Biol. 2002;47:407–412. doi: 10.1016/s0003-9969(02)00008-0. [DOI] [PubMed] [Google Scholar]
- 7.Oliver R. G. The effects of differing etch times on the etch pattern on enamel of unerupted and erupted human teeth examined using the scanning electron microscope. Br J Orthod. 1987;14:105–107. doi: 10.1179/bjo.14.2.105. [DOI] [PubMed] [Google Scholar]
- 8.Gardner A, Hobson R. Variations in acid-etch patterns with different acids and etch times. Am J Orthod Dentofacial Orthop. 2001;120:64–67. doi: 10.1067/mod.2001.114643. [DOI] [PubMed] [Google Scholar]
- 9.Dibdin G. H. The internal surface and pore structure of enamel. J Dent Res. 1969;48:771–776. doi: 10.1177/00220345690480052701. [DOI] [PubMed] [Google Scholar]
- 10.Orellana M. F, Nelson A. E, Carey J. P, Heo G, Boychuk D. G, Major P. W. Surface analysis of etched molar enamel by gas adsorption. J Dent Res. 2008;87:532–536. doi: 10.1177/154405910808700607. [DOI] [PubMed] [Google Scholar]
- 11.Brunauer S, Emmett P. H, Teller E. Adsorption of gasses in multimolecular layers. J Am Chem Soc. 1938;60:309–319. [Google Scholar]
- 12.Sing K. S. W, Everett D. H, Haul R. W, et al. Reporting physisorption data for gas solid systems with special reference to the determination of surface-area and porosity. Pure Appl Chem. 1985;57:603–619. [Google Scholar]
- 13.Moreno E. C, Zahradnik R. T. The pore structure of human dental enamel. Arch Oral Biol. 1973;18:1063–1068. doi: 10.1016/0003-9969(73)90187-8. [DOI] [PubMed] [Google Scholar]
- 14.Read M. J, O'Brien K. D. A clinical trial of an indirect bonding technique with a visible light-cured adhesive. Am J Orthod Dentofacial Orthop. 1990;98:259–262. doi: 10.1016/S0889-5406(05)81603-8. [DOI] [PubMed] [Google Scholar]
- 15.Millett D. T, Gordon P. H. A 5-year clinical review of bond failure with a no-mix adhesive (Right on) Eur J Orthod. 1994;16:203–211. doi: 10.1093/ejo/16.3.203. [DOI] [PubMed] [Google Scholar]
- 16.Millett D. T, Hallgren A, Cattanach D, et al. A 5-year clinical review of bond failure with a light-cured resin adhesive. Angle Orthod. 1998;68:351–356. doi: 10.1043/0003-3219(1998)068<0351:AYCROB>2.3.CO;2. [DOI] [PubMed] [Google Scholar]
- 17.Watanabe L. G, Marshall G. W, Jr, Marshall S. J. Dentin shear strength: effects of tubule orientation and intratooth location. Dent Mater. 1996;12:109–115. doi: 10.1016/S0109-5641(96)80077-7. [DOI] [PubMed] [Google Scholar]
- 18.Reynolds I. R, von Fraunhofer J. A. Direct bonding of orthodontic attachments to teeth: the relation of adhesive bond strength to gauze mesh size. Br J Orthod. 1976;3:91–95. doi: 10.1179/bjo.3.2.91. [DOI] [PubMed] [Google Scholar]
- 19.Reynolds I. R. A review of direct orthodontic bonding. Br J Orthod. 1975;2:171–178. [Google Scholar]
- 20.Barkmeier W. W, Gwinnett A. J, Shaffer S. E. Effects of reduced acid concentration and etching time on bond strength and enamel morphology. J Clin Orthod. 1987;21:395–398. [PubMed] [Google Scholar]
- 21.Barkmeier W. W, Gwinnett A. J, Shaffer S. E. Effects of enamel etching time on bond strength and morphology. J Clin Orthod. 1985;19:36–38. [PubMed] [Google Scholar]
- 22.Johnston C. D, Hussey D. L, Burden D. J. The effect of etch duration on the microstructure of molar enamel: an in vitro study. Am J Orthod Dentofacial Orthop. 1996;109:531–534. doi: 10.1016/s0889-5406(96)70138-5. [DOI] [PubMed] [Google Scholar]
- 23.Hobson R. S, McCabe J. F, Rugg-Gunn A. J. The relationship between acid-etch patterns and bond survival in vivo. Am J Orthod Dentofacial Orthop. 2002;121:502–509. doi: 10.1067/mod.2002.122239. [DOI] [PubMed] [Google Scholar]
- 24.Ceppi E, Dall'Oca S, Rimondini L, Pilloni A, Polimeni A. Cementoenamel junction of deciduous teeth: SEM-morphology. Eur J Paediatr Dent. 2006;7:131–134. [PubMed] [Google Scholar]
- 25.Misra D. N, Bowen R. L, Mattamal G. J. Surface area of dental enamel, bone, and hydroxyapatite: chemisorption from solution. Calcif Tissue Res. 1978;26:139–142. doi: 10.1007/BF02013248. [DOI] [PubMed] [Google Scholar]
- 26.Fridell R. A, Lussi A, Crenshaw M. A, Bawden J. W. The in vitro uptake of fluoride by secretory and maturation stage bovine enamel. J Dent Res. 1988;67:487–490. doi: 10.1177/00220345880670021101. [DOI] [PubMed] [Google Scholar]
- 27.Beech D. R, Jalaly T. Bonding of polymers to enamel: influence of deposits formed during etching, etching time and period of water immersion. J Dent Res. 1980;59:1156–1162. doi: 10.1177/00220345800590071101. [DOI] [PubMed] [Google Scholar]
- 28.Kanemura N, Sano H, Tagami J. Tensile bond strength to and SEM evaluation of ground and intact enamel surfaces. J Dent. 1999;27:523–530. doi: 10.1016/s0300-5712(99)00008-1. [DOI] [PubMed] [Google Scholar]
- 29.Teaford M. S. M, Ferguson W. J. Development Function and Evolution of the Teeth. Cambridge, United Kingdom: Cambridge University Press; 2000. [Google Scholar]
- 30.Poole D. F, Brooks A. W. The arrangement of crystallites in enamel prisms. Arch Oral Biol. 1961;5:14–26. doi: 10.1016/0003-9969(61)90110-8. [DOI] [PubMed] [Google Scholar]
- 31.Reynolds I. R, von Fraunhofer J. A. Direct bonding of orthodontic brackets—a comparative study of adhesives. Br J Orthod. 1976;3:143–146. doi: 10.1179/bjo.3.3.143. [DOI] [PubMed] [Google Scholar]


