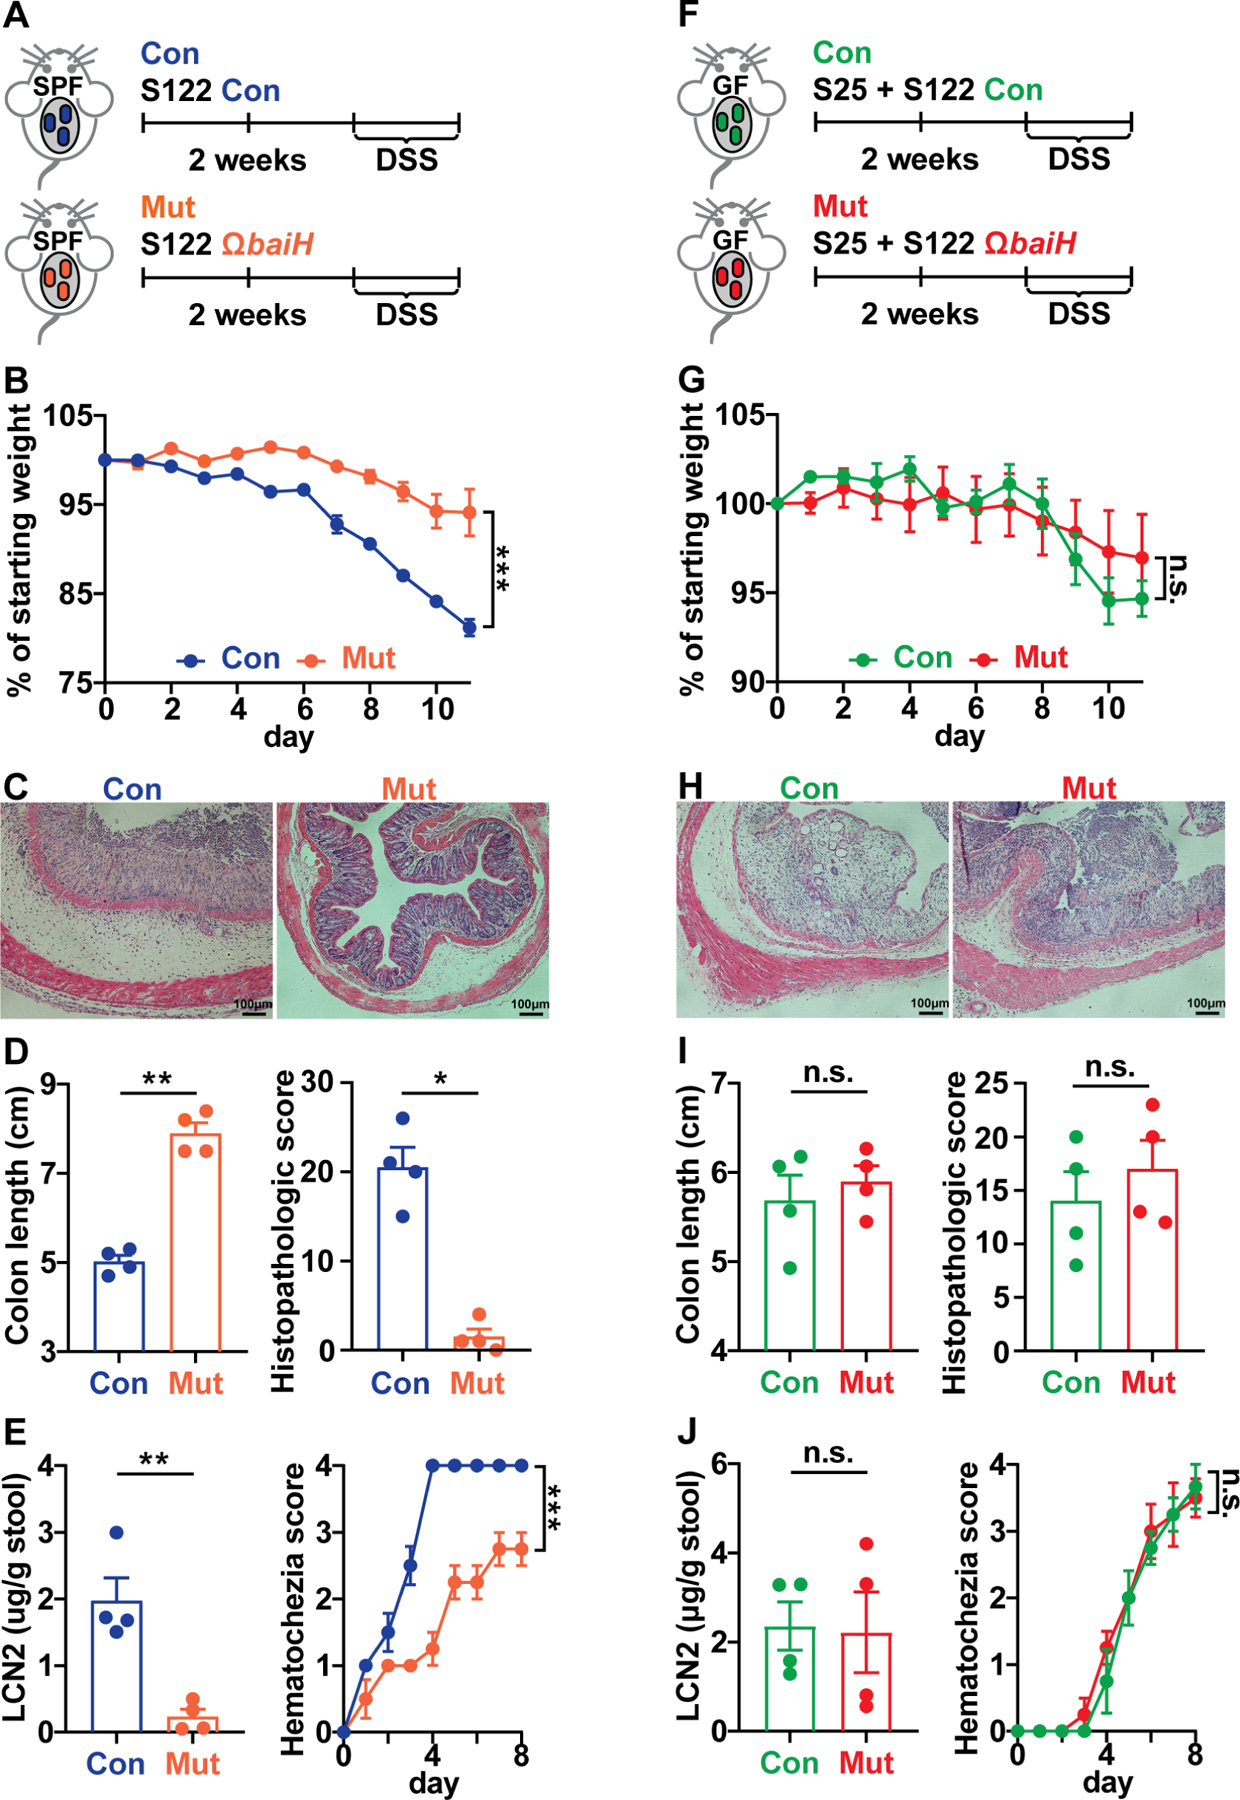
Figure 6. baiH modulates intestinal inflammation in the context of complex gut microbiota.

(A, F) DSS-induced murine colitis model was applied to the SPF or gnotobiotic mice colonized with the genetically tagged S122 control (Con) and ΩbaiH mutant (Mut). Mice were colonized with the control or mutant strain for at least two weeks before giving DSS, SPF mice were given 2.5% DSS (in water supplemented with 15 μg/ml thiamphenicol and 10 μg/ml erythromycin) for 8 days, and gnotobiotic mice were given 2.0% DSS (in water supplemented with 15 μg/ml thiamphenicol) for 7 days. The disease state was monitored by weight loss (B, G), hematoxylin and eosin (H&E) staining of the distal colon (C, H), colon shortening, and histopathologic score (D, I), and fecal lipocalin-2 and daily hematochezia score (E, J).
Data shown in (B-E, G-J) are representations of n = 4 to 5 mice per group replicated in two or more independent experiments. In (B, G), % of starting weight was calculated by normalizing weights at sacrifice to starting weight. In (D, I) and (E, J), colon length and LCN2 data were analyzed using unpaired two-tailed Student’s T-test. In (B, G) and (E, J), % of starting weight and hematochezia score data were analyzed using Two-way ANOVA followed by the Bonferroni post hoc test (n=4). In (D, I), histopathologic score data were analyzed using the Mann-Whitney test. Data are shown as mean ± SEM. The asterisk indicates p-value < 0.05 (*), < 0.01 (**) or < 0.001 (***). The numbering of the strains corresponds to the strain information shown in Table S1.
