Abstract
Objective
This proof-of-principle study integrates joint reaction forces (JRFs) and bone shape to assess acute cartilage changes from walking and cycling.
Methods
Sixteen women with symptomatic knee osteoarthritis were recruited. Biomechanical assessment estimated JRFs during walking and cycling. Subsamples had magnetic resonance imaging (MRI) performed before and after a 25-min walking (n = 7) and/or cycling (n = 9) activity. MRI scans were obtained to assess cartilage shape and composition (T2 relaxation time). Bone shape was quantified using a statistical shape model built from 13 local participants and 100 MRI scans from the Osteoarthritis Initiative. Statistical parametric mapping quantified cartilage change and correlations between cartilage change with JRFs and statistical shape model features.
Results
Cartilage thickness (interior lateral, Δ − 0.10 mm) and T2 (medial, Δ − 4 ms) decreased on the tibial plateau. On the femur, T2 change depended on the activity. Greater tibiofemoral JRF was associated with more cartilage deformation on the lateral femoral trochlea after walking (r − 0.56). Knees more consistent with osteoarthritis showed smaller decreases in tibial cartilage thickness.
Discussion
Walking and cycling caused distinct patterns of cartilage deformation, which depended on knee JRFs and bone morphology. For the first time, these results show that cartilage deformation is dependent on bone shapes and JRFs in vivo.
Supplementary Information
The online version contains supplementary material available at 10.1007/s10334-022-01004-8.
Keywords: Biomechanical phenomena, Statistics, Cartilage, Articular, Osteoarthritis, Aerobic exercise
Introduction
Relationships between joint mechanics and cartilage tissue characteristics vary across the osteoarthritis (OA) disease spectrum [1]. In healthy joints, larger loads [2–4] and greater cartilage surface pressures [5] are related to greater cartilage thickness and quality (denser proteoglycans), suggesting healthy adaptation to loading. Cartilage quality or composition is typically measured using magnetic resonance (MR) relaxometry; of particular interest are T2 and T1ρ relaxation times. In cartilage, T2 is related to free-water content and collagen fibre alignment, whereas T1ρ is less specific but has been related to cartilage proteoglycan content [6, 7]. In early OA, there is little to no correlation between joint loads and cartilage thickness [8–10]. In late OA, there is a negative correlation between loading and cartilage thickness, suggesting loading may cause cartilage damage [9, 11]. While there is a plethora of research relating cross-sectional cartilage morphology and composition with joint mechanics, we are aware of only three experimental studies investigating cartilage deformation and joint mechanics [12–14], all of which examined healthy young adults. Thus, it is unclear if and how joint mechanics affect cartilage deformation in different stages of the disease course and how these mechanics may affect disease initiation and progression.
Bone shape is critical for understanding and characterizing OA, with Kellgren and Lawrence first using features of bone shape to diagnose OA from radiographs [15]. Three-dimensional bone shape, obtained from statistical shape models, has become a promising OA biomarker that is fundamental in understanding joint health and structural degeneration [16, 17]. For example, Neogi and colleagues predicted radiographic knee OA progression using Statistical Shape Models (SSM); OA was characterized by a widening and flattening of the medial joint surface areas, with a ridge of osteophytic growth around the cartilage plate [18]. Pedoia and colleagues found that bone shape features distinguish between an anterior cruciate ligament (ACL)-injury and a control group, showing that the injury group had a narrower intercondylar notch [19]. Furthermore, the tibial plateau size, the relative heights of the tibial eminences, and the concavity of the lateral patellar facet, are systematically different between high-knee impact (basketball) and non-knee impact (swimming) collegiate athletes [20]. Given that bone shape features have been able to distinguish between OA and control knees in a general population, in a post-traumatic ACL-injury model, and in distinct athlete groups, these bone-shape features may be able to provide insights into varying patterns of structural joint wear and degeneration. Nonetheless, no research to-date has directly assessed how bone shape is related to cross-sectional cartilage health or in vivo cartilage deformation.
Computational biomechanical studies show that bone shape affects cartilage surface pressures during gait [21]. Clouthier and colleagues showed that changing bone shape along the principal components of a statistical shape model leads to considerable changes in the peak surface pressures as well as the locations of the peak pressures [21]. For example, changing bone shape from − 3 to + 3 standard deviations along the third principal component of their shape model reduced overall surface pressures and shifted the location of the peak tibial cartilage surface pressure during gait from the medial to the lateral plateau. Interestingly, this third principal component showed a wider and flatter medial tibial plateau, which was indicative of knee OA in the Neogi et al. [18] model. Together, the Neogi and Clouthier findings contribute to a hypothetical mechanical pathway of cartilage degeneration that highlights how bone shape may relate with, perhaps even predict, distinct patterns in OA disease, such as medial versus lateral tibiofemoral OA. However, in vivo research into the effect of bone shape on cartilage deformation is required to validate these findings.
This proof-of-principle study integrates biomechanics, statistical shape models, and cartilage outcomes (cartilage thickness and T2) in an experimental study of joint tissues and mechanical loading in vivo. In women with symptomatic knee OA, the primary objectives were to determine (1) whether cartilage thickness and T2 changed after activity; and (2) whether changes in cartilage thickness and T2 correlate with joint reaction forces. We also conducted exploratory analyses of bone shape as it relates with cartilage and joint reaction forces to identify (3) whether bone shape features correlate with changes in cartilage thickness and T2; and (4) relationships between tibiofemoral and patellofemoral joint reaction forces from gait with bone shape features. We hypothesized that (1) cartilage thickness and T2 would decrease in the medial and lateral tibia, the weight-bearing regions of the femur, and the trochlea; and (2) absolute tibiofemoral and patellofemoral joint reaction forces would be inversely related to cartilage change in these same regions. Due to the lack of a priori knowledge of the statistical shape model features, objectives 3 and 4 were exploratory and no specific hypotheses were proposed.
Materials and methods
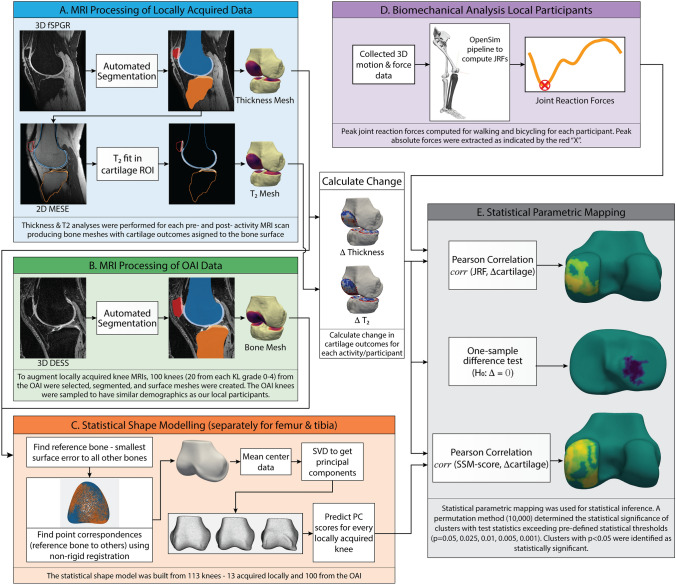
This study was approved by the Hamilton Integrated Research Ethics Board and the Office of Research Ethics at the University of Waterloo. Participants provided written, informed consent. An overview of the study data and analyses are provided in Fig. 1.
Fig. 1.
Overview of the data and statistical analyses conducted in this study. Abbreviations: 3D, three-dimensional; DESS, dual echo in the steady state; fSPGR, fast spoiled gradient recalled; JRF, joint reaction force; KL, Kellgren Lawrence; MESE, multi-echo spin echo; OAI, Osteoarthritis Initiative; PC, principal component; ROI, region of interest; SVD, singular value decomposition; T2, transverse relaxation time
Participants
We recruited sixteen women > 50 years of age with symptomatic knee OA, according to the American College of Rheumatology criteria [22], and Lower Extremity Functional Scale (LEFS) scores between 30 and 71 [23]. Exclusion included any of: rheumatoid arthritis, gout, unstable angina, acute lower-limb injury in the preceding 3-months, and contraindications to MRI. The Get Active Questionnaire (GAQ) was used to screen that exercise was safe [24]. Descriptive statistics included age, height, body mass, body mass index, inseam, 25 min walking speed, cycling cadence and power output, and LEFS scores.
Visits
This experimental study included three visits: one for biomechanical analyses and two to obtain MRI scans immediately before and after cycling and walking. MRI visits were scheduled in pseudo-random order.
Biomechanics visit
The biomechanics visit included four steps: First, we standardized walking speed to a Froude number (Fr) of 0.25, which produces ~ 3% cartilage strain after 25 min of walking [25]. The Fr, a unitless scalar, normalizes walking speed to leg length where . Participants completed a 100 m walk at their fastest self-selected speed. If their fastest speed was below the Fr-defined speed, the lower speed was used. Second, bicycle-fit using an inseam-based equation and handlebars set based on rider preference [26, 27] was determined. Third, an incremental cycling protocol [28] to determine moderate cycling intensity (i.e., steady-state heart rate between 70–75% of age-predicted maximum (208–0.7*Age) [26, 29]) was completed. Last, synchronous motion and force data were collected during gait trials and cycling bouts performed using the intensities and bicycle-fit determined from these protocols.
Magnetic resonance imaging (MRI) visits
Visits two and three required participants to arrive at 8 am and rest, laying supine, for 30 min [14]. Then, participants underwent pre-activity scanning, followed by a 25 min activity (walking or cycling) and finally post-activity MRI scans. The treadmill and stationary bike were in the room directly adjacent to the MRI scanner, enabling fast and accurate repositioning on the scanner table immediately after activity cessation. Thus, post activity scanning was started ~ 5-min after activity cessation, thereby limiting recovery of tissues before post exercise imaging [30]. Activities were performed at the intensities determined at the biomechanics visit.
Patellofemoral and tibiofemoral joint reaction forces
Joint reaction forces were modeled from kinematic and kinetic data collected during walking and cycling at the biomechanics visit. Participants wore 40 markers attached to anatomical locations (Supplemental 1). Marker data were collected at 112.5 Hz (Motion Analysis Corporation, Santa Rosa, CA). During walking, synchronous force plate data were collected at 1125 Hz (OR6-7, AMTI, MA, USA). During cycling, synchronous three-dimensional pedal forces and moments were collected at 450 Hz (Science To Practice, Ljubljana, Slovenia). Marker positions and kinetic data were filtered using a second-order low-pass dual-pass Butterworth filter with a cut-off frequency of 6 Hz. Motion and force data were processed as previously published [26].
Functional knee joint centres were fit from cycling data [31]. Hip joint centres were determined using the Harrington method [32]. A 16 degrees-of-freedom lower-body model with 86 musculotendon actuators was scaled with OpenSim 3.2 [33]. Joint kinematics and dynamics were calculated using inverse methods [33]. Static optimization with muscle weightings validated using in vivo joint reaction forces [26, 34] was used. Using the OpenSim Joint Reaction Tool, the patellofemoral joint reaction force was calculated as the sagittal plane resultant force, and the tibiofemoral joint reaction force as the compressive component of the tibiofemoral joint reaction force defined along the long axis of the tibia [34]. Reaction forces were extracted using all revolutions from the last minute of each cycling bout and 5 gait trials [35]. Data were divided into individual pedal revolutions or stance phases to generate median ensemble curves for each reaction force and activity; the absolute peak joint reaction force was extracted from each ensemble.
Magnetic resonance imaging data acquisition and analysis
MR images were acquired using a dedicated quadrature transmit and 16-channel receive knee coil array (Invivo Corp) in a 3-Tesla GE Discovery MR750 (GE Healthcare). Two sequences were collected before and after activity. Following a 3-plane localizer scan a commercial sagittal multi-echo spin echo (MESE) sequence (CartiGram; GE Healthcare) was acquired for T2 mapping [14] (relaxation time (TR) 2450 ms, 8 echo times (TE) at multiples of 6.312 ms, flip angle 90°, in-plane resolution 0.625 × 0.625 mm, slice thickness 3 mm, slice spacing 1 mm, field-of-view 16 cm, receiver bandwidth, 488.28 Hz/pixel). All echoes were used in the T2 fit; the Cartigram sequence uses a crusher gradient to reduce the effect of stimulated echoes (GE Healthcare). For segmentation, a 3D fat-saturated T1-weighted sagittal fast spoiled gradient recalled (fSPGR) sequence was acquired (TR 17.388 ms, TE 5.832 ms, flip angle 18º, in-plane resolution 0.3125 × 0.3125 mm, slice thickness 1 mm, slice spacing 0 mm, field-of-view 16 cm, receiver bandwidth 122.07 Hz/pixel). Pre-activity, the fSPGR scan was collected first and the MESE second. Post-activity, the MESE was acquired first. This order of acquisition was used to minimize recovery of T2 post activity.
Calculation of cartilage thickness and T2
fSPGR images were segmented using a convolutional neural network (CNN) [36], then manually checked [37]. The CNN segmentation algorithm had a Dice similarity coefficient of 0.88–0.91 when compared to expert manual segmentations for the tibial and femoral cartilage of participants with osteoarthritis [36]. Bone and cartilage surfaces were created by applying a Gaussian filter to the binary mask from each tissue (bone σ2 = 1.0 mm, cartilage σ2 = 0.625 mm) followed by surface extraction using the Marching Cubes algorithm [38, 39]. Bone surfaces were resampled to have 10,000 vertices using Voronoi clustering [40, 41]. Cartilage thickness was calculated for each bone vertex by projecting vectors normal to the surface and calculating the 3D Euclidean distance from the bone to articular surface. Using these methods, unpublished data on the reliability of cartilage thickness measurements determined on repeated MRI scans over 2 years from 94 individuals with Kellgren-Lawrence grade 0 knees had a standard error of measurement of 0.05–0.08 mm for mean tibial and weight-bearing femoral cartilage regions of interest; these are comparable to reliability of expert manual methods and other deep learning-based predictions [42]. T2 maps were created by fitting a mono-exponential decay curve (Eq. 1) to the signal intensities (SI) collected at the 8 TEs using a Levenberg–Marquardt algorithm, where the intercept is equivalent to the mobile proton density (PD) [14]. T2 map post-processing excluded voxels with T2 > 100 ms, and R2 < 0.7 [14]. Furthermore, T2 values were assigned to the bone meshes by projecting vectors normal to the surface. When vectors intersected cartilage, all T2 cartilage voxels along the vector were averaged and assigned to the vertex [43].
| 1 |
Statistical shape modelling
The statistical shape model was built using scans acquired from 113 women. Of these, 13 scans were from the women we recruited that completed MRI visits in the current experiment, and 100 were from the Osteoarthritis Initiative (OAI) (https://nda.nih.gov/oai) [44]. The 100 scans from the OAI were included to increase robustness of the statistical shape model. To represent individuals with demographics similar to our local participants across the OA spectrum, specific sampling strategies were used. First, only women were included. Second, stratified sampling was used across 5 Kellgren-Lawrence (KL) grades of severity [15]. Finally, for each KL grade, 20 sets of potential demographics (age, height, and body mass) were randomly sampled from a multivariate normal distribution and the OAI participant that best matched each set of demographics using a z-score normalized root mean squared (RMS) error was included in the study. The multivariate normal distribution was created from the demographics of the 13 local participants that completed MRI visits for this study. This strategy enabled us to increase the sample size used to build our statistical shape model while keeping demographics of the pool of participants comparable to our local sample. For each of the selected OAI participants, baseline knee images (sagittal dual echo in the steady state (DESS) with in-plane resolution 0.365 × 0.365 mm, slice thickness 0.7 mm and slice spacing 0 mm [44]) were extracted and segmented using the same CNN as the locally acquired images [36].
The statistical shape model was built in four steps. (i) For each segmentation, a 3D surface with 10,000 vertices was generated using the same methods as described for the cartilage analyses. (ii) A reference knee, with the smallest RMS surface error to all other knees after rigid plus scaling registration using the iterative closest point algorithm, was identified; all knees were registered to this reference knee. A rigid plus scaling version of the iterative closest point algorithm removes the scale factor. (iii) Point correspondences between the reference and every other bone were found using the Feature Oriented Correspondence using Spectral Regularization algorithm with minimum and maximum curvature as the features [19, 45]. (iv) Using corresponding points, mean bone shape was computed and after mean centering the data, singular value decomposition was used to find the principal modes of variation [46]. Statistical shape model mode scores were generated by projecting each mesh onto the mode vectors. Statistical shape model mode 1 explains the most variance, each subsequent mode explains less variance than the previous one. To minimize the number of statistical comparisons, we tested correlations between cartilage outcomes and bone shape using statistical shape model mode 1; and relationships between knee joint reaction forces and the first three statistical shape model modes. The mean bone shape and principal components of the statistical shape model are freely available (www.github.com/gattia/MAGMA-SSM).
Statistical analysis
Statistical parametric mapping
Statistical parametric mapping was used for statistical inference. Cluster-wise inference was performed using a permutation method (10,000 permutations), thus statistical significance was determined at the cluster level. The permutation method minimizes the risk of committing a Type I error and assumptions involved with identifying field smoothness and stationarity [47–50]. Test statistics (z-statistics for one-sample difference tests, and t-statistics for correlations) were computed for every permutation. Clusters above thresholds (p = 0.05, 0.025, 0.01, 0.005, and 0.001) were identified. The maximum contiguous cluster area for every permutation and threshold was recorded. Significance of a cluster at a given threshold was identified based on its position in the permutation distribution. For each threshold level, clusters with a p < 0.05 were identified as statistically significant. Clusters that were significant (p < 0.05) at 2 or more threshold levels are presented. Cluster significance at different threshold levels should be interpreted differently. Typically, as the threshold statistic (t-statistic, z-statistic) is increased the cluster area needed to be statistically significant decreases, therefore, lower test-statistic thresholds are likely to show more diffuse but smaller magnitude effects, while higher test-statistic thresholds are likely to show smaller area but greater magnitude effects. Code used to perform the statistical parametric mapping analysis on the bone surface is available under an open-source license (www.github.com/gattia/pyKneeSPM).
For objective 1, we identified whether significant clusters of T2 or thickness change occurred using a one-sample difference test. Significant clusters of change show regions of consistent change in T2 or thickness across participants. For objective 2, we identified whether significant clusters of correlation between T2 or thickness change and either patellofemoral or tibiofemoral joint reaction forces existed. In our exploratory analysis (objective 3), we determined whether significant clusters of correlation between T2 or thickness change and the tibia or femur statistical shape model modes 1 existed. Significant clusters of correlations show regions of cartilage change (T2 or thickness) that are dependent on joint reaction forces and/or bone shape. Statistical parametric mapping was conducted for only walking data, only cycling data, and data from walking and cycling combined.
Regression analyses
For objective 4, we computed simple linear regressions between each of tibiofemoral compression and the resultant patellofemoral joint reaction force during gait with each of the first 3 statistical shape model modes.
Results
Participants
Data collection was interrupted by COVID-19 restrictions. Sixteen women were recruited and scheduled. Of these, three completed all visits (biomechanics and 2 × MRI). Another ten participants completed the biomechanics visit and at least one MRI visit (n = 4 walking visit, n = 6 cycling visit). As such, biomechanics and MRI data were available from 13 different participants; therefore, the statistical shape model includes 13 locally acquired knees. Demographics are included in Table 1. Three of 13 participants (only 1 that completed the walking MRI visit) were unable to maintain the Fr-defined walking speed (Table 1). These participants were negligibly slower than the Fr-defined speed (0.001 to 0.045 m/s).
Table 1.
Participant demographics*
| Cycling MRI visit (n = 6) | Walking MRI visit (n = 4) | Both MRI visits (n = 3) | |
|---|---|---|---|
| Age (years) | 61.7 ± 6.5 | 59.8 ± 5.7 | 65.3 ± 3.5 |
| Height (m) | 1.60 ± 0.04 | 1.66 ± 0.04 | 1.56 ± 0.03 |
| Mass (kg) | 76.1 ± 10.4 | 81.2 ± 10.4 | 64.2 ± 19.9 |
| Body mass index (kg/m2) | 29.8 ± 4.0 | 29.5 ± 4.1 | 26.2 ± 7.6 |
| Inseam length (m) | 0.75 ± 0.03 | 0.77 ± 0.03 | 0.73 ± 0.01 |
| Walking speed (m/s) | 1.42 ± 0.04 | 1.46 ± 0.04 | 1.39 ± 0.04 |
| Cadence (rpm) | 67.5 ± 6.1 | 70.3 ± 5.5 | |
| Power (watts) | 52.2 ± 21.6 | 52.7 ± 5.7 | |
| LEFS score (/80) | 58.7 ± 8.8 | 70.0 ± 0.8 | 57.0 ± 2.7 |
| n maintained Froude speed | 4 | 4 | 2 |
*Demographics (mean ± standard deviation) of women that completed just the cycling MRI visit, just the walking MRI visit, or both MRI visits. LEFS Lower Extremity Functional Scale; a higher LEFS score reflects better physical function
Cartilage response to activity
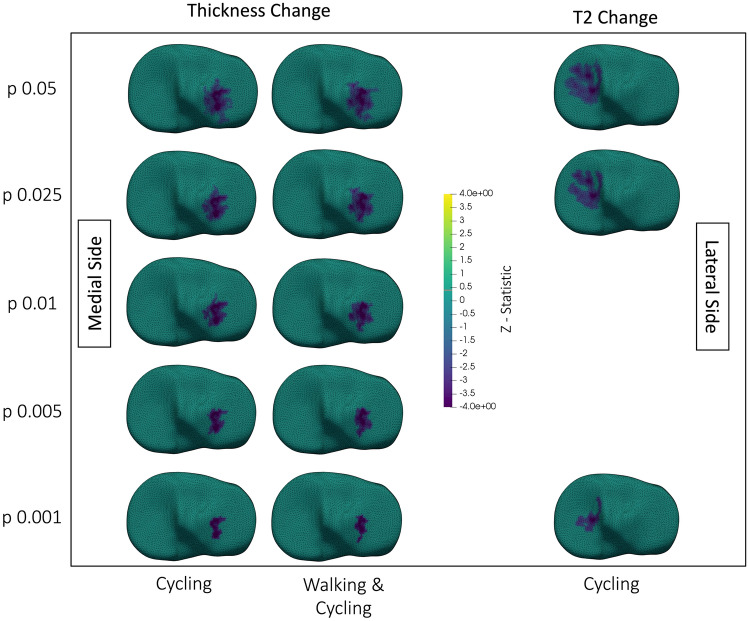
Cycling, as well as walking and cycling analyzed together, reduced cartilage thickness on the lateral tibial plateau (Fig. 2). Cycling reduced T2 on the medial tibial plateau (Fig. 2) and increased T2 along the lateral condyle (Fig. 3). On the lateral femoral condyle, cycling also caused a notable region of large, but insignificant, decrease in T2 adjacent to the region of significant increase (Fig. 4). Walking decreased T2 at the lateral trochlea (Fig. 3).
Fig. 2.
Superior view showing changes in tibial cartilage thickness (left two columns), and T2 (right column). The top is anterior, medial and lateral sides are labelled in the figure. Each tibial plateau shows the region of significant (p < 0.05) change after thresholding at the p-value on the y-axis. Walking & Cycling indicates that data from walking and cycling were combined in the analysis. Surfaces are colored by the z-statistic associated with the change, where purple indicates a decrease in T2 or thickness. Spaces with no surface mesh indicate no significant clusters. No column is provided for walking data because there were no significant changes when analyzing walking alone
Fig. 3.
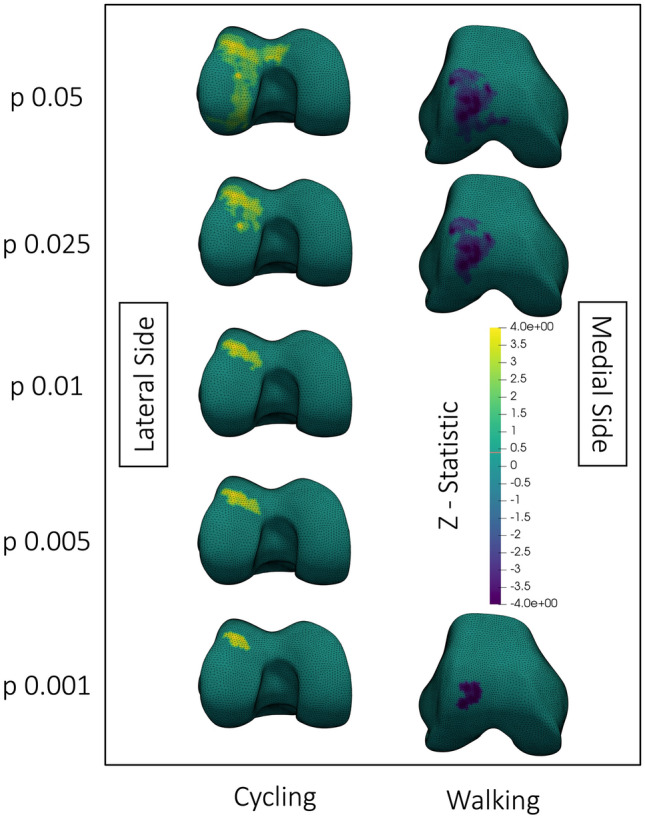
Inferior view (left column) and antero-inferior view (right column) of the changes in femoral cartilage T2 after walking or cycling. Medial and lateral sides are labelled in the figure. Each femoral surface mesh shows the region of significant (p < 0.05) change after thresholding at the p-value on the y-axis. Surfaces are colored by the z-statistic associated with the change, where purple indicates a decrease in T2 or thickness and yellow indicates an increase. Spaces with no surface mesh indicate no significant clusters. All surface meshes are of the right knee
Fig. 4.
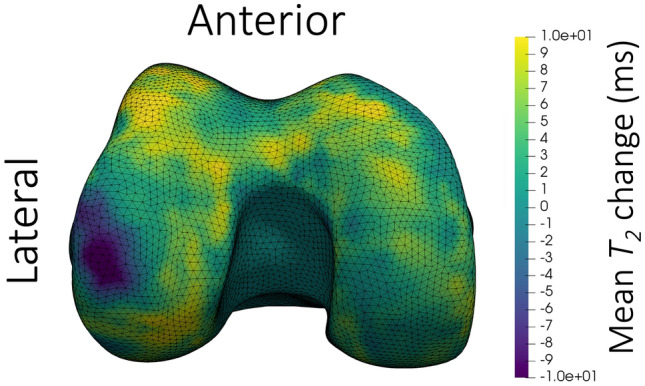
Inferior view of the mean change in femoral cartilage T2 after cycling for 25 min at a moderate 70–75% of maximum heart rate. The colormap shows decreases in T2 as purple and increases as yellow. The surface mesh is of a right knee; the anterior and lateral sides are labelled in the figure. A region of large magnitude decrease in T2 can be observed on the lateral weight-bearing femur, with primarily increased or negligible change in T2 throughout the rest of the surface
Relationships between joint reaction forces and cartilage change
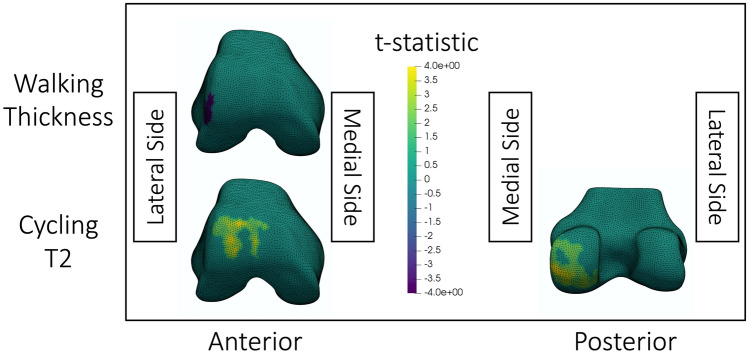
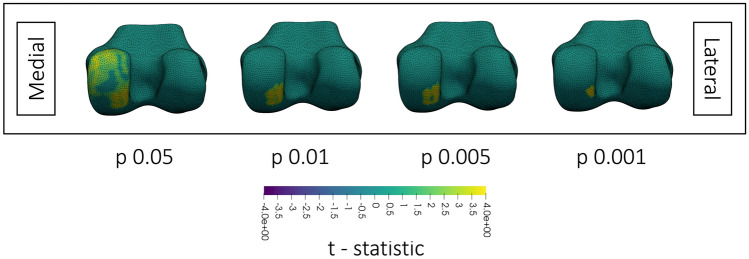
A greater tibiofemoral compressive joint reaction force during walking resulted in greater reduction in lateral femoral cartilage thickness after walking (Fig. 5). On the lateral trochlea and the posterior medial femoral condyle, greater tibiofemoral compression produced a greater increase in T2 after cycling.
Fig. 5.
Visualization of statistically significant (p < 0.05) clusters of correlations between the tibiofemoral compressive joint reaction force and cartilage change after walking or cycling. The top row shows significant correlations between changes in cartilage thickness after walking with peak tibiofemoral compression when thresholded at p = 0.01. The bottom row shows significant correlations between changes in T2 after cycling with peak tibiofemoral compression when thresholded at p = 0.05. The colormap shows t-statistics for the correlations, where yellow indicates positive correlations and purple indicates negative correlations. All meshes are of a right knee; the medial and lateral sides are labelled in the figure. The walking cluster was significant at thresholds p = 0.01, 0.005, and 0.001. The anterior cycling cluster was significant at thresholds p = 0.05 and 0.025. The posterior cycling cluster was significant at thresholds p = 0.05, 0.025 and p = 0.01. The displayed thresholds were chosen for consistency between visualizations within this figure
Statistical shape model
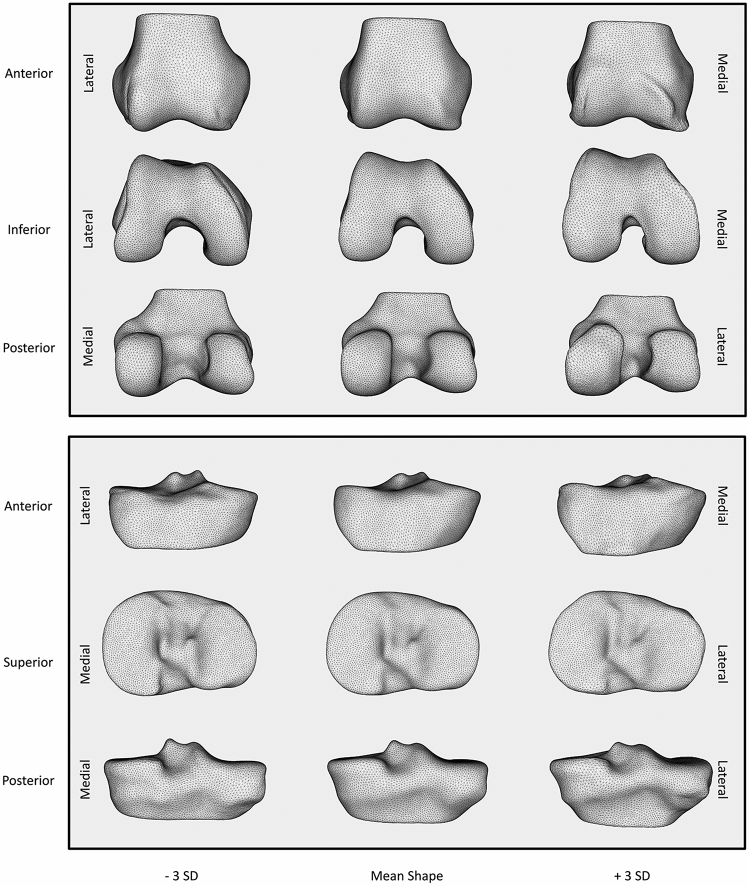
The mean shapes, as well as plus and minus three standard deviation shapes were plotted for statistical shape model modes 1 of the femur and tibia (Fig. 6). These visualizations were qualitatively interpreted. Positive values for the statistical shape model mode 1 for both the tibia and femur showed characteristic signs of OA. Tibia mode 1 (Fig. 6) had three main features. First, viewed anteriorly, increasing values corresponded with an increased height of the medial plateau. Second, when viewed superiorly, increasing values corresponded to widening the anterior lateral border of the lateral tibial plateau. Last, when viewed posteriorly, increasing values corresponded with greater concavity between the shaft and the tibial plateau indicating relative broadening. Femur mode 1 (Fig. 6) revealed one major feature: increasing values corresponded with an increased bone-cartilage-interface (BCI) surface area. This feature was best observed in the inferior view where the femoral condyles broaden [16, 18]. This broadening corresponded with a narrower intercondylar notch observed inferiorly and posteriorly. From an anterior view, increasing femur mode 1 corresponded with a ridge of osteophytes at the cartilage borders of the trochlea and weightbearing femur.
Fig. 6.
Visualization of mode 1 of the femur (top) and tibia (bottom) statistical shape models. The y-axis identifies the perspective displayed for that row. The x-axis identifies where on the continuum of the statistical shape model mode the visualization falls from – 3 standard deviations (SD) to + 3 SDs. The medial and lateral sides for each row are presented on the right and left borders
Relationships between statistical shape model and cartilage change
Cartilage thickness change and bone statistical shape model correlation
Analysing walking data only, increased tibia and femur modes 1 (interpreted as greater OA severity) corresponded with smaller reductions in lateral tibial cartilage thickness after walking (Fig. 7). Meanwhile, analysing walking and cycling together, we noted increased femur mode 1 (greater BCI surface area) corresponded with smaller reductions in medial tibial cartilage thickness (Fig. 7).
Fig. 7.
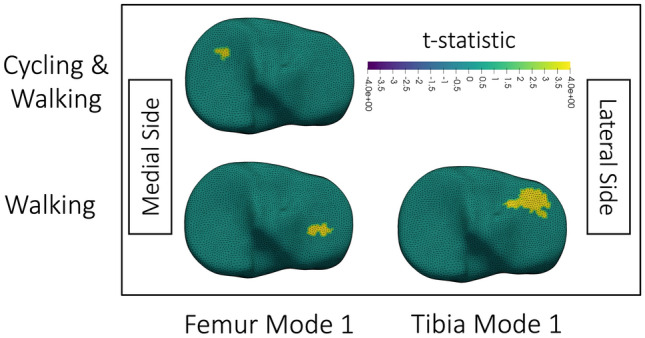
Visualization of clusters of significant (p < 0.05) correlation obtained after thresholding the t-statistic at p = 0.01; p = 0.01 was used because all displayed results were significant at this threshold. Correlations are between change in tibial cartilage thickness and the statistical shape model mode identified on the x-axis for data analyzed from activities listed on the y-axis. Cycling & Walking indicates that cycling and walking were analyzed together. No cycling column is included because no significant clusters existed for cycling data alone. The colormap shows the t-statistic for correlations, with positive t-statistics, and thus correlations, in yellow. The top is anterior. Medial and lateral sides are labelled in the figure. All visualizations are of the right knee. For femur mode 1 Cycling & Walking, the same significant cluster existed at thresholds of p = 0.01, 0.005, and 0.001. For femur mode 1 Walking data, the same significant cluster existed at thresholds of p = 0.01 and 0.005. For tibia mode 1 Walking data, the same significant cluster existed at p = 0.01 and 0.005
Cartilage T2 change and bone statistical shape model correlation
Correlations between T2 change and statistical shape model features occurred for the femur (Fig. 8) and tibia (Fig. 9). With the analysis of walking and cycling together, greater increases in T2 on the posterior medial femoral condyle occurred with higher femur statistical shape model mode 1 (Fig. 8). Following analysis of both activities, femoral and tibial bones with higher modes 1 showed smaller decreases in T2 on the tibial plateaus (Fig. 9). When analyzing cycling, higher femoral statistical shape model mode 1 resulted in smaller decreases in T2 on the lateral tibia (Fig. 9).
Fig. 8.
Visualization of clusters of significant (p < 0.05) correlation between change in femoral cartilage T2 and femoral statistical shape model mode 1 when analyzing data from walking and cycling together. Each femoral surface mesh shows the region of significant correlation after thresholding at the p-value on the x-axis. Surfaces are colored by the t-statistic associated with the change, where yellow indicates a positive t-statistic and correlation. All surface meshes are of the right knee; the medial and lateral sides are labelled in the figure
Fig. 9.
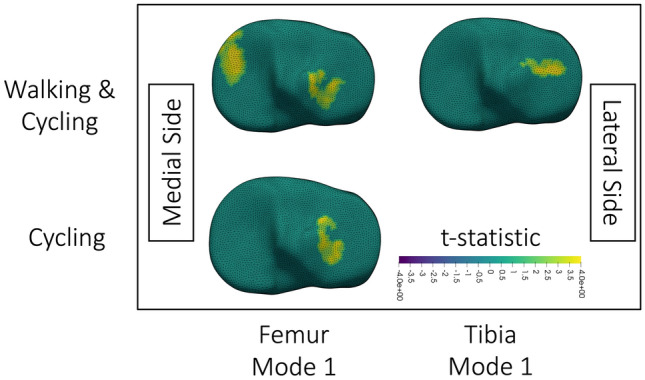
Visualization of clusters of significant correlation (p < 0.05) between change in tibial cartilage T2 and statistical shape model features when thresholded at p = 0.025; p = 0.025 was used because all displayed results were significant at this threshold. The x-axis identifies what statistical shape model mode was used in the correlation. The y-axis identifies what data was included in the analysis. The medial and lateral sides are labelled in the figure. Surfaces are colored by the t-statistic associated with the correlation, where yellow indicates a positive t-statistic and correlation. All surface meshes are of the right knee. The walking and cycling clusters were significant (p < 0.05) at every threshold level (p = 0.05, 0.025, 0.01, 0.005, 0.001). The cycling only cluster was significant (p < 0.05) at thresholds p = 0.05 and 0.025
Relationship between joint reaction forces and bone statistical shape model features
Femur statistical shape model mode 1 negatively related to the patellofemoral resultant joint reaction force (intercept = 555.7, beta coefficient = − 151.2, R2 = 0.4, p = 0.021) (Supplemental 2). Femur mode 1 explained 27% of the variance in tibiofemoral compression (intercept = 2017.1, beta coefficient = − 203.0, R2 = 0.27, p = 0.067) (Supplemental 2). All other correlations had R2 < 0.18 and p > 0.14.
Discussion
This work uniquely integrated biomechanical outcomes, measures of cartilage thickness and composition, and bone shape to explore the acute responses of osteoarthritic cartilage to physical activity. Statistical parametric mapping applied to the bone surface showed that walking and cycling caused distinct patterns of cartilage deformation, and that joint reaction forces correlated with focalized regions of cartilage change. The bone statistical shape models reflected features of OA [18, 19, 51] and these features were associated with the cartilage changes resulting from activity. Further, femurs with more severe OA had lower knee joint reaction forces during gait. Together these findings show that, among women with symptomatic knee OA, weight-bearing cartilage T2 and thickness decrease in response to loading; however, greater disease severity and differences in knee joint reaction forces modulate individual responses.
It is likely that weight-bearing physical activity exposure causes exudation of the fluid phase of cartilage from regions sustaining loading, resulting in deformation that reduces cartilage thickness and volume. This mechanism is consistent with findings highlighted in a systematic review on the influence of running on lower limb cartilage [52]. Exudation of free water from weight-bearing regions is thought to be a primary driver of decreased T2 [7, 53]. It is likely that water redistribution caused by loading is transient and recovers during unloading. Evidence supporting this recovery includes data showing ~ 80% of cartilage volume is recovered within 90 min of loading and a systematic review reported that recovery to baseline T2 and volume occurs within 24 h [52, 54]. The regions of significant T2 and thickness decrease observed in the current study primarily align with the weight-bearing regions of cartilage. Concurrently, the regions of increased T2 and cartilage thickness, particularly those that appeared significant in correlations with bone shape and JRFs, were observed in non-weight bearing regions. These findings suggest that the regions of increased T2 observed in the current study are caused, at least in part, by redistribution of free water from load-bearing to non-load-bearing regions.
Femoral cartilage deformation was associated with joint reaction forces. This finding corroborates a previous study that found lateral femoral cartilage deformation was related to tibiofemoral compression [12]. After walking, we found a cluster on the lateral trochlea that was thinned more with greater tibiofemoral compression. We concurrently found greater increases in T2 on the posterior medial condyle with greater tibiofemoral compression (Fig. 5). Increased T2 likely reflects mobile water redistribution away from regions of compression; [7, 54, 55] with more redistribution occurring with greater joint reaction forces.
Tibial plateau T2 and thickness decreased following loading in this sample (Fig. 2), coinciding with the regions of peak cartilage surface pressures during gait in previous work [5, 21]. After walking, trochlear T2 decreased, as hypothesized. However, after cycling, T2 on the lateral condyle increased (Fig. 3). The increased T2 may reflect water redistribution away from adjacent regions of insignificant T2 decrease (Fig. 4). The larger area where T2 increase was observed, compared to the region of decrease, may explain why the region of decrease was not statistically significant. Larger regions in different compartments could explain why tibial changes in T2 and thickness occurred on either the medial or lateral plateaus. Future work should compare statistical parametric mapping applied to the whole tibia versus each tibial plateau analyzed separately. These findings highlight that statistical parametric mapping may avoid challenges inherent in mean values of anatomically-defined cartilage subregions.
Femur statistical shape model mode 1 shows key features of OA. This single mode closely matches the OA versus non-OA axis of the 70-dimensional statistical shape model by Neogi and colleagues, which was also built from OAI data [18]. Our model, and previously published ones [18, 51] included broadening of the distal femoral cartilage surfaces, increased osteophytes, and narrowing of the intercondylar notch. Consistency between studies signifies robustness of these features.
The acute response of cartilage to a standardized load depends on the statistical shape model mode score. Since the statistical shape model reflected features of OA, this finding supports the Integrated Joint System theory, which hypothesizes that relationships between cartilage, mechanics, and bone differ over the disease spectrum [1]. For example, at the lateral tibial plateau, T2 decreased less with increasing tibia mode 1 that likely reflects OA severity. In this case, we propose broadening of the plateau may distribute forces over a larger area, reducing pressure leading to smaller cartilage changes. This theory is supported by the findings from Clouthier et al. which showed that a knee more characteristic of OA identified from mode 3 of their statistical shape model decreased absolute lateral tibial joint forces as well as lateral cartilage surface pressures during gait [21]. Alternatively, knees with severe OA changes may have had thinner cartilage in those locations and therefore had less to deform. At the posterior medial femoral condyle, increased OA severity led to greater increases in T2 after cycling. In this case, more severe OA knees with pathologic cartilage likely had greater fluid redistribution, which is congruent with the triphasic theory of cartilage [7, 54, 55]. Specifically, decreased collagen organization and proteoglycan content that is characteristic of OA reduces the net negative charge of the cartilage extracellular matrix, resulting in a smaller resistance to fluid flow and making cartilage more susceptible to deformation [55].
Knees more characteristic of OA had smaller joint reaction forces. Previous work supports our finding, showing that when walking at a constant speed (1.11 m/s) individuals with OA have lower compressive forces during gait than their healthy counterparts [56]. These works highlight that joint reaction forces during gait change with OA progression.
Due to collection restrictions imposed by COVID-19 this study was under-sampled. Permutation methods ensured accurate p-values for these participants. Inaccurate anatomical correspondences between bone surfaces after registration is the greatest source of error for the statistical shape model. However, alignment of statistical shape model mode 1 with previous models indicates convergent validity.
In women with symptomatic knee OA, walking and cycling caused distinct patterns of cartilage deformation that were dependent on knee joint reaction forces and bone morphology. Individuals with femurs more consistent with OA had smaller tibiofemoral joint reaction forces. This work highlights that bone shape is an important factor in understanding mechanics at the joint surface, and in understanding knee OA pathophysiology.
Supplementary Information
Below is the link to the electronic supplementary material.
Acknowledgements
We would like to acknowledge Emily Wiebenga and Elora Brenneman Wilson for assistance in data collection. We are very grateful to the Laboratory Manager of the Imaging Research Center at St. Joseph's Healthcare, Hamilton Ontario, Canada, Norm Konyer; as well as the Magnetic Resonance Imaging Technologists Carol Awde and Shannon Faseruk for their fastidious attention and guidance throughout this study. MRM holds the Arthritis Society Stars Mid-Career Development Award funded by the Canadian Institutes of Health Research-Institute of Musculoskeletal Health and Arthritis. This study was supported by a Network for Aging Research Catalyst Grant from the University of Waterloo (MRM, MDN), a Mitacs Accelerate (AAG, MRM: IT14939) a Natural Sciences and Engineering Research Council of Canada Discovery Grant (MRM #353715) and the Canadian Foundation for Innovation Leaders Opportunity Fund and the Ministry of Research and Innovation—Ontario Research Fund (MRM, PJK).
Declaration
Conflict of interest
AAG is the founder of NeuralSeg Ltd., a provider of medical image segmentation and analysis. No other authors have any declarations or conflicts.
Footnotes
Publisher's Note
Springer Nature remains neutral with regard to jurisdictional claims in published maps and institutional affiliations.
References
- 1.Edd SN, Omoumi P, Andriacchi TP, Jolles BM, Favre J. Modeling knee osteoarthritis pathophysiology using an integrated joint system (IJS): a systematic review of relationships among cartilage thickness, gait mechanics, and subchondral bone mineral density. Osteoarthritis Cartilage. 2018;26:1425–1437. doi: 10.1016/j.joca.2018.06.017. [DOI] [PubMed] [Google Scholar]
- 2.Scanlan SF, Favre J, Andriacchi TP. The relationship between peak knee extension at heel-strike of walking and the location of thickest femoral cartilage in ACL reconstructed and healthy contralateral knees. J Biomech. 2013;46:849–854. doi: 10.1016/j.jbiomech.2012.12.026. [DOI] [PubMed] [Google Scholar]
- 3.Koo S, Rylander JH, Andriacchi TP. Knee joint kinematics during walking influences the spatial cartilage thickness distribution in the knee. J Biomech. 2011;44:1405–1409. doi: 10.1016/j.jbiomech.2010.11.020. [DOI] [PMC free article] [PubMed] [Google Scholar]
- 4.Souza RB, Baum T, Wu S, Feeley BT, Kadel N, Li X, Link TM, Majumdar S. Effects of unloading on knee articular cartilage T1rho and T2 magnetic resonance imaging relaxation times: a case series. J Orthop Sports Phys Ther. 2012;42:511–520. doi: 10.2519/jospt.2012.3975. [DOI] [PMC free article] [PubMed] [Google Scholar]
- 5.Van Rossom S, Smith CR, Zevenbergen L, Thelen DG, Vanwanseele B, Van Assche D, Jonkers I. Knee cartilage thickness, T1ρ and T2 relaxation time are related to articular cartilage loading in healthy adults. PLoS ONE. 2017;12:e0170002. doi: 10.1371/journal.pone.0170002. [DOI] [PMC free article] [PubMed] [Google Scholar]
- 6.Atkinson HF, Birmingham TB, Moyer RF, Yacoub D, Kanko LE, Bryant DM, Thiessen JD, Thompson RT. MRI T2 and T1ρ relaxation in patients at risk for knee osteoarthritis: a systematic review and meta-analysis. BMC Musculoskelet Disord. 2019;20:182. doi: 10.1186/s12891-019-2547-7. [DOI] [PMC free article] [PubMed] [Google Scholar]
- 7.Choi J-A, Gold GE. MR imaging of articular cartilage physiology. Magn Reson Imaging Clin N Am. 2011;19:249–282. doi: 10.1016/j.mric.2011.02.010. [DOI] [PMC free article] [PubMed] [Google Scholar]
- 8.Blazek K, Favre J, Asay J, Erhart-Hledik J, Andriacchi T. Age and obesity alter the relationship between femoral articular cartilage thickness and ambulatory loads in individuals without osteoarthritis. J Orthop Res. 2014;32:394–402. doi: 10.1002/jor.22530. [DOI] [PubMed] [Google Scholar]
- 9.Erhart-Hledik JC, Favre J, Andriacchi TP. New insight in the relationship between regional patterns of knee cartilage thickness, osteoarthritis disease severity, and gait mechanics. J Biomech. 2015;48:3868–3875. doi: 10.1016/j.jbiomech.2015.09.033. [DOI] [PubMed] [Google Scholar]
- 10.Vanwanseele B, Eckstein F, Smith RM, Lange AK, Foroughi N, Baker MK, Shnier R, Fiatarone Singh MA. The relationship between knee adduction moment and cartilage and meniscus morphology in women with osteoarthritis. Osteoarthritis Cartilage. 2010;18:894–901. doi: 10.1016/j.joca.2010.04.006. [DOI] [PubMed] [Google Scholar]
- 11.Maly MR, Acker SM, Totterman S, Tamez-Peña J, Stratford PW, Callaghan JP, Adachi JD, Beattie KA. Knee adduction moment relates to medial femoral and tibial cartilage morphology in clinical knee osteoarthritis. J Biomech. 2015;48:3495–3501. doi: 10.1016/j.jbiomech.2015.04.039. [DOI] [PubMed] [Google Scholar]
- 12.Boocock M, McNair P, Cicuttini F, Stuart A, Sinclair T. The short-term effects of running on the deformation of knee articular cartilage and its relationship to biomechanical loads at the knee. Osteoarthritis Cartilage. 2009;17:883–890. doi: 10.1016/j.joca.2008.12.010. [DOI] [PubMed] [Google Scholar]
- 13.Brenneman Wilson EC, Gatti AA, Maly MR. A new technique to evaluate the impact of running on knee cartilage deformation by region. Magn Reson Mater Phys Biol Med. 2021 doi: 10.1007/s10334-020-00896-8. [DOI] [PubMed] [Google Scholar]
- 14.Gatti AA, Noseworthy MD, Stratford PW, Brenneman EC, Totterman S, Tamez-Peña J, Maly MR. Acute changes in knee cartilage transverse relaxation time after running and bicycling. J Biomech. 2017;53:171–177. doi: 10.1016/j.jbiomech.2017.01.017. [DOI] [PubMed] [Google Scholar]
- 15.Kellgren JH, Lawrence JS. Radiological assessment of osteo-arthrosis. Ann Rheum Dis. 1957;16:494–502. doi: 10.1136/ard.16.4.494. [DOI] [PMC free article] [PubMed] [Google Scholar]
- 16.Barr AJ, Campbell TM, Hopkinson D, Kingsbury SR, Bowes MA, Conaghan PG. A systematic review of the relationship between subchondral bone features, pain and structural pathology in peripheral joint osteoarthritis. Arthritis Res Ther. 2015 doi: 10.1186/s13075-015-0735-x. [DOI] [PMC free article] [PubMed] [Google Scholar]
- 17.Hunter DJ, Nevitt M, Lynch J, Kraus VB, Katz JN, Collins JE, Bowes M, Guermazi A, Roemer FW, Losina E. Longitudinal validation of periarticular bone area and 3D shape as biomarkers for knee OA progression? Data from the FNIH OA Biomarkers Consortium. Ann Rheum Dis. 2016;75:1607–1614. doi: 10.1136/annrheumdis-2015-207602. [DOI] [PubMed] [Google Scholar]
- 18.Neogi T, Bowes MA, Niu J, De Souza KM, Vincent GR, Goggins J, Zhang Y, Felson DT. Magnetic resonance imaging-based three-dimensional bone shape of the knee predicts onset of knee osteoarthritis: data from the osteoarthritis initiative: 3-D bone shape predicts incident knee OA. Arthritis Rheum. 2013;65:2048–2058. doi: 10.1002/art.37987. [DOI] [PMC free article] [PubMed] [Google Scholar]
- 19.Pedoia V, Lansdown DA, Zaid M, McCulloch CE, Souza R, Ma CB, Li X. Three-dimensional MRI-based statistical shape model and application to a cohort of knees with acute ACL injury. Osteoarthritis Cartilage. 2015;23:1695–1703. doi: 10.1016/j.joca.2015.05.027. [DOI] [PMC free article] [PubMed] [Google Scholar]
- 20.Gao KT, Pedoia V, Young KA, Kogan F, Koff MF, Gold GE, Potter HG, Majumdar S. Multiparametric MRI characterization of knee articular cartilage and subchondral bone shape in collegiate basketball players. J Orthop Res. 2020;39:1512–1522. doi: 10.1002/jor.24851. [DOI] [PMC free article] [PubMed] [Google Scholar]
- 21.Clouthier AL, Smith CR, Vignos MF, Thelen DG, Deluzio KJ, Rainbow MJ. The effect of articular geometry features identified using statistical shape modelling on knee biomechanics. Med Eng Phys. 2019;66:47–55. doi: 10.1016/j.medengphy.2019.02.009. [DOI] [PMC free article] [PubMed] [Google Scholar]
- 22.Altman R, Asch E, Bloch D, Bole G, Borenstein D, Brandt K, Christy W, Cooke TD, Greenwald R, Hochberg M, et al. Development of criteria for the classification and reporting of osteoarthritis: classification of osteoarthritis of the knee. Arthritis Rheum. 1986;29:1039–1049. doi: 10.1002/art.1780290816. [DOI] [PubMed] [Google Scholar]
- 23.Kennedy DM, Stratford PW, Robarts S, Gollish JD. Using outcome measure results to facilitate clinical decisions the first year after total hip arthroplasty. J Orthop Sports Phys Ther. 2011;41:232–239. doi: 10.2519/jospt.2011.3516. [DOI] [PubMed] [Google Scholar]
- 24.Pre-Screening for Physical Activity: Get Active Questionnaire. Canadian Society for Exercise Physiology
- 25.Paranjape CS, Cutcliffe HC, Grambow SC, Utturkar GM, Collins AT, Garrett WE, Spritzer CE, DeFrate LE. A new stress test for knee joint cartilage. Sci Rep. 2019 doi: 10.1038/s41598-018-38104-2. [DOI] [PMC free article] [PubMed] [Google Scholar]
- 26.Gatti AA, Keir PJ, Noseworthy MD, Beauchamp MK, Maly MR. Hip and ankle kinematics are the most important predictors of knee joint loading during bicycling. J Sci Med Sport. 2020 doi: 10.1016/j.jsams.2020.07.001. [DOI] [PubMed] [Google Scholar]
- 27.Gatti AA, Keir PJ, Noseworthy MD, Beauchamp MK, Maly MR. Equations to prescribe bicycle saddle height based on desired joint kinematics and bicycle geometry. Eur J Sport Sci. 2021 doi: 10.1080/17461391.2021.1902570. [DOI] [PubMed] [Google Scholar]
- 28.Beekley MD, Brechue WF, deHoyos DV, Garzarella L, Werber-Zion G, Pollock ML. Cross-validation of the YMCA submaximal cycle ergometer test to predict VO2max. Res Q Exerc Sport. 2004;75:337–342. doi: 10.1080/02701367.2004.10609165. [DOI] [PubMed] [Google Scholar]
- 29.Tanaka H, Monahan KD, Seals DR. Age-predicted maximal heart rate revisited. J Am Coll Cardiol. 2001;37:153–156. doi: 10.1016/s0735-1097(00)01054-8. [DOI] [PubMed] [Google Scholar]
- 30.Eckstein F, Hudelmaier M, Putz R. The effects of exercise on human articular cartilage. J Anat. 2006;208:491–512. doi: 10.1111/j.1469-7580.2006.00546.x. [DOI] [PMC free article] [PubMed] [Google Scholar]
- 31.Ehrig RM, Taylor WR, Duda GN, Heller MO. A survey of formal methods for determining the centre of rotation of ball joints. J Biomech. 2006;39:2798–2809. doi: 10.1016/j.jbiomech.2005.10.002. [DOI] [PubMed] [Google Scholar]
- 32.Harrington ME, Zavatsky AB, Lawson SEM, Yuan Z, Theologis TN. Prediction of the hip joint centre in adults, children, and patients with cerebral palsy based on magnetic resonance imaging. J Biomech. 2007;40:595–602. doi: 10.1016/j.jbiomech.2006.02.003. [DOI] [PubMed] [Google Scholar]
- 33.Delp SL, Anderson FC, Arnold AS, Loan P, Habib A, John CT, Guendelman E, Thelen DG. OpenSim: open-source software to create and analyze dynamic simulations of movement. IEEE Trans Biomed Eng. 2007;54:1940–1950. doi: 10.1109/TBME.2007.901024. [DOI] [PubMed] [Google Scholar]
- 34.Steele KM, DeMers MS, Schwartz MH, Delp SL. Compressive tibiofemoral force during crouch gait. Gait Posture. 2012;35:556–560. doi: 10.1016/j.gaitpost.2011.11.023. [DOI] [PMC free article] [PubMed] [Google Scholar]
- 35.Gatti AA, Maly MR. Accuracy of estimates of cumulative load during a confined activity: bicycling. Int Biomech. 2019;6:66–74. doi: 10.1080/23335432.2019.1642141. [DOI] [PMC free article] [PubMed] [Google Scholar]
- 36.Gatti AA, Maly MR. Automatic knee cartilage and bone segmentation using multi-stage convolutional neural networks: data from the osteoarthritis initiative. Magn Reson Mater Phys. 2021;34:859–875. doi: 10.1007/s10334-021-00934-z. [DOI] [PubMed] [Google Scholar]
- 37.Fedorov A, Beichel R, Kalpathy-Cramer J, Finet J, Fillion-Robin J-C, Pujol S, Bauer C, Jennings D, Fennessy F, Sonka M, Buatti J, Aylward S, Miller JV, Pieper S, Kikinis R. 3D Slicer as an image computing platform for the Quantitative Imaging Network. Magn Reson Imaging. 2012;30:1323–1341. doi: 10.1016/j.mri.2012.05.001. [DOI] [PMC free article] [PubMed] [Google Scholar]
- 38.Lorensen WE, Cline HE. Marching cubes: a high resolution 3D surface construction algorithm. ACM SIGGRAPH Comput Graph. 1987;21:7. [Google Scholar]
- 39.Mun D, Kim BC. Three-dimensional solid reconstruction of a human bone from CT images using interpolation with triangular Bézier patches. J Mech Sci Technol. 2017;31:3875–3886. [Google Scholar]
- 40.Valette S, Chassery J-M. Approximated centroidal voronoi diagrams for uniform polygonal mesh coarsening. Comput Graph Forum. 2004;23:381–389. [Google Scholar]
- 41.Valette S, Chassery J-M, Prost R. Generic remeshing of 3D triangular meshes with metric-dependent discrete voronoi diagrams. IEEE Trans Visual Comput Graphics. 2008;14:369–381. doi: 10.1109/TVCG.2007.70430. [DOI] [PubMed] [Google Scholar]
- 42.Wirth W, Eckstein F, Kemnitz J, Baumgartner CF, Konukoglu E, Fuerst D, Chaudhari AS. Accuracy and longitudinal reproducibility of quantitative femorotibial cartilage measures derived from automated U-Net-based segmentation of two different MRI contrasts: data from the osteoarthritis initiative healthy reference cohort. Magn Reson Mater Phys Biol Med. 2020 doi: 10.1007/s10334-020-00889-7. [DOI] [PMC free article] [PubMed] [Google Scholar]
- 43.MacKay JW, Kaggie JD, Treece GM, McDonnell SM, Khan W, Roberts AR, Janiczek RL, Graves MJ, Turmezei TD, McCaskie AW, Gilbert FJ. Three-dimensional surface-based analysis of cartilage MRI data in knee osteoarthritis: validation and initial clinical application. J Magn Reson Imaging. 2020 doi: 10.1002/jmri.27193. [DOI] [PubMed] [Google Scholar]
- 44.Peterfy CG, Schneider E, Nevitt M. The osteoarthritis initiative: report on the design rationale for the magnetic resonance imaging protocol for the knee. Osteoarthritis Cartilage. 2008;16:1433–1441. doi: 10.1016/j.joca.2008.06.016. [DOI] [PMC free article] [PubMed] [Google Scholar]
- 45.Lombaert H, Grady L, Polimeni JR, Cheriet F. FOCUSR: feature oriented correspondence using spectral regularization—a method for precise surface matching. IEEE Trans Pattern Anal Mach Intell. 2013;35:2143–2160. doi: 10.1109/TPAMI.2012.276. [DOI] [PMC free article] [PubMed] [Google Scholar]
- 46.Shlens J (2014) A tutorial on principal component analysis. Ar Xiv:1404.1100 [cs, stat]
- 47.Cox RW, Chen G, Glen DR, Reynolds RC, Taylor PA. FMRI clustering in AFNI: false-positive rates redux. Brain Connectivity. 2017;7:152–171. doi: 10.1089/brain.2016.0475. [DOI] [PMC free article] [PubMed] [Google Scholar]
- 48.Eklund A, Nichols TE, Knutsson H. Cluster failure: Why fMRI inferences for spatial extent have inflated false-positive rates. Proc Natl Acad Sci. 2016;113:7900–7905. doi: 10.1073/pnas.1602413113. [DOI] [PMC free article] [PubMed] [Google Scholar]
- 49.Legendre P, Legendre L, Legendre L. Numerical ecology. New York: Elsevier, Amsterdam; 1998. [Google Scholar]
- 50.Nichols TE, Holmes AP. Nonparametric permutation tests for functional neuroimaging: a primer with examples. Hum Brain Mapp. 2002;15:1–25. doi: 10.1002/hbm.1058. [DOI] [PMC free article] [PubMed] [Google Scholar]
- 51.Barr AJ, Dube B, Hensor EMA, Kingsbury SR, Peat G, Bowes MA, Sharples LD, Conaghan PG. The relationship between three-dimensional knee MRI bone shape and total knee replacement—a case control study: data from the Osteoarthritis Initiative. Rheumatology. 2016;55:1585–1593. doi: 10.1093/rheumatology/kew191. [DOI] [PMC free article] [PubMed] [Google Scholar]
- 52.Khan MCM, O’Donovan J, Charlton JM, Roy J-S, Hunt MA, Esculier J-F. The influence of running on lower limb cartilage: a systematic review and meta-analysis. Sports Med. 2021 doi: 10.1007/s40279-021-01533-7. [DOI] [PubMed] [Google Scholar]
- 53.Palmer AJR, Brown CP, McNally EG, Price AJ, Tracey I, Jezzard P, Carr AJ, Glyn-Jones S. Non-invasive imaging of cartilage in early osteoarthritis. Bone Joint J. 2013;95-B:738–746. doi: 10.1302/0301-620X.95B6.31414. [DOI] [PubMed] [Google Scholar]
- 54.Eckstein F, Tieschky M, Faber S, Englmeier K-H, Reiser M. Functional analysis of articular cartilage deformation, recovery, and fluid flow following dynamic exercise in vivo. Anat Embryol. 1999;200:419–424. doi: 10.1007/s004290050291. [DOI] [PubMed] [Google Scholar]
- 55.Lu XL, Mow VC. Biomechanics of articular cartilage and determination of material properties. Med Sci Sports Exerc. 2008;40:193–199. doi: 10.1249/mss.0b013e31815cb1fc. [DOI] [PubMed] [Google Scholar]
- 56.Henriksen M, Simonsen EB, Alkjær T, Lund H, Graven-Nielsen T, Danneskiold-Samsøe B, Bliddal H. Increased joint loads during walking—a consequence of pain relief in knee osteoarthritis. Knee. 2006;13:445–450. doi: 10.1016/j.knee.2006.08.005. [DOI] [PubMed] [Google Scholar]
Associated Data
This section collects any data citations, data availability statements, or supplementary materials included in this article.


