Abstract
Objective:
During the COVID-19 pandemic, states have had to confront a drug overdose problem associated with the pandemic. The objective of this study was to identify the impact of the COVID-19 pandemic on the opioid epidemic in the state of Ohio by describing the changes in the quarterly opioid overdose deaths (OOD) over the last 10 years.
Methods:
This longitudinal study included OOD data from death records obtained through the Ohio Department of Health. Temporal trend analysis and visualizations were performed on the OOD death rate per 100,000 quarterly from 2010 to 2020. Age, sex, and ethnicity were also analyzed.
Results:
The OOD rate of 11.15 in Q2 of 2020 was statistically equivalent to the previous peak level of 10.87 in Q1 of 2017. There was a significant increase in the OOD rate from Q1 to Q2 of 2020 and a significant difference between the actual Q2 of 2020 OOD rate and the predicted OOD rate. The poisoning indicator fentanyl was present in 94% of OOD during Q2 of 2020. The total number of OOD remains highest in the White population. There was no significant difference between the actual and predicted OOD rates in the Black population of Q2 of 2020 based on the trend line. However, the OOD rate of 14.29 in Q2 of 2020 was significantly higher than the previous peak level of 8.34 in Q2 of 2017. The Q2 of 2020 OOD rates for 18 to 39 and 40+ age groups were significantly higher from what would be expected from the trend predictions.
Conclusions:
Based on these findings, Ohio has entered a COVID-19 pandemic mediated fourth wave in the opioid epidemic. These findings further suggest that as efforts are made to address the worldwide COVID-19 pandemic, states need to maintain their vigilance toward combating the local opioid epidemic.
Keywords: COVID19, opioid epidemic, overdose
In 2020, the opioid epidemic in the United States was eclipsed by the worldwide COVID-19 pandemic. As normal routines were disrupted during the first quarter of 2020 by the pandemic, states had to confront a drug overdose problem associated with the mental health issues created by social isolation, increased mental illness, and limitation in harm reduction strategies during the second quarter of 2020.1 In 2018, the Centers for Disease Control (CDC) reported a 4% reduction in opioid overdose deaths (OUDs) from the prior year.2 However, the OOD rate that year remained nearly 4 times higher than in 1999. Most of the improvements seen in 2018 have been lost and recent CDC data shows that the drug overdose rate increased 18.2% in the 12-month period ending in June 2019 to the end of May 2020.2 The opioid epidemic is currently described in three waves.3 The first wave began in the 1990s with prescription opioids contributing to the majority of overdose deaths. The second wave began in 2010 with heroin contributing to the largest percentage of overdose deaths.4 The third wave followed in 2013 with clandestinely produced fentanyl and synthetic forms of fentanyl.5
In the US, the population most commonly hospitalized for opioid overdoses is White and in the lowest quartile of median household income.6 In general, this trend is consistent with drug overdose, which is concentrated among the middle-age socioeconomically disadvantaged White population.7 Similarly, the COVID-19 pandemic has been speculated to disproportionately affect the poor.8 Further, poor White communities that have been negatively impacted by the opioid epidemic, have been predicted to be extremely susceptible to the impact of the COVID-19 pandemic.9 A recent report, however, showed a shift in the number of OOD among the Black and White populations in Philadelphia.10 In this study, the death rate among the Black population increased by greater than 50%, but remained flat or declined in the White population.10 Before the COVID-19 pandemic, the rate (deaths per 100,000) of OOD among the Black population exceeded that of Whites in several states.11 The effects of the COVID-19 pandemic on the opioid epidemic further point to racial health disparities in nonfatal opioid-related overdose emergency room visits.12
Ohio has the second-highest drug overdose rate in the US.13 Before the COVID-19 pandemic, the peak in Ohio OOD occurred in 2017 with 4293 OOD,14 which accounted for 187,006 overdose-related years of life lost.15 In the last decade, the years of life lost in Ohio was estimated to be over 1 million.15 Rules and regulations implemented at the state level in response to the COVID-19 pandemic increased the stressors and obstacles that adults with substance use disorder must face to obtain treatment.16 Here, we examine the changes in OOD and demographic data during the COVID-19 pandemic and compare those quarterly findings from 2010 to 2020 in Ohio.
METHODS
Data Collection
This longitudinal, observational study included data from the records obtained from the Ohio Department of Health (ODH). The ODH database was quarried in the following fashion. ODH manages the Ohio Public Health Information Warehouse. The current study examined the Mortality dataset for deaths in Ohio related to opioids. These data are updated by the Ohio county coroners. To filter the data to include only deaths involving opioids, we used the Mortality Ohio Resident Deaths Report Builder. The filter variables for each report included the year and opiates as the poisoning indicator. The column variable sorted the data into months. The row variable was utilized to gather information beyond the total number of deaths relating to opioids to account for geographic locations, sex, race, and age. The race categories available through the ODH included White, Black, American Indian or Alaskan Native, Asian or Pacific Islander, Other, and Unknown. Our final presentation of data limited the race categories to Black and White populations due to the negligible numbers of opioid overdose deaths in other race categories. For the same reason, the final data reflects the 18 to 39 and 40+ age categories. The monthly death counts are presented in quarters from 2010 to 2020.
Temporal Trend Analysis
Temporal trend analyses were utilized to identify significant changes in trends of the quarterly OOD rate per 100,000 from Q1 of 2010 to Q2 of 2020. These analyses were implemented in R with the CausalIimpact package. The temporal trend analysis uses the Bayesian structural time-series model to fit the data points and then uses the fitted model to predict the ODD rate per 100,000 as if no intervention had ever occurred. The differences between the expected values and the actual values are used to identify potential significant changes in trends, such that a significant time point, or period identified is considered to indicate that some unknown intervention may have occurred.
Additionally, the poisson regression model was utilized to fit the quarterly ODD rate per 100,000 in 2 segments, the first segment being from Q1 of 2020 to Q4 of 2017, and the second segment is from Q1 of 2018 to Q2 of 2020.
Test of Significant Difference
Following the temporal trend analysis, tests of significant difference were performed between the OOD rate of Q2 2020 and (1) the predicted OOD rate based on the trend line, and (2) the previous peak rate observed in 2017, for overall OOD rate, OOD rates by gender, by ethnicity, and by age groups.
RESULTS
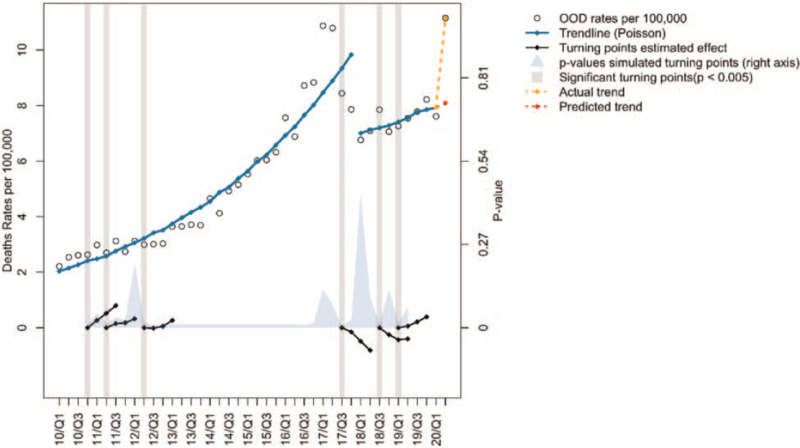
The temporal trend analysis of the quarterly overall OOD rate per 100,000 from 2010 to 2020 is shown in Figure 1. The historical peak in Q1 of 2017 has been discussed extensively in the literature.17 There is a reduction in the OOD rate from Q1 of 2017 to Q4 of 2017, and a gradual increase in the OOD rate since 2018. Because these 2 segments of data points, one from Q1 of 2010 to Q4 of 2017 and the other from Q1 of 2018 to Q2 of 2020, present very different trends, we conducted temporal trend analysis for each segment of data points separately. There is a significant upward trend again from Q1 to Q2 of 2020, as indicated by the trend line, and by the significant difference between the actual Q2 of 2020 OOD rate and the predicted OOD rate of Q2 of 2020 (Table 1). Nevertheless, the OOD rate of 11.15 per 100,000 in Q2 of 2020 is not significantly different from the peak level of 10.87 per 100,000 in Q1 of 2017 (Table 1). The poisoning indicator fentanyl was present in 94% of OOD during this Q2 period of 2020.
FIGURE 1.
Temporal trend analysis of the overall quarterly OOD rate per 100,000 from Q1 of 2010 to Q2 of 2020. Refer to Figure 1 for the legend key. OOD indicates opioid overdose deaths.
TABLE 1.
Comparisons Between Actual Q2 of 2020 and Predicted Q2 of 2020 OOD Rates, and Between Q2 of 2020 and Q1 of 2017 OOD Rates
| Rates | Actual Q2 2020–Predicted Q2 2020 | Q2 2020–Q1 2017 | |||||||
| Group | Actual Q2 2020 | Predicted Q2 2020 | Q1 2017 | Diff. | 95% CI | P | Diff. | 95% CI | P |
| Overall | 11.15 | 8.09 | 10.87 | 3.06 | (0, 6.124) | <0.001 | 0.28 | (−0.0001, 0.567) | 0.52 |
| Race/Ethnicity∗ | |||||||||
| White | 11.13 | 8.29 | 11.8 | 2.84 | (0, 5.672) | <0.001 | −0.67 | (−0.0001, 1.34) | 0.17 |
| Black | 14.29 | 13.05 | 8.34† | 1.24 | (0, 2.486) | 0.36 | 5.95 | (0.0005, 11.7) | <0.001 |
| Sex | |||||||||
| Male | 15.87 | 11.55 | 14.7 | 4.32 | (0, 8.634) | <0.001 | 1.17 | (−0.0001, 5.672) | 0.11 |
| Female | 6.61 | 4.06 | 7.19 | 2.55 | (0, 5.102) | <0.001 | −0.58 | (−0.0001, 1.16) | 0.23 |
| Age | |||||||||
| 18–39 | 19.61 | 12.86 | 19.37 | 6.75 | (0, 5.055) | <0.001 | 0.24 | (−0.0001, 0.487) | 0.82 |
| 40+ | 11.16 | 8.53 | 10.67 | 2.63 | (0, 5.672) | <0.001 | 0.49 | (−0.0001, 0.784) | 0.57 |
The difference of OOD rates in Q2 of 2020 between White and Black Americans is -3.16, with 95% CI being (-1.105, -5.215) and statistically significant P = 0.002.
The previous peak OOD rate for Black Americans was recorded in Q2 of 2017.
OOD indicates opioid overdose deaths.
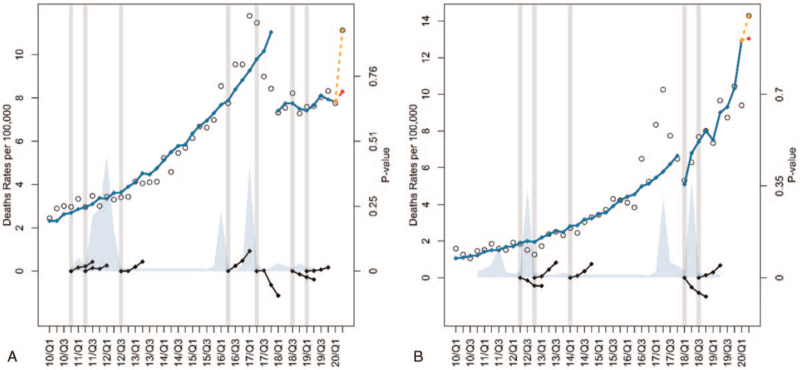
The temporal trend analyses of the quarterly OOD rates per 100,000 for the White and Black populations are shown in Figure 2. For the White population, there is a significant upward trend from Q1 to Q2 of 2020, as indicated by the trend line, and by the significant difference between the actual Q2 of 2020 rate of 11.13 and the predicted Q2 of 2020 rate of 8.29 (Table 1). The OOD rate for the Black population has been increasing more steadily and steeply since the beginning of 2018. In fact, there is no significant difference between the actual and predicted rates of Q2 of 2020 based on the trend line (Table 1). However, the OOD rate of 14.29 per 100,000 in Q2 of 2020 is significantly higher than the previous peak level of 8.34 in Q2 of 2017 in the Black population (Table 1).
FIGURE 2.
Temporal trend analysis of the quarterly OOD rate per 100,000 for the White (A) and Black (B) populations from Q1 of 2010 to Q2 of 2020. Refer to Figure 1 for the legend key. OOD indicates opioid overdose deaths.
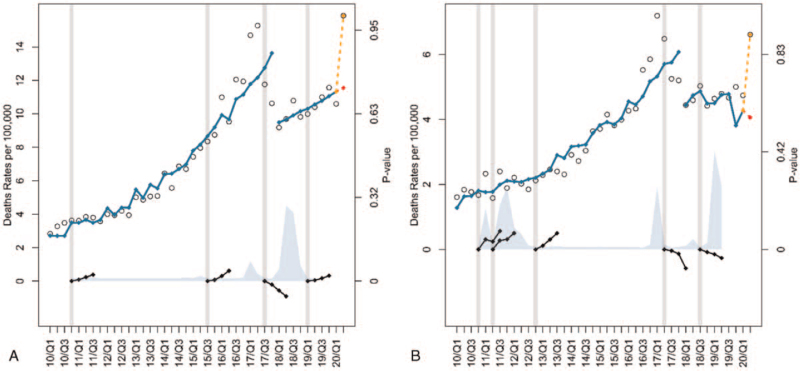
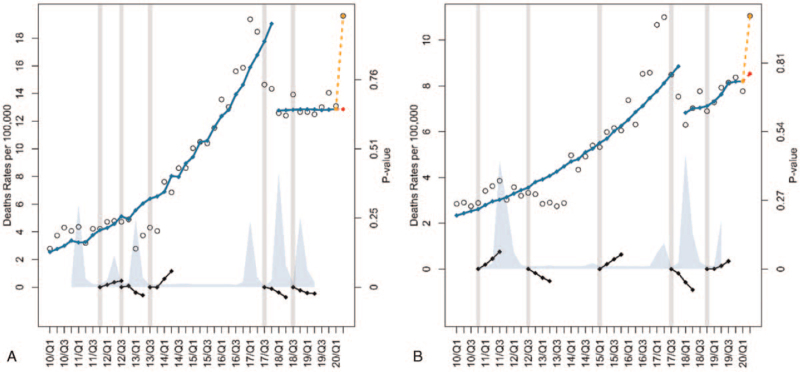
The temporal trend analyses of the quarterly OOD rates per 100,000 for the male and female populations are shown in Figure 3. For both male and female populations, the actual OOD rates per 100,000 of Q2 of 2020 represent significant deviations from the trend predictions (Table 1). However, the Q2 of 2020 rates for both male and female populations are not significantly different from their respective peak levels in 2017 (Table 1). Similar observations can be made from the temporal trend analyses of the quarterly OOD rates per 100,000 for 18 to 39 and 40+ age groups shown in Figure 4. That is, for both age groups, the actual OOD rates per 100,000 of Q2 of 2020 represent significant deviations from what would be expected from the trend predictions (Table 1). However, the Q2 of 2020 rates for both age groups are not significantly different from their respective peak levels in 2017 (Table 1).
FIGURE 3.
Temporal trend analysis of the quarterly OOD rate per 100,000 for males (A) and females (B) from Q1 of 2010 to Q2 of 2020. Refer to Figure 1 for the legend key. OOD indicates opioid overdose deaths.
FIGURE 4.
Temporal trend analysis of the quarterly OOD rate per 100,000 for age groups (A) 18–39 and (B) 40+ from Q1 of 2010 to Q2 of 2020. Refer to Figure 1 for the legend key. OOD indicates opioid overdose deaths.
DISCUSSION
Amidst the COVID-19 pandemic, the OOD rate in Ohio reached a high-level equivalent to the previous peak level observed in 2017. During the COVID-19 pandemic, which began in mid-March of 2020, there was shift in attention from the opioid epidemic to the COVID-19 pandemic that resulted in a disruption of needed services for SUD patients. The Addiction Policy Forum found that 34% of the 1079 SUD respondents reported changes or disruptions in accessing treatment or recovery services, 14% were unable to receive their needed services and 2% could not access naloxone during the COVID-19 pandemic.18 With our attention diverted, all sociodemographic groups experienced increases in the total number and rate of OOD. Because of this increase in OOD, public health and harm reduction strategies need to be implemented to address the opioid epidemic, which has now surged during the COVID-19 pandemic.19
National data shows that OOD related to fentanyl has surpassed overdose deaths due to heroin or prescription opioids.20 Consistent with these national findings, in the present study, the majority of the OOD included the poisoning indicator fentanyl. Economists suggest that although the pandemic interrupted the supply of opioids, the “market” solution involved mixing fentanyl and other additives to opioids like heroin.21
Between 2017 and 2018, Ohio experienced the “largest absolute decrease” in drug overdose deaths relating to opioids.22 Despite Ohio's progress in its efforts to combat the opioid epidemic with education and prevention, the trend of OOD rates is now increasing during the COVID-19 pandemic. Data from the ODH emphasizes the concerning upward trend in OOD rates for adults 40 years of age and older. Based on this data, the increase in OOD is seen in males and females. However, the rate of OOD in the male category is twice the rate of OOD in the female category. The gender gap has been thought to be a result of males using illegal and synthetic forms of opioids, namely fentanyl, compared to prescription opioids.23
The trend of increasing OOD rates holds true for the Black and White populations. According to James and Jordan, before 2018, several states witnessed a higher rate in OOD in the Black population compared to the White population.11 The average annual percent change for the Black population has been higher than that of the White population since the onset of the third phase of the opioid epidemic.24 Consistent with these findings, in the present study, the actual OOD rate of 14.29 for the Black population in Q2 of 2020 is significantly higher than the actual OOD rate of 11.13 for the white population. Although the White population still accounts for the greatest total number of OOD, the Black population has a significantly higher rate (per 100,000) of OOD during the Q1 to Q2 period of 2020. These findings suggest that specific treatment solutions and equity-focused policies need to be tailored to the Black community to assist in regaining control of the opioid epidemic.24 Additionally, tailored treatment approaches and interventions should be implemented to assist in preventing overdoses in the Black community, to reduce racial/health disparities and drug overdose in the Black population.
A limitation of the current study is the lack of socioeconomic information related to OOD in the ODH database. Another limitation is the time lag in monthly OOD reporting. Because the ODH database receives information from each county coroner, the final death count may lag by up to 6 months. The ODH database does not allow for discernment between intentional and unintentional overdose.
Based on these findings, Ohio has now entered a COVID-19 pandemic mediated fourth wave in the ever-growing opioid epidemic. OOD increased across all sociodemographic groups. These findings further suggest that as efforts are made to address a worldwide COVID-19 pandemic, states need to maintain their vigilance toward combating the local opioid epidemic.
Footnotes
The authors report no conflicts of interest.
REFERENCES
- 1.Holmes EA, O’Connor RC, Perry VH, et al. Multidisciplinary research priorities for the COVID-19 pandemic: A call for action for mental health science. Lancet 2020; 7 (6):547–560. [DOI] [PMC free article] [PubMed] [Google Scholar]
- 2.Understanding the Epidemic [Internet]. Centers for Disease Control and Prevention. Centers for Disease Control and Prevention; 2020. Available from: https://www.cdc.gov/drugoverdose/epidemic/index.html. Accessed January 21, 2021. [Google Scholar]
- 3.Vital Signs: Overdoses of Prescription Opioid Pain Relievers --- United States, 1999–2008 [Internet]. Centers for Disease Control and Prevention. Centers for Disease Control and Prevention. Available from: https://www.cdc.gov/mmwr/preview/mmwrhtml/mm6043a4.htm. Accessed January 21, 2021. [Google Scholar]
- 4.Rudd RA, Davis JW, Dao D, et al. Increases in Heroin Overdose Deaths – 28 States, 2010 to 2012 [Internet]. Centers for Disease Control and Prevention. Centers for Disease Control and Prevention. Available from: https://www.cdc.gov/mmwr/preview/mmwrhtml/mm6339a1.htm. Accessed January 21, 2021. [Google Scholar]
- 5.Gladden M, Martinez P, Seth P. Fentanyl Law Enforcement Submissions and Increases in Synthetic Opioid–Involved Overdose Deaths - 27 States, 2013–2014. Morb Mortal Wkly Rep 2017; 65 (33):837–843. [DOI] [PubMed] [Google Scholar]
- 6.Song Z. Mortality quadrupled among opioid-driven hospitalizations, notably within lower-income and disabled white populations. Health Aff 2017; 36 (12):2054–2061. [DOI] [PMC free article] [PubMed] [Google Scholar]
- 7.Case A, Deaton A. Rising morbidity and mortality in midlife among white non-Hispanic Americans in the 21st century. Proc Natl Acad Sci U S A 2015; 112 (49):15078–15083. [DOI] [PMC free article] [PubMed] [Google Scholar]
- 8.Druss BG. Addressing the COVID-19 pandemic in populations with serious mental illness. JAMA Psychiatry 2020; 77 (9):891–892. [DOI] [PubMed] [Google Scholar]
- 9.van Dorn A, Cooney RE, Sabin ML. COVID-19 exacerbating inequalities in the US. Lancet 2020; 395 (10232):1243–1244. [DOI] [PMC free article] [PubMed] [Google Scholar]
- 10.Khatri UG, Pizzicato LN, Viner K, et al. Racial/ethnic disparities in unintentional fatal and nonfatal emergency medical services–Attended opioid overdoses during the COVID-19 pandemic in Philadelphia. JAMA Netw Open 2021; 4 (1):e2034878. [DOI] [PMC free article] [PubMed] [Google Scholar]
- 11.James K, Jordan A. The opioid crisis in black communities. JLME 2018; 46 (2):404–421. [DOI] [PubMed] [Google Scholar]
- 12.Ochalek TA, Cumpston KL, Wills BK, et al. Nonfatal opioid overdoses at an urban emergency department during the COVID-19 pandemic. JAMA 2020; 324 (16):1673–1674. [DOI] [PMC free article] [PubMed] [Google Scholar]
- 13.Scholl L, Seth P, Kariisa M, et al. Drug and opioid-involved overdose deaths – United States, 2013–2017. Morb Mortal Wkly Rep 2019; 67 (5152):1419–1427. [DOI] [PMC free article] [PubMed] [Google Scholar]
- 14.National Institute on Drug Abuse, National Institute on Drug Abuse. Ohio: Opioid-Involved Deaths and Related Harms. 2020; Available from: https://www.drugabuse.gov/drug-topics/opioids/opioid-summaries-by-state/ohio-opioid-involved-deaths-related-harms Accessed January 21, 2021. [Google Scholar]
- 15.Hall OT, Hall OE, Kolodny A, et al. Assessment of excess mortality associated with drug overdose in Ohio from 2009 to 2018. JAMA 2020; 3 (4):e202183. [DOI] [PMC free article] [PubMed] [Google Scholar]
- 16.Wainwright JJ, Mikre M, Whitley P, et al. Analysis of drug test results before and after the US declaration of a national emergency concerning the COVID-19 Outbreak. JAMA 2020; 324 (16):1674–1677. [DOI] [PMC free article] [PubMed] [Google Scholar]
- 17.Hernandez A, Branscum AJ, Li J, et al. Epidemiological and geospatial profile of the prescription opioid crisis in Ohio, United States. Sci Rep 2020; 10 (4341):1–10. [DOI] [PMC free article] [PubMed] [Google Scholar]
- 18.2020; Hulsey J, Mellis A, Kelly B. COVID-19 pandemic impact on patients, families and individuals in recovery from substance use disorder. Addiction Policy Forum. Available at: https://www.addictionpolicy.org/covid19-report. Accessed April 11, 2021. [Google Scholar]
- 19.Glober N, Mohler G, Huynh P, et al. Impact of COVID-19 pandemic on drug overdoses in Indianapolis. J Urban Health 2020; 97 (6):802–807. [DOI] [PMC free article] [PubMed] [Google Scholar]
- 20.Opioid Data Analysis and Resources [Internet]. Centers for Disease Control and Prevention. Centers for Disease Control and Prevention; 2021. Available from: https://www.cdc.gov/drugoverdose/data/analysis.html. Accessed January 28, 2021. [Google Scholar]
- 21.NBER, Mulligan CB. Prices and Federal Policies in Opioid Markets. 2020; Available at: https://www.nber.org/papers/w26812 Accessed Jan 29, 2021. [Google Scholar]
- 22.Wilson N, Kariisa M, Seth P, et al. Drug and opioid-involved overdose deaths — United States, 2017–2018. MMWR Morb Mortal Wkly Rep 2020; 69:290–297. [DOI] [PMC free article] [PubMed] [Google Scholar]
- 23.Eeckhaut MC, Wagner J, Neitzke-Spruill L, et al. Is the gender gap in overdose deaths (still) decreasing? An examination of opioid deaths in Delaware, 2013–2017. J Stud Alcohol Drugs 2020; 81 (1):68–73. [DOI] [PMC free article] [PubMed] [Google Scholar]
- 24.Furr-Holden D, Milam AJ, Wang L, et al. African Americans now outpace Whites in opioid-involved overdose deaths: A comparison of temporal trends from 1999–2018. Addiction 2020; 116 (3):677–683. [DOI] [PubMed] [Google Scholar]


