

Abstract
Selective hydroxylation of aliphatic C–H bonds remains a challenging but broadly useful transformation. Nature has evolved systems that excel at this reaction, exemplified by cytochrome P450 enzymes which use an iron-oxo intermediate to activate aliphatic C–H bonds with k1 > 1400 s−1 at 4 °C. Many synthetic catalysts have been inspired by these enzymes and are similarly proposed to use transition metal-oxo intermediates. However, most examples of well-characterized transition metal-oxo species are not capable of reacting with strong, aliphatic C–H bonds, resulting in a lack of understanding of what factors facilitate this reactivity. Here, we report the isolation and characterization of a new terminal CoIII-oxo complex, PhB(AdIm)3CoIIIO. Upon oxidation a transient CoIV-oxo intermediate is generated that is capable of hydroxylating aliphatic C–H bonds with an extrapolated k1 for C–H activation >130 s−1 at 4 °C, comparable to values observed in cytochrome P450 enzymes. Experimental thermodynamic values and DFT analysis demonstrate that although the initial C–H activation step in this reaction is endergonic, the overall reaction is driven by an extremely exergonic radical rebound step, similar to what has been proposed in cytochrome P450 enzymes. The rapid C–H hydroxylation reactivity displayed in this well-defined system provides insight into how hydroxylation is accomplished by biological systems and similarly potent synthetic oxidants.
Graphical Abstract

INTRODUCTION
Direct C–H activation and hydroxylation of unactivated aliphatic bonds is a challenging but powerful transformation for the efficient synthesis of complex organic molecules and pharmaceuticals, many of which have oxygenated functionalities.1,2 Nature has evolved enzymatic systems that rapidly and selectively hydroxylate aliphatic C–H bonds.3,4 An archetypal example is CYP119, a cytochrome P450 enzyme that hydroxylates the C–H bonds in fatty acids (BDE ~ 101 kcal/mol) with second order rate constants as large as 104-107 M−1s−1 at 4 °C.5–7 The remarkable reactivity of this system has motivated intense efforts to understand what factors underpin its activity. A recent analysis of the thermodynamics of this system shows that the initial C–H activation step is uphill, but extremely fast rates are enabled by a highly favorable rebound to the in situ generated carbon radical.7–11
In addition to biological systems, there has been concerted effort in discovering catalysts that mediate C–H hydroxylation reactivity in a synthetic context.12–18 Many of these systems invoke transition metal-oxo intermedates,16,17,19–22 and selectivity is noted to be greater in systems that have an extremely fast rebound step that avoids long-lived radical intermediates that can engage in side reactions.17,20,21 In parallel, there has been significant interest in the detailed study of C–H activation by isolable, well-characterized transition metal-oxo complexes in order to better understand what factors govern the reactivity of enzymatic and synthetic catalysts.23,24 However, in most of these cases the activation of strong bonds, such as aliphatic C–H bonds, is rarely observed or slow, in direct contrast to the rates of C–H oxidation by P450s. This muted reactivity with strong C–H bonds by well-defined systems is often attributed to free energy considerations. These relatively stable transition metal-oxo intermediates frequently have BDFEO–H < BDEC–H which, as illustrated by the Bell-Evans-Polanyi relationship and extensive literature precedent, results in inhibited reactivity.25–29 The dichotomy of stabilization at the expense of reactivity results in a scarcity of metal-oxo complexes that activate strong C–H bonds where the thermodynamics are known with fidelity,30–38 and in these limited examples the rates of reaction are slow when BDEC–H > BDFEO–H.35–37 In particular, late transition metal-oxo complexes, which are frequently invoked as potent oxidants, have not displayed this reactivity from well-characterized examples.39–42 The activation of strong tert-butyl C–H bonds in Co complexes has been observed, but hydroxyl radicals are invoked in these reactions and it’s unclear whether this reactivity stems from bona fide metal-oxo intermediates.31,30,33 Gas phase C–H activation of cyclohexane (BDE = 99.5 kcal/mol) by a transient CoIV-oxo complex has been reported, but the relevant reaction free energies are unknown.32 Thus, while it has been proposed that endergonic C–H activation followed by exergonic rebound is central to selective catalysis by both molecular and enzymatic systems, examples of well-characterized transition metal-oxo systems where these steps can be studied are rare.
We recently reported the C–H activation reactivity of an isolable CoIII-oxo complex which displays unusual kinetic trends. As expected, the comparatively low BDFEO–H of this system resulted in no reactivity with strong C–H bonds.41 Additionally, no evidence for oxygenated products arising from rebound was observed. We rationalized that a CoIV oxidation state would provide a more potent oxidant for strong C–H bonds. Furthermore, rebound to produce oxygenated products might be facilitated by the more favorable generation of a CoII complex as opposed to a CoI product. However, oxidation of the previously reported PhB(tBuIm)3CoIIIO results in intractable mixtures of products. Therefore, we decided to pursue a CoIV oxidation state with a bulkier and more donating ligand featuring adamantyl (Ad) groups to support an oxidized metal center, protect the reactive Co–O unit, and inhibit side reactions.43
Here, we show that 1 e− oxidation of an Ad-substituted terminal CoIII-oxo complex results in a more active oxidant which activates aliphatic C–H bonds with subsequent rebound. C–H activation proceeds through a transient and highly reactive CoIV-oxo intermediate. This unusual high valent late transition metal-oxo species can nonetheless be observed spectroscopically. Detailed characterization of the thermodynamics of this system shows an endergonic initial C–H activation step. Nonetheless, this reaction is exceptionally fast, with a first order rate constant >102 M−1s−1, comparable to those measured for P450 enzymes. Computational analysis supports that these fast rates are driven by extremely favorable rebound, which parallels and supports mechanistic proposals for enzymatic hydroxylations. These results provide detailed experimental validation on how unfavorable C–H activation can be facilitated by favorable radical rebound.
RESULTS AND DISCUSSION
Synthesis and Characterization of Complexes 1–4
We began our pursuit of a more active oxidant by synthesizing the CoIII-oxo complex, PhB(AdIm)3CoIIIO (4, PhB(AdIm)3− = tris(1-adamantyl-imidazol-2-ylidene)phenyl borate), and the relevant precursors analogously to our previously reported system (Scheme 1).44 Deprotonation of [PhB(AdImH)3][OTf]2 with 3.05 equivalents of lithium diiso-propylamide followed by addition of 1 equivalent of CoCl2 results in the formation of PhB(AdIm)3CoIICl (1) which can be isolated as a bright blue solid in 78% yield. Thorough characterization including NMR and EPR spectroscopies confirm the assignment and purity of this S = 3/2, pseudo-tetrahedral chloride complex (See SI). Single crystal X-ray diffraction (SXRD) reveals that the Co–Cl and Co–C bond lengths in the first coordination sphere (Figure 1, Table S3) are slightly shorter than those observed in the analogous complex with tert-butyl (tBu) substituents on the ligand.45 This observation is consistent with the stronger donation from the Ad substituents.
Scheme 1.

Synthesis of Complexes 1–4
Figure 1.

Crystal structures of complexes 1-4. Thermal ellipsoids are shown at 50% probability. All H–atoms besides those bound to O are omitted for clarity. Counterions and solvent molecules except for the Et2O hydrogen-bonding to the O–H in 3 are also omitted.
Treatment of complex 1 with 3 equivalents of NaOH in tetrahydrofuran (THF) produces the CoII-hydroxide complex PhB(AdIm)3CoIIOH as a bright violet powder in 57% yield (2, Scheme 1, See SI). Cyclic voltammetry of 2 collected in THF shows a quasi-reversible couple at −440 mV vs. Fc/Fc+ (Fc = ferrocene). This couple is substantially more negative than that observed for the tBu-substituted system −230 mV vs. Fc/Fc+) suggesting that this compound is more easily oxidized, as expected from the stronger donation of the Ad-substituents. Consistently, the SXRD structure of 2 (Figure 1, Table S3) also displays shorter Co–O and Co–C bonds.44
Oxidation of 2 with 1 equivalent of FcBF4 in THF at −35 °C affords the diamagnetic CoIII-hydroxide complex, [PhB(AdIm)3CoIIIOH][BF4] (3, Scheme 1), as a bright green species. Similarly to our previously reported system,44 3 is thermally unstable. Nonetheless, it is long-lived enough at − 35 °C for characterization by low temperature NMR and UV-visible (UV-vis) spectroscopies which reveal a diagnostic O–H resonance (Figure S7) and a strong absorbance at 718 nm (Figure S27), respectively. Single crystals of 3 can also be obtained by layering in situ generated solutions of 3 in THF under cold pentane and allowing them to diffuse at −35 °C. The SXRD structure of 3 (Figure 1) displays a distortion away from pseudo-tetrahedral symmetry, similar to that observed in the tBu-substituted complex.44,46
Deprotonation of complex 3 should result in the formation of the desired CoIII-oxo complex. However, use of the previous base hexamethyldisilazide44 (HMDS−) results in impure mixtures of 2 and a new species, PhB(AdIm)3CoIIIO (4). We hypothesized this was due to slow deprotonation from the steric hindrance between HMDS− and the Ad groups, which allowed for competitive reduction of 3 by HMDS−. Indeed, switching to a sterically less encumbered and less reducing base in the form of potassium tert-butoxide (KOtBu) enables the isolation of the pure terminal oxo complex 4 as dark purple crystals in variable yields (22%–55%, Scheme 1). Complex 4 is diamagnetic and has been thoroughly characterized by a variety of techniques including IR spectroscopy (See SI) and SXRD (Figure 1). Comparison of the IR spectra of as synthesized 4 and its 18O-isotopologue reveals a Co–O vibration at 807 cm−1 which shifts to 775 cm−1 upon labeling, as expected from a simple harmonic oscillator approximation (Figure S44). This stretching frequency is consistent with a strong Co–O multiple bond. Additionally, a short Co–O bond length of 1.655(3) Å is observed in the SXRD structure (Figure 1), also consistent with a strong multiple bond.47
A more detailed discussion comparing 4 and the tBu-substituted CoIII-oxo complex is warranted. Initial comparison of the Co–C bond lengths in these two complexes shows that on average, the Co–C bond lengths are ~0.02 Å shorter in 4 (Table 1). This is again consistent with the increased donation of the Ad-substituted ligand. Additionally, the Co–O bond length is observed to be ~0.03 Å shorter in 4 than PhB(tBuIm)3CoIIIO (Table 1). This could suggest a stronger Co–O bond in 4. However, IR spectroscopic data and density functional theory (DFT) analysis of the Co–O bonding in these two complexes suggests this is not the case. The Co–O stretching frequency in 4 is 807 cm−1, compared to 815 cm−1 in PhB(tBuIm)3CoIIIO (Table 1). This difference in stretching frequency corresponds to a bond length difference of only ~0.005 Å according to a Badger’s Law analysis,50 which is approximately the error in the SXRD bond lengths. The similarity in Co–O stretching frequencies is more consistent with a comparable Co–O bond between the two complexes. DFT analysis further supports this similarity. The DFT predicted Co–O bond lengths and stretching frequencies are very similar (Table 1) and the computed delocalization index47 (DI, a measure of the covalent bond order) is identical for both bonds (Table 1). Together, the DFT analysis and IR spectroscopic data support an almost identical bonding interaction between Co and O in complex 4 and PhB(tBuIm)3CoIIIO despite the slightly different Co–O stretching frequencies. The observed shorter bond length in the crystal structure of 4 may reasonably be attributed to crystal packing effects instead of a stronger Co–O bond.
Table 1.
Comparison of Complex 4 and PhB(tBuIm)3CoIIIO
| Compound | Co–Cavg (Å) | Co-O (Å) | νCo-O (cm−1) | DIc | pKad | E1/2f (V vs Fc/Fc+) | BDFEO-Hg (kcal/mol) | |||
|---|---|---|---|---|---|---|---|---|---|---|
| exp | calcb | exp | calcb | exp | DMSOe | |||||
| PhB(tBuIm)3CoIIIOa | 1.929 | 1.682(6) | 1.651 | 815 | 829 | 2.293 | 25.58(5)h | 15 | −0.23h | 84.6h |
| 4 | 1.912 | 1.655(3) | 1.651 | 807 | 827 | 2.293 | 22.6i,j | 18 | −0.44i | 86.8i |
From DFT calculated structures (See SI).
Delocalization index (See Experimental).47
pKa value for the deprotonation of the CoIII-hydroxide complex to form the CoIII-oxo complex.
pKa values extrapolated to DMSO given that pKa values correlate linearly between many solvents.
CoII-hydroxide/CoIII-hydroxide redox potential.
For the O–H bond in the corresponding CoII-hydroxide complex.
Measured in MeCN.
Measured in THF.
pKa value determined using the methods described in references48 and49 (See Experimental and SI).
Despite the similarity of the Co–O bonds, there are notable differences in key thermodynamic parameters between these two systems.51 Measurement of the CoII-hydroxide/CoIII-hydroxide redox potential and the pKa for deprotonation of the CoIII-hydroxide complex allows for calculation of the BDFEO–H in the CoII-hydroxide complex in each case (Equation 1, Scheme S1, C is the standard reduction potential of H+/H• in a particular solvent).51,52 Examining the values reported in Table 1, it is evident that the Ad-substituted system is ~200 mV less oxidizing than the tBu-substituted system, but is ~3 pKa units more basic once the experimentally measured values are extrapolated to DMSO for more direct comparison. This results in a ~2 kcal/mol stronger O–H bond in 2 than in PhB(tBuIm)3CoIIOH. Therefore, we might expect 4 to be a slightly more potent H–atom abstractor. Additionally, the contributions to the BDFEO–H are more imbalanced in the Ad-substituted system than in the tBu-substituted system. We might reasonably expect 4 to activate C–H bonds more asynchronously than was previously shown for PhB(tBuIm)3CoIIIO due to a more imbalanced transition state.41
| (1) |
Oxidation of Complex 4
To initially explore the oxidation of 4, a cyclic voltammogram (CV) was collected in THF (Figure S52). This shows an irreversible oxidation feature near 0 V vs Fc/Fc+. Closer examination of this feature reveals an initial shoulder with a peak potential Ep,sh = −0.12 V vs Fc/Fc+ that appears before the main feature with Ep = +0.085 V vs Fc/Fc+. We hypothesized that these features could correspond to an initial oxidation to a putative CoIV-oxo intermediate (4ox) followed by a rapid chemical step to produce a second intermediate that could be further oxidized at a similar potential.
The initial oxidation seen by CV should reasonably produce a CoIV-oxo intermediate that could engage in C–H activation reactivity to produce 3 as the metal-containing product. Therefore, we sought to characterize the BDFEO–H in 3. Using Ep,sh as the upper bound for the true value of the 4/4ox redox potential and the pKa of 3 (Table 1, Equation 1, Scheme S2), we can calculate an upper bound for the BDFEO–H in 3 of 94 kcal/mol. This is ~7 kcal/mol stronger of an O–H bond than that in 2. As predicted, oxidation to produce a putative CoIV-oxo intermediate results in a species that has a greater driving force for H–atom abstraction. This high BDFEO–H, and the commensurately high reactivity of this putative CoIV intermediate, could explain the irreversibility observed in the CV collected at room temperature. Nonetheless, related species with comparable BDFEO–H values have been observed and characterized previously at low temperatures,52 so we pursued the low-temperature oxidation of 4 to investigate possible intermediates as well as C–H oxidation reactivity.
We initially monitored these reactions by UV-vis spectroscopy in THF at −80 °C. Addition of 1 equivalent of FcBF4 to a solution of 4 results in a very rapid (complete within <3 minutes) and relatively clean transformation to a new spectrum with absorbances at 434 nm, 478 nm, 534 nm, and 708 nm (Figure S30). This resulting spectrum does not change appreciably until warming above 0 °C. The absorbance at 708 nm is similar to the diagnostic 718 nm band observed in the UV-vis spectrum of 3 (Figure S27). This suggests that instead of observing 4ox as a discrete intermediate, 3 is produced by rapid C–H activation by 4ox.
We turned to low temperature NMR spectroscopy to provide further insight into the products of this reaction. A solution of FcBF4 in CD3CN was mixed with a solution of 4 in THF-d8 at −35 °C and allowed to react for ~15 minutes before a 1H NMR spectrum was collected at −30 °C. No paramagnetic species are observed, precluding non-integer spin 4ox as a likely component in this reaction mixture. On the other hand, some amount of 3 was produced in this reaction as indicated by a set of 1H NMR features (blue highlighted peaks in Figure 2A) that match those observed for independently prepared 3. Interestingly, the observation of the diagnostic O–H resonance at 10.60 ppm indicates that solvent C–H activation is not the source of that H–atom, since this experiment was carried out in deuterated solvent. The 1H NMR spectrum also shows there is another species in solution (red highlighted peaks in Figure 2A, 5) that is highly asymmetric, resulting in each imidazol-2-ylidene arm being inequivalent to each other and giving rise to 6 separate Im-H resonances. The observation of these asymmetric signals is consistent with C–H activation of the Ad group on one arm of the ligand (Scheme 2A), putatively by 4ox.
Figure 2.

(A) 1H NMR spectrum at −35 °C in THF-d8 of the reaction of 4 with FcBF4. Only the aromatic region is shown for clarity. The full spectrum is shown in Figure S19. The resonances associated only with 3 are highlighted in blue and those associated only with 5 are in red. Overlapping resonances from 3 and 5 are in purple. Asterisks indicate toluene and benzene impurities in the THF-d8. (B) Crystal structure of 5 shown as a ball and stick model. All H–atoms and the counterion are omitted for clarity.
Scheme 2.
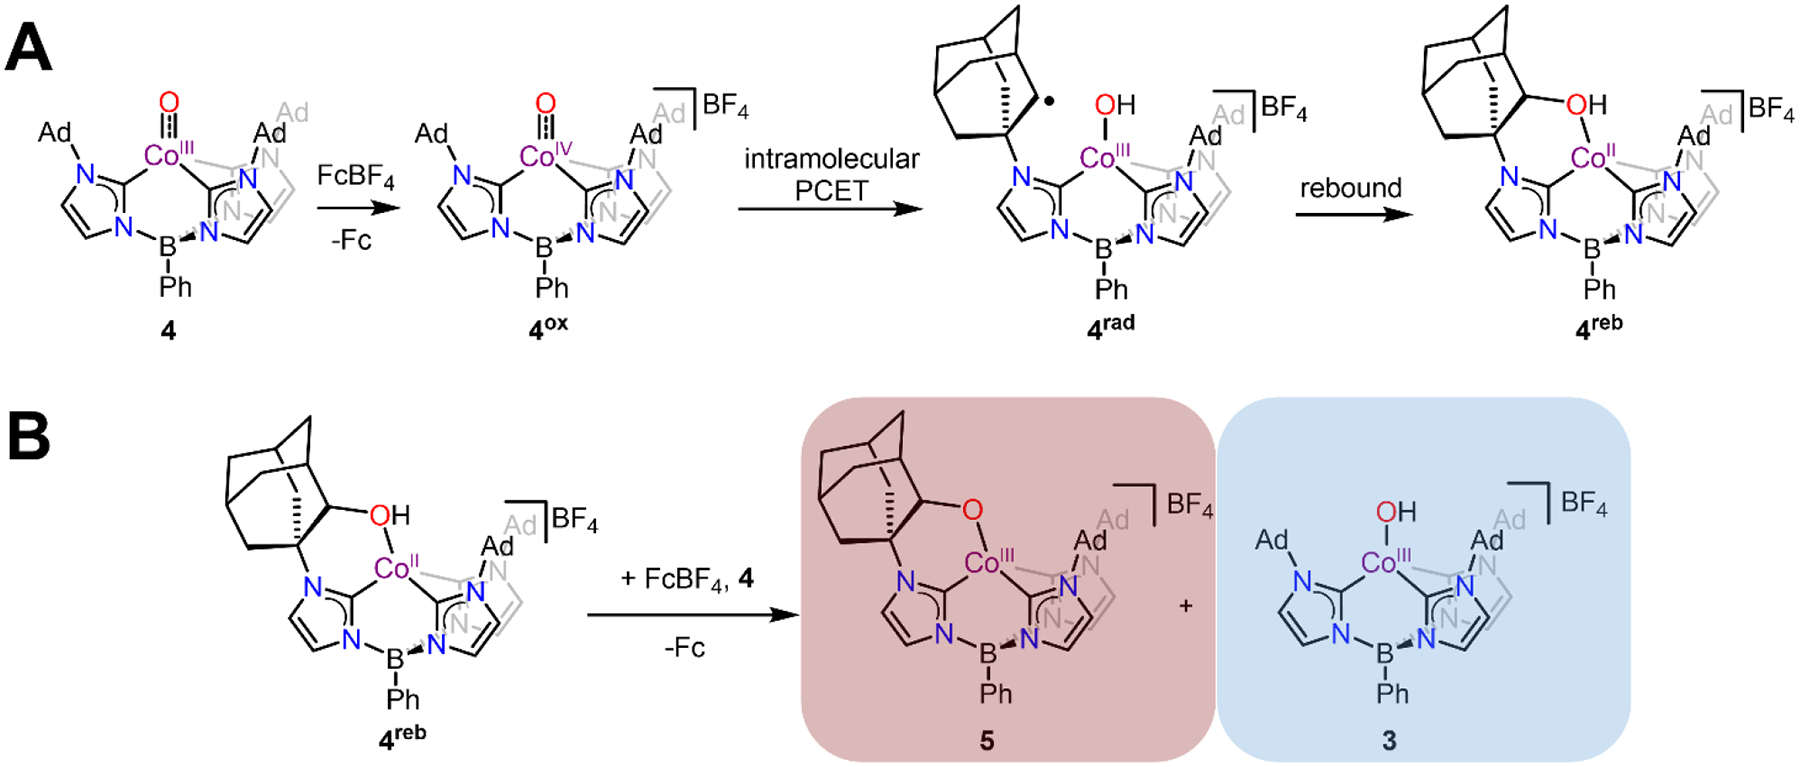
Proposed Reaction Mechanisms Following the Oxidation of 4
While 3 decays at room temperature (see above), the new diamagnetic species 5 is thermally stable which allowed for detailed 1D and 2D NMR spectroscopic characterization (See SI). Based on these results, complex 5 can be assigned as the chiral CoIII-alkoxide product, [PhB(AdIm)2(OAdIm)CoIII][BF4] (Scheme 2B). The formulation of 5 is just one H–atom away from the expected CoII product (4reb, Scheme 2A) that might be expected as a result of C–H activation of an Ad group by 4ox followed by rebound to form a C–O bond. We propose that this net H–atom is lost to form 5 via in situ oxidation of 4reb by Fc+ with subsequent proton transfer to 4 (Scheme 2B). This explains the observation of 3 as a product in this reaction mixture which should be formed in a 1:1 molar ratio with 5. Indeed, integration of the 1H NMR spectrum reveals ratios consistent with this mechanistic proposal (Figure 2A). The resonance at 6.94 ppm corresponds to 1 Im-H in asymmetric 5 while the resonance at 7.29 ppm corresponds to 3 Im-H in symmetric 3. As expected for a 1:1 molar ratio of 5:3, these resonances integrate in a 1:3 ratio.
The overall reaction shown in Scheme 2 should result in a maximum 50% yield of 5 relative to the Fc formed during the reaction. Indeed, this yield is observed in 1H NMR spectra collected of solutions warmed to room temperature after oxidation. Additional support for the proposed formation of 5 from 4reb shown in Scheme 2B comes from experiments carried out with the addition of 2 equivalents of FcBF4 to 4 in the presence of 1 equivalent of KOtBu. When this reaction is monitored by UV-vis spectroscopy at −80 °C, the growth of a strong absorbance near 700 nm, diagnostic for the presence of 3 in solution, is dramatically attenuated (Figure S33). Additionally, monitoring this reaction by 1H NMR spectroscopy at −35 °C shows very little 3 as assayed by the diagnostic O–H resonance (Figure S21). Analysis of these solutions by 1H NMR spectroscopy after the reaction has been warmed to room temperature shows that the yield of 5 relative to Fc is increased to ~90% (Figure S20). Finally, we note that the oxidation of 4 is much slower than all of the subsequent redox reactions shown in Scheme 2A and B. We are therefore unable to observe 4reb, even when a sub-stoichiometric amount of FcBF4 is added to the reaction (Figure S22).
Complex 5 was therefore synthesized in bulk using 2 equivalents of FcBF4 and 1 equivalent of KOtBu and isolated in 64% yield. This compound has been thoroughly characterized, including by elemental analysis (See Experimental and SI). The assignment of 5 was also confirmed by X-ray diffraction data collected on single crystals of the ion-exchanged BArF4− salt (BArF4− = tetrakis(3,5-bis(trifluoromethyl)phenyl)borate, see Experimental) grown from an Et2O solution layered under pentane (Figure 2B). Due to complicated disorder of the O–atom over multiple positions, the data quality is only suitable to confirm the connectivity of the atoms in 5. Nonetheless, the Co–O–C unit is clearly observed and the presence of a single BArF4 anion supports a CoIII complex with an alkoxide ligand. Taken together, these observations support the formation of the terminal product 5 from rapid intramolecular C–H activation by 4ox and subsequent rebound to form 4reb followed by the intermolecular reactivity shown in Scheme 2.
Observation of the CoIV Intermediate 4ox
The reaction mechanism shown in Scheme 2A invokes a key CoIV-oxo intermediate. Such high-valent Co complexes are quite rare although they have been invoked as reactive intermediates.32,39,40,53,54 While there is one example of a spectroscopically characterized terminal CoIV-oxo species, it does not engage in the activation of aliphatic C–H bonds.40 Therefore, we set out to observe any transient CoIV complex in order to support the proposed agency of 4ox. We first monitored addition of FcBF4 to solutions of 4 by UV-vis spectroscopy at temperatures lower than −80 °C in the hopes of slowing down the reaction enough to observe 4ox. However, no evidence for an intermediate is discernible in the UV-vis spectra of reactions carried out in THF at −105 °C or in 2-MeTHF at −130 °C (See SI). We turned to EPR spectroscopy in the hopes of observing an S = 1/2 signal in solutions prepared by mixing FcBF4 and 4 at low temperatures (−105 °C in THF or −130 °C in 2-MeTHF) followed by freezing in liquid nitrogen. However, no S = 1/2 signal consistent with a CoIV intermediate can be observed in these experiments.
C–H activation reactions mediated by transition metal-oxo and hydroxide complexes frequently have large deuterium kinetic isotope effects (KIEs), especially at low temperatures.31,55,56 Furthermore, deuteration of reactive C–H groups on ligands has previously enabled the characterization of transient oxo intermediates.57 Therefore, we reasoned that we would be able to observe 4ox by slowing down the reaction through deuteration of the Ad groups on the ligand in 4. This was achieved on a small scale starting from adamantane-d16. The starting material for the first step of the ligand synthesis,43 1-bromoadamantane-d15, was synthesized by refluxing adamantane-d16 in bromine for 3 hours.58 After work up, 1-bromoadamantane-d15 was isolated in 73% yield. With this material in hand, 1-(adamantyl-d15)-imidazole and PhB(Ad-d15ImH)3OTf2 were made following the reported procedures for the synthesis of the proteo compounds.43 Finally, following the procedures reported here (See Experimental), the compounds 1-d45, 2-d45, and 4-d45 were made. Unfortunately, after this lengthy synthetic route, the obtained 4-d45 was contaminated with a 29% impurity of 2-d45 as determined by 1H NMR spectroscopy. Fortunately, this impurity can be easily accounted for during subsequent analysis of the reactions as described below.
Oxidation of 4-d45 with FcBF4 in THF-d8 at −105 °C was initially followed by UV-vis spectroscopy (Figure S34). After collection of an initial spectrum, 1 equivalent of FcBF4 was injected into the cuvette and a spectrum was collected beginning ~5 seconds after injection. Additional spectra were collected every 45 seconds. Examination of the spectra > 900 nm shows immediate consumption of 4-d45 upon addition of oxidant, as evidenced by the disappearance of the trailing absorbance from 4-d45 in the first scan after injection, followed by no further changes over time. This is in contrast to the oxidation of 4, where only ~1/2 of 4 is consumed immediately after injection of FcBF4, as the other 1/2 equivalent of FcBF4 is consumed by the rapidly produced 4reb. A slower disappearance of the additional 1/2 equivalent of 4 occurs during the putative proton transfer step, consistent with the mechanism shown in Scheme 2. Thus, for the oxidation of 4-d45, it is likely that all oxidation equivalents are consumed in the generation of 4ox-d45 without any convolution from the immediate formation of 4reb or 5. After spectral deconvolution to remove features from the small amount of 3-d45 generated from the 2-d45 impurity, we observe a spectrum with features at 492 nm, 552 nm, and 616 nm (Figure S35). This spectrum displays generally good agreement with the spectrum predicted by TD-DFT calculations carried out on 4ox (Figure S35), even considering the limited accuracy of computational methods in predicting such spectra.59 This correlation supports that we are indeed observing this proposed CoIV intermediate.
We additionally looked at this reaction by EPR spectroscopy. Fortunately, any 3-d45, which is diamagnetic, that would be generated from the 2-d45 impurity will be silent by EPR spectroscopy, preventing any signal convolution as was seen in UV-vis spectroscopy. Preparation of samples at −105 °C in THF-d8 followed by immediate freezing in liquid nitrogen and collection of data within 5 minutes at 15 K reveals a unique S = 1/2 signal (Figure 3, Figure S48). A crude spin integration estimate suggests that this signal arises from a major species (see experimental). Simulation of this signal gives g-values of 2.0439, 2.0238, and 2.0218. There is also an 8-line pattern arising from coupling to the I = 7/2 59Co nucleus. This pattern can be simulated with hyperfine coupling constants of A = 16.6, 76.2, and −0.2 MHz. These simulated parameters are consistent with an S = 1/2 Co complex, which could correspond to a d5 CoIV-oxo species or a low-spin CoII species. A low-spin CoII species, such as 4reb, would be expected to be geometrically distorted and give rise to an axial or rhombic signal. The near-isotropic g-values observed here are therefore most consistent with the proposed CoIV-oxo species. Furthermore, the 59Co hyperfine coupling observed here is much smaller than previous reports of low-spin CoII in distorted tetrahedral geometries, supporting a CoIV assignment.60
Figure 3.

Perpendicular mode X-band EPR spectrum (15 K) of 4ox-d45 generated in situ at −105 °C in THF-d8. Simulation parameters: g = 2.0439, 2.0238, 2.0218; A = 16.6, 76.2, −0.2 MHz. Experimental conditions: microwave frequency 9.6304 GHz, microwave power 0.2 mW. The full spectrum is shown in Figure S48.
These parameters are also in line with those that have been reported previously for other S = 1/2 CoIV complexes.39,54,61–66 In particular, 4ox-d45 displays relatively small hyperfine coupling constants that are more similar to those reported for spin delocalized systems61,63 than those reported for systems where the spin is highly localized on the 59Co nucleus.54 This, in addition to the g-values near 2, suggests that there is likely a significant amount of O–centered spin density in 4ox-d45. IBO analysis predicts a population of 0.44 spins on O,67,68 consistent with this hypothesis. Regardless, the UV-vis and EPR spectroscopic data for the oxidation of 4-d45 support the presence of 4ox as an intermediate in the reaction outlined in Scheme 2.
Analysis of C–H Activation by 4ox
While the above data from reactions with 4-d45 support the agency of 4ox in this system, the fleeting nature of this and other intermediates invoked in Scheme 2A, namely 4rad and 4reb, prompted us to use density functional theory calculations to optimize these possible intermediates and analyze the free energies of this proposed mechanism (Figure 4). We initially optimized the structure of the intermediate 4ox (Figure 4, leftmost structure) which reveals the expected pseudo-tetrahedral geometry. The Co–O bond length is 1.590 Å, which is ~0.06 Å shorter than that predicted for 4 (Table 1), consistent with the removal of a delectron from a dz2 orbital with some σ* character.47 This short Co–O bond length indicates a strong covalent bond, which likely facilitates the electron delocalization indicated by the EPR spectrum, as discussed above.
Figure 4.

Reaction coordinate for intramolecular C–H activation and rebound from 4ox. The structures shown are the DFT optimized structures of the intermediates (black labels) and transition states, shown as sticks except for Co, O, the transferring H–atom, and the involved C–atom. The energies given are the calculated free energies at −80 °C, relative to 4ox, in kcal/mol including a THF CPCM solvent correction.
Additionally, these calculations reveal that the initial C–H activation step to produce 4rad is endergonic with ΔG = +3.3 kcal/mol. This result agrees with our experimentally determined thermodynamics; we calculate an upper bound for the solution-phase BDFEO–H in 3 as 94 kcal/mol (see above), and the estimated solution-phase BDFEC–H for the CH2 groups in free adamantane is 95.2 kcal/mol.51,69,70 Using these as good approximations for the C–H bond broken and the O–H bond formed to give the intermediate 4rad, we would estimate that ΔG > +1.2 kcal/mol for C–H activation, in reasonable agreement with our DFT results.
Despite this initial endergonic step, productive reactivity does occur to form 5, presumably through the intermediate 4reb. This must be driven by a favorable secondary reaction, since ground state thermodynamics would predict that for a reaction with ΔG > 0, any equilibrium would heavily favor the reactants in the first step. Indeed, this idea is supported by the very exergonic secondary reaction predicted by DFT to produce 4reb from 4rad (Figure 4) with ΔG = −42 kcal/mol. This second step only has a barrier of 1.1 kcal/mol from 4rad and would be expected to proceed very rapidly whenever 4rad is formed. This combination of a very exergonic step with almost no barrier likely contributes to favoring formation of 4reb and ultimately the observed product 5.
We can contrast this result to the analogous CoIII system (complex 4) which does not engage in this reactivity. Samples of 4 are stable at −35 °C for weeks and can be handled at room temperature over hours, while all attempts at isolating 4ox result in rapid formation of 5. DFT analysis of the energies for intermediates along the same reaction coordinate for the CoIII system (Figure S54) reveals that the initial C–H activation intermediate is now 17 kcal/mol uphill from 4 while the CoI complex resulting from rebound is only 19 kcal/mol downhill from the CoII intermediate (See SI). Not only is there less driving force for rebound in this system, which should result in a slower rebound reaction that cannot trap a putative CoII-ligand radical intermediate, but the formation of a CoI complex is essentially thermoneutral from the starting complex 4 providing little, if any, driving force for the overall reaction. This highlights that by oxidizing to a formally CoIV oxidation state, we are able to engage in more difficult reactivity by a) utilizing a stronger oxidant to enable the initial C–H activation step and b) driving the overall reaction with an extremely favorable secondary rebound step, which is not accessible for a CoIII starting material.
We also sought to contextualize the rate of C–H activation by 4ox by comparing to other examples in the literature. Most isolable transition metal-oxo (or related) complexes that engage in uphill reactivity do so at very slow rates.35,36,52 In contrast, cytochrome P450 enzymes are known to react with the strong C–H bonds in fatty acids with second order rate constants on the order of 104-107 M−1s−1 and a first order rate constant for C–H activation after substrate is bound has been estimated at > 1400 s−1 at 4 °C.5 We note that care must be taken in comparing the rate constants of these bimolecular reactions in synthetic examples with enzymatic reactions. Nonetheless, we set out to estimate the first order rate constant for C–H activation by 4ox in order to see how the present system compares to one of the most kinetically active oxidants known.
Given our inability to isolate 4ox upon oxidation of 4, we are unable to directly measure the rate constant for C–H activation. However, the rapid kinetics of the reaction necessitate that the rate of C–H activation must be greater than the rate of oxidation of 4 by FcBF4. Therefore, in order to provide a lower bound on the rate of C–H activation by 4ox, we estimated the rate of oxidation of 4 by the method of initial rates.71 Unfortunately, the rate of this reaction is at the limit of measurable rates for our experimental apparatus, so we were only able to provide a lower bound for the rate constant for oxidation (See Experimental and SI). Nonetheless, we estimated the lower bound of the second order rate constant for oxidation of 4 by FcBF4 as 440±50 M−1s−1 at −80 °C. We carried out this analysis at two additional temperatures, −105 °C and −40 °C, in order to estimate the second order rate constant at 4 °C for direct comparison to P450. This analysis gives us a lower bound on the second order rate constant for oxidation of 1.1(6)•103 M−1s−1 at 4 °C. To convert this oxidation rate constant to a C–H activation rate constant, we used our assumption that the rate of C–H activation by 4ox is greater than the rate of oxidation at any point during the reaction. If we assume that an upper bound for the maximum buildup of [4ox] is 1% of initial concentration of 4, then we can use this lower bound for k2 to determine a lower bound for the first order rate constant for C–H activation by 4ox as 1.3(7)•102 s−1 at 4 °C (See Experimental, Equation 12).
This first order rate constant is large and comparable to that reported for C–H activation by cytochrome P450 enzymes, ~103 s−1 at 4 °C. This large rate constant is also consistent with the relatively low energy of the transition state predicted by DFT (Figure 4). In fact, this system has many parallels to the proposed factors that enable the remarkable reactivity of P450. It has been recently argued that the reactivity of P450 is enabled by a thermodynamically favorable rebound immediately following unfavorable C–H activation, exactly the scenario at play in this Co-based system.7 These similarities suggest that the C–H activation exhibited by the terminal metal-oxo 4ox is biomimetic, and that the strategy of enabling uphill C–H activation with a rapid and favorable rebound step can be general across synthetic and natural systems.
CONCLUSIONS
We have isolated and characterized a new terminal CoIII-oxo complex. Oxidation of this complex results in an unusual and highly reactive CoIV-oxo intermediate which rapidly activates a C–H bond on the ligand. While this initial C–H activation step is endergonic, an extremely favorable rebound step to form a C–O bond enables the overall reactivity. This mechanistic scenario has been confirmed by the isolation and characterization of the chiral CoIII-alkoxide compound 5 as well as spectroscopic characterization of the deuterated intermediate 4ox-d45. DFT calculated reaction energetics as well as spectroscopic parameters also support this picture.
Efforts to measure the kinetics of C–H activation provide a lower bound for the first order rate constant for C–H activation of 130 s−1, a value comparable to the 1400 s−1 value determined for C–H activation by compound I in P450 enzymes.5 Thus, by oxidizing a terminal CoIII-oxo complex, we are able to generate a hydroxylating intermediate that is capable of activating strong C–H bonds with similar rate constants and mechanistic features to enzymatic systems. These studies constitute one of the few well-characterized examples of activation of strong C–H bonds by a transition metal-oxo complex. In particular, this well-defined system, where we can measure and determine thermodynamic parameters, validates the proposed importance of rebound in enzymatic and synthetic catalysts.
EXPERIMENTAL SECTION
Materials and Instrumentation.
All manipulations were performed under a dry nitrogen atmosphere using either standard Schlenk techniques or in an mBraun Unilab Pro glovebox unless otherwise stated. All chemicals were obtained from commercial sources and used as received unless otherwise stated. Adamantane-d16 was purchased from CDN Isotopes and used as received. Solvents were dried on a solvent purification system from Pure Process Technologies before storing over 4 Å molecular sieves under N2. Tetrahydrofuran (THF), THF-d8, and diethyl ether (Et2O) were stirred over NaK alloy and passed through a column of activated alumina prior to storing over 4 Å sieves under N2. PhB(AdImH)3OTf2 and NaBArF4 were prepared according to previously reported procedures.43,72 [HMTBD][BF4] was synthesized according to a previously reported procedure.41 FcBF4 and TBAPF6 were recrystallized prior to use. Na18OH was prepared following a previously reported procedure.44 EPR spectra were recorded on a Bruker Elexsys E500 spectrometer with an Oxford ESR 900 X-band cryostat and a Bruker Cold-Edge Stinger. UV-vis spectra were recorded on a Thermo Scientific Evolution 300 spectrometer with the VISIONpro software suite. A standard 1 cm quartz cuvette with an air-tight screw cap with a puncturable Teflon seal was used for all measurements. A Unisoku CoolSpek cryostat was used for low temperature measurements. 1H, 13C{1H}, 11B{1H}, and 19F NMR spectra were recorded on either Bruker DRX-400 or AVANCE-500 spectrometers. 1H and 13C{1H} spectra were referenced to residual proteo-solvent peaks. 11B{1H} spectra were baseline corrected to remove the signal from the borosilicate tube. Combustion analysis was performed by Midwest Microlab. IR spectra were recorded on a Bruker Tensor II spectrometer with the OPUS software suite as mulls in Nujol oil pressed between KBr plates or as KBr pellets. Electrochemical measurements were carried out using a BAS Epsilon potentiostat and using BAS Epsilon software version 1.40.67NT. Magnetic moments were determined using the Evans method.73
Synthesis of 1-bromoadamantane-d15.
This compound was synthesized following a previously reported procedure.58 A 50 mL round bottom flask equipped with a stir bar was charged with 2.0 g (13 mmol) of adamantane-d16 and 5.0 mL of Br2 (97 mmol). A long reflux condenser was added and loosely capped with a septum equipped with a vent needle. The mixture was heated to reflux (~60 °C) for 3 h before being cooled to room temperature. The mixture was diluted with CCl4 (20 mL) and transferred to a separatory funnel. The solution was washed with saturated sodium bisulfite (NaHSO3) solution in 10 mL portions until the Br2 color was gone. CAUTION: Lots of heat and gas is released during this step. Take appropriate safety precautions. The now pale yellow CCl4 solution was washed twice with H2O before drying over MgSO4 and filtering to give a clear yellow solution. The solvent was removed in vacuo and the residue recrystallized from MeOH to give pure 1-bromoadamantane-d15 in 73% yield (2.21 g, 9.5 mmol). 2H NMR (CDCl3, 76.8 MHz): δ 2.33 (62H), 2.06 (32H), 1.68 (62H).
Synthesis of 1-(adamantyl-d15)-imidazole.
This compound was synthesized analogously to 1-adamantylimidazole.43 A 100 mL Schlenk tube with a Kontes valve was charged with 2.21 g (9.5 mmol) 1-bromoadamantane-d15, 2.6 g (38 mmol) imidazole, 2.0 mL toluene, and a stir bar. The Schlenk tube was sealed and heated to 150 °C behind a blast shield for 36 hours. CAUTION: Explosion hazard due to heating above the boiling point of toluene in a sealed vessel. After the reaction, the mixture was allowed to cool to room temperature before being unsealed and mixed with 50 mL of 1 M KOH. Dichloromethane (DCM, 50 mL) was added and the mixture transferred to a separatory funnel. The DCM layer was collected, dried over MgSO4, filtered and pumped down to a brown, sticky residue. Extraction into hot hexanes and removal of the solvent in vacuo afforded 1-(adamantyl-d15)-imidazole in 55% yield (1.12 g, 5.2 mmol). 1H NMR (CDCl3, 500 MHz): δ 7.63 (1H, Im-H), 2.06 (2H, Im-H). 2H NMR (CDCl3, 76.8 MHz): δ 2.19 (32H, Ad-2H), 2.05 (62H, Ad-2H), 1.70 (62H, Ad-2H).
Synthesis of PhB(Ad-d15ImH)3OTf2.
This compound was synthesized analogously to PhB(AdImH)3OTf2.43 Toluene (7 mL), PhBCl2 (240 μL, 1.8 mmol), 1-(adamantyl-d15)-imidazole (1.2 g, 5.5 mmol), and TMSOTf (670 μL, 3.6 mmol) were combined in a 50 mL round bottom Schlenk flask. The flask was equipped with a reflux condenser under active N2 flow and the heterogeneous mixture was heated to 100 °C overnight before being allowed to cool to room temperature. The solvent was decanted and the solid dissolved in boiling DCM. This solution was stored at −35 °C until pure PhB(Ad-d15ImH)3OTf2 crystallized as a white solid (714 mg, 0.69 mmol, 37% yield). 1H NMR (CDCl3, 500 MHz): δ 8.30 (3H, Im-H), 7.42 (6H, Im-H, Ph-H), 7.27 (3H, Im-H), 7.23 (2H, Ph-H). 2H NMR (CDCl3, 76.8 MHz): δ 2.16 (br, 272H, Ad-2H), 1.68 (182H, Ad-2H).
Synthesis of 1.
To a suspension of 5.0 g (5.0 mmol) of PhB(AdImH)3OTf2 in 100 mL THF at −78 °C was added 3.05 equivalents of LDA (15.4 mmol, prepared in situ from a 1:1 mixture of n-BuLi and HN(iPr)2 in 25 mL THF at −78 °C). This heterogeneous mixture was allowed to stir at −78 °C for 1–1.5 h until the mixture became homogeneous and yellowy-pink in color. Solid CoCl2 (650 mg, 5.0 mmol) was added and the reaction allowed to warm to room temperature with stirring overnight. The solution was pumped down and dried at ~75 °C to ensure complete removal of THF. The blue residue was dissolved in DCM and filtered through Celite to remove LiCl and LiOTf salts. This solution was pumped down and washed with THF. A bright blue solid was collected by filtration and dried to give 1 in 78% yield (3.1 g, 3.9 mmol). Single crystals suitable for X-ray diffraction were grown from a toluene solution of 1 layered under pentane at −35 °C and had a toluene molecule in the unit cell. 1H NMR (C6D6, 400 MHz): δ 92.71 (3H, Im-H), 33.69 (3H, Im-H), 12.92 (18H, Ad-H), 5.55 (1H, Ph-H), 5.42 (9H, Ad-H), 5.13 (2H, Ph-H), 4.25 (9H, Ad-H), 1.80 (2H, Ph-H), 0.72 (9H, Ad-H). 13C NMR (C6D6, 100 MHz): δ 199.3, 130.6, 128.3, 125.9, 123.8, 112.5, 57.5, 32.5. 11B NMR (C6D6, 128 MHz): δ 68.8. μeff (C6D6): 4.32 B.M. IR (KBr, cm−1): 3145 (w), 3070 (w), 3033 (w), 2908 (s), 2853 (s), 1549 (w), 1477 (w), 1453 (m), 1387 (m), 1375 (w), 1359 (m), 1329 (m), 1309 (m), 1273 (s), 1240 (w), 1159 (s), 1119 (m), 1103 (m), 1076 (w), 1016 (s), 938 (w), 895 (w), 879 (m), 834 (m), 816 (m), 804 (m), 786 (s), 771 (w), 736 (sh), 725 (sh), 712 (s), 681 (s). UV-vis, nm in THF (ε, M−1cm−1): 584 (514), 616 (774), 674 (1007). Anal. Calc. for C52H64BClCoN6 (1•toluene): C 71.11, H 7.34, N 9.57, Found: C 71.16, H 7.30, N 9.57.
Synthesis of 1-d45.
Isotopically labeled 1 was synthesized following the above procedure, substituting PhB(Ad-d15ImH)3OTf2 for PhB(AdImH)3OTf2. The purity of 1-d45 was confirmed by 1H NMR spectroscopy.
Synthesis of 2.
To a solution of 1 in 15 mL THF (450 mg, 0.57 mmol) was added 3 equivalents of solid NaOH (69 mg, 1.7 mmol) that was ground up to a fine powder. This reaction was allowed to stir at room temperature for 3 days, during which the solution color changed from blue to purple. The solution was filtered to remove excess NaOH and NaCl and then pumped down. The purple residue was redissolved in THF and layered under pentane at −35 °C to afford pure 2 as a bright violet solid in 72% yield (320 mg, 0.41 mmol). Single crystals suitable for X-ray diffraction were grown from a toluene solution of 2 layered under pentane at −35 °C. 1H NMR (C6D6, 400 MHz): δ 91.32 (3H, Im-H), 44.94 (3H, Im-H), 8.27 (2H, Ph-H), 7.60 (2H, Ph-H), 7.52 (1H, Ph-H), 5.16 (18H, Ad-H), 4.35 (9H, Ad-H), 4.00 (9H, Ad-H), 1.24 (9H, Ad-H). 13C NMR (C6D6, 100 MHz): δ 222.1, 139.8, 129.6, 128.3, 126.9, 105.7, 55.3, 39.5. 11B NMR (C6D6, 128 MHz): δ 127.3. μeff (C6D6): 4.22 B.M. IR (KBr, cm−1): 3142 (w, νO-H), 3042 (w), 2906 (s), 2850 (s), 1616 (br), 1534 (br), 1477 (w), 1453 (m), 1433 (w), 1386 (m), 1359 (m), 1329 (m), 1309 (m), 1273 (s), 1239 (w), 1165 (s), 1155 (s), 1121 (s), 1103 (s), 1076 (w), 1014 (s), 879 (m), 835 (m), 816 (w), 802 (m), 785 (m), 731 (s), 709 (s), 676 (m). UV-vis, nm in THF (ε, M−1cm−1): 514 (251), 550 (317), 568 (322), 624 (sh, 238), 646 (247), 716 (179), 1100 (169). Anal. Calc. for C45H57BCoN6O: C 70.40, H 7.48, N 10.95, Found: C 70.23, H 7.53, N 10.66.
Synthesis of 2-d45.
Isotopically labeled 2 was synthesized following the above procedure, substituting 1-d45 for 1. The purity of 2-d45 was confirmed by 1H NMR spectroscopy.
Synthesis of 2-18O.
Isotopically labeled 2 was synthesized following the above procedure, substituting Na18OH for natural abundance NaOH. The purity of 2-18O was confirmed via 1H NMR spectroscopy.
Synthesis of 3.
A solution of 2 in 2.0 mL of THF (25 mg, 33 μmol) was cooled to −35 °C before FcBF4 (8.9 mg, 33 μmol) dissolved in minimal MeCN was added. A color change from violet to bright green was observed and this solution was layered under Et2O at −35 °C to afford single crystals of 3. NMR spectra were recorded on an in situ generated solution of 3 in THF-d8 and UV-vis spectra were recorded on an in situ generated solution of 3 in THF. 1H NMR (THF-d8, 500 MHz, −35 °C): δ 10.61 (1H, O-H), 7.82 (2H, Ph-H), 7.66 (3H, Im-H), 7.56 (3H, Ph-H), 7.29 (3H, Im-H), 2.35 (18H, Ad-H), 2.25 (9H, Ad-H), 1.78 (18H, Ad-H). 19F NMR (THF-d8, 471 MHz, −35 °C): δ 162.1. UV-vis, nm in THF at −80 °C (ε, M−1cm−1): 458 (1267), 636 (sh, 503), 718 (898). Due to thermal instability, 11B NMR, 13C NMR, and IR spectroscopic data and elemental analysis were not able to be collected for this complex.
Synthesis of 4.
A solution of 2 in 12 mL THF (60 mg, 78 μmol) was cooled to −35 °C. A solution of FcBF4 (22 mg, 78 μmol) in 0.5 mL MeCN was added to result in a color change from violet to green. Next, a solution of KOtBu (8.8 mg, 78 μmol) in 1.0 mL THF was added, which resulted in a color change to red-purple. The reaction was allowed to stir for ~5 minutes at −35 °C before pumping down at room temperature. The dark purple and blue residue was triterated with pentane and dried extensively to remove HOtBu and leave a lighter purple only residue. This was washed with MeCN to remove Fc and other Co-containing impurities. The solid was dried extensively to remove traces of MeCN before being dissolved in toluene and layered under pentane at −35 °C. Dark purple crystals of pure 4 were collected in variable yields (13–33 mg, 17–43 μmol, 22–55% yield). Single crystals suitable for X-ray diffraction were grown from a toluene solution of 4 layered under pentane at −35 °C. 1H NMR (C6D6, 400 MHz): δ 7.95 (2H, Ph-H), 7.39 (2H, Ph-H), 7.35 (1H, Ph-H), 7.06 (3H, Im-H), 6.84 (3H, Im-H), 2.77 (18H, Ad-H), 2.10 (9H, Ad-H), 1.87 (9H, Ad-H), 1.57 (9H, Ad-H). 13C NMR (C6D6, 100 MHz): δ 134.5, 122.4, 118.8, 58.2, 43.0, 36.1, 30.5. 11B NMR (C6D6, 128 MHz): δ −1.8. IR (Nujol, cm−1): 1459 (s), 1410 (m), 1376 (s), 1360 (sh), 1340 (m), 1326 (s), 1307 (m), 1275 (m), 1235 (m), 1186 (s), 1168 (s), 1129 (w), 1105 (m), 1073 (w), 1023 (s), 885 (m), 832 (m), 807 (m, νCo–O), 792 (w), 714 (m), 694 (s). UV-vis, nm in THF (ε, M−1cm−1): 488 (529), 554 (506), 712 (sh, 178), 940 (tr, 76). Anal. Calc. for C45H56BCoN6O: C 70.49, H 7.36, N 10.96, Found: C 70.35, H 7.33, N 10.89.
Synthesis of 4-d45.
Isotopically labeled 4 was synthesized following the above procedure, substituting 2-d45 for 2. After work-up, this sample of 4-d45 was contaminated with 29% of 2-d45 as seen in 1H NMR spectroscopy. It was used as is and not purified further.
Synthesis of 4-18O.
Isotopically labeled 4 was synthesized following the above procedure, substituting 2-18O for natural abundance 2. The purity of 4-18O was confirmed via 1H NMR spectroscopy.
Synthesis of 5.
A solution of 4 in 12 mL THF (60 mg, 78 μmol) was cooled to −50 °C. A solution of KOtBu in 1.0 mL THF (8.8 mg, 78 μmol) was added prior to addition of a solution of FcBF4 in 0.5 mL MeCN (44 mg, 160 μmol). A color change from purple to red-orange was observed. This reaction was allowed to stir for ~15 minutes at −50 °C before pumping down at room temperature. The red residue was triterated with pentane before being washed with Et2O to remove Fc. The remaining solid was dissolved in MeCN and layered under Et2O at −35 °C to give pure 5 as a red powder (43 mg, 50 μmol, 64% yield). 1H NMR (CD3CN, 400 MHz): δ 7.78 (2H, Ph-H), 7.55 (3H, Ph-H), 7.53 (1H, Im-H), 7.46 (1H, Im-H), 7.37 (2H, Im-H), 7.31 (1H, Im-H), 6.87 (1H, Im-H), 3.78 (1H, Ad-H), 2.62 (3H, Ad-H), 2.53 (1H, Ad-H), 2.48 (6H, Ad-H), 2.37 (3H, Ad-H), 2.30 (7H, Ad-H), 2.22 (1H, Ad-H), 2.00 (1H, Ad-H), 1.89–1.78 (16H, Ad-H), 1.72 (3H, Ad-H), 1.60 (1H, Ad-H), 1.47 (1H, Ad-H). 13C NMR (CD3CN, 100 MHz): δ 134.6, 129.7, 129.5, 127.8, 126.7, 126.5, 123.8, 122.5, 121.4, 80.5, 65.2, 59.5, 59.2, 46.4, 45.7, 43.0, 40.9, 40.0, 37.1, 36.5, 36.3, 36.2, 36.0, 35.7, 31.2, 30.7, 30.5, 30.3, 30.2, 29.9. 11B NMR (CD3CN, 128 MHz): δ −1.2. 19F NMR (CD3CN, 471 MHz): δ −151.9. IR (KBr, cm−1): 3173 (w), 3134 (m), 2906 (s), 2852 (s), 1626 (br), 1542 (m), 1450 (m), 1430 (s), 1409 (m), 1380 (m), 1363 (w), 1339 (m), 1306 (m), 1248 (m), 1219 (m), 1192 (s), 1172 (m), 1105 (s), 1062 (s), 1029 (s), 933 (m), 903 (w), 891 (s), 832 (s), 816 (w), 801 (w), 785 (m), 764 (m), 725 (s), 697 (s). UV-vis, nm in MeCN (ε, M−1cm−1): 406 (sh, 799), 492 (736), 526 (695), 648 (sh, 174). Anal. Calc. for C45H55B2CoF4N6O: C 63.40, H 6.50, N 9.86, Found: C 63.25, H 6.52, N 9.40.
Ion Exchange to Produce 5-BArF4.
A solution of 15 mg (18 μmol) NaBArF4 in 1.2 mL Et2O was added to 15 mg (18 μmol) of solid 5. The mixture was allowed to stir until all of the red solid had dissolved into solution. This solution was filtered to remove NaBF4 and layered under pentane at −35 °C to afford single crystals of 5-BArF4 suitable for X-ray diffraction.
Cyclic Voltammetry.
For cyclic voltammetry experiments, 5.0 mL of a 3 mM solution of the complex of interest were prepared in THF. Tetrabutylammonium hexafluorophosphate (TBAPF6) was used as the supporting electrolyte at a concentration of 0.1 M. A glassy carbon electrode with a 3 mm diameter was used as the working electrode with a platinum wire as the counter electrode. A silver wire was used as the reference electrode and referenced to the Fc/Fc+ couple. Cyclic voltammograms were collected at a standard scan rate of 100 mV/s.
Procedure for Determining the pKa of 3.
The pKa of 3 was determined by titrating 4 with [HMTBD][BF4]. The titration of 4 with [HMTBD][BF4] was monitored by 1H NMR spectroscopy. As the product of the reaction, 3, is unstable above −35 °C, the samples were prepared and stored cold and the spectra were collected at −35 °C. Spectra were collected on three separate samples for each amount of acid added. To prepare a typical sample, 0.25 mL of a 10 mM solution of 4 in THF-d8 was transferred to an NMR tube. Next, 0.10 mL of a 25 mM solution of hexamethyldisiloxane (TMS2O) in THF-d8 was added as an internal standard followed by addition of varying volumes of a 25 mM solution of [HMTBD][BF4] in THF-d8 to reach 0.75, 1.0, or 1.5 equivalents of added acid relative to 4. Finally, the samples were diluted with THF-d8 to reach a total volume of 0.50 mL and initial concentrations of 5 mM 4, 5 mM TMS2O, and 3.75–7.5 mM [HMTBD][BF4]. It was discovered upon collecting the spectra that all species in solution (3, 4, [HMTBD][BF4], and MTBD) were in rapid equilibrium resulting in the appearance of coalesced peaks in the 1H NMR spectra. The ratios of the concentrations of 3:4 and [HMTBD][BF4]:MTBD were determined according to Equations 2–4. The peaks used for analysis were an Im-H peak and two Ad-H peaks for 3/4 and the methyl protons of MTBD/[HMTBD][BF4] (Table S1). From this data the equilibrium constant for the reaction shown in Equation 5, Keq, was calculated and the values obtained from each 3/4 peak averaged. In THF, these species exist as ion pairs in solution so the calculated equilibrium constant is for those ion pairs, not the true pKa values. Using Equations 6 and 7,49 we can calculate ΔpKa relative to the pKa of [HMTBD]+ (18.0 in THF49) using the methods described in Reference48 to estimate Kd values (Table S2). Finally, the relationship shown in Equation 8 was used to calculate the pKa of 3.
| (2) |
| (3) |
| (4) |
| (5) |
| (6) |
| (7) |
| (8) |
Procedure for Oxidations of 4 Monitored by UV-vis Spectroscopy.
In the glovebox, 2.0 mL of a 1.25 mM solution of 4 in THF or 2-MeTHF was transferred to a standard 1 cm cuvette and sealed with a puncturable cap. The cuvette was then transferred to the cryostat and cooled to the desired temperature (−80 °C, −105 °C, or −130 °C). After an initial scan, 50 μL of a 50 mM solution (1 equivalent) of FcBF4 in 2:1 THF/MeCN (100 μL of a 25 mM solution in 1:1 2MeTHF/EtCN for experiments at −130 °C) was injected into the cuvette. The reaction was monitored by collecting spectra every 45 seconds until the spectrum stopped changing.
Procedure for Oxidation of 4 in the Presence of Base Monitored by UV-vis Spectroscopy.
In the glovebox, 2.0 mL of a 1.25 mM solution of 4 in THF was transferred to a standard 1 cm cuvette and sealed with a puncturable cap. The cuvette was then transferred to the cryostat and cooled to −80 °C. After an initial scan, 25 μL of a 100 mM solution (1 equivalent) of KOtBu in THF was injected and a spectrum collected to ensure no side reactions had occurred. Next, 100 μL of a 50 mM solution (2 equivalents) of FcBF4 in 2:1 THF/MeCN was injected into the cuvette. The reaction was monitored by collecting spectra every 45 seconds until the spectrum stopped changing.
Procedure for Oxidation of 4 Monitored by Low Temperature NMR Spectroscopy.
In a small vial in the glovebox, cooled 700 μL of a 2.0 mM solution of 4 in THF-d8 to −80 °C in the cold well. Next, 14 μL (1 equivalent) or 7 μL (0.5 equivalents) of a 100 mM solution of FcBF4 in CD3CN were added and the mixture allowed to react for ~10 minutes before being transferred to a pre-cooled J. Young NMR tube. The tube was transported to the NMR spectrometer in a −78 °C cold bath before spectra were collected at −30 °C.
Procedure for Oxidation of 4 in the Presence of Base Monitored by Low Temperature NMR Spectroscopy.
In the glovebox, 500 μL of a solution of 5 mM 4 and 5 mM KOtBu in THF-d8 was transferred to a standard NMR tube and sealed with a puncturable septum. The tube was removed from the glovebox and cooled to −40 °C in a cold bath. After cooling, 50 μL of a 100 mM solution (2 equivalents) of FcBF4 in CD3CN was injected through the septum. The solution was thoroughly mixed and allowed to react for ~10 minutes before spectra were collected at −35 °C.
Estimation of a Lower Bound for the k for C–H Activation by 4ox.
A lower bound for the rate constant for C–H activation by 4ox was found by determining the second order rate constant for oxidation of 4 with FcBF4 by UV-vis spectroscopy where we monitored the consumption of 4 by the disappearance of its trailing absorbance at 940 nm. This reaction is extremely fast and must be carried out stoichiometrically, prompting the use of the method of initial rates.71 In a typical experiment, 2.0 mL of a 1.25 mM solution of 4 in THF was transferred to a standard 1 cm cuvette and sealed with a puncturable cap. The cuvette was then transferred to the cryostat and cooled to the desired temperature (−40 °C, −80 °C, or −105 °C). Single wavelength data collection at 940 nm was started. Data was collected every 20 ms with an integration time of 10 ms. After the initial absorbance had stabilized, 50 μL of a 50 mM solution (1 equivalent) of FcBF4 in 2:1 THF/MeCN was injected into the cuvette. Data was collected for at least 30 seconds. At each temperature, absorbance data were converted into a concentration versus time plot using Beer’s Law. Due to mixing limitations of our instrument, the first 0.3, 0.4, or 0.5 seconds of data were disregarded (as determined by visual inspection of an anomalous spike in the absorbance data, Figure S40) at −40 °C, −80 °C, and −105 °C, respectively. Larger portions of the data were rejected from analysis at lower temperatures due to increasing solvent viscosity that resulted in longer mixing times. A linear fit of the first 30% of the concentration versus time profile gave an “initial rate” for the reaction (Figures S32–S34). Typically, initial rates are performed on the first 5% of the reaction, but mixing limitations precluded this analysis in our case. Therefore, this “initial rate” is an underestimation of the true rate. Nonetheless, we can use this “initial rate” and the initial concentrations of 4 and FcBF4 to calculate a lower bound on the second order rate constant, k2, for this reaction at a given temperature (Equation 9). A linear fit of a plot of ln(k2/T) versus 1/T allows for the extrapolation of this lower bound k2 to other temperatures (Figure S39). Assuming Equation 10 is true, conversion of this lower bound k2 value to a lower bound first order rate constant, k, for C–H activation by 4ox was done using Equations 9 and 11 to give Equation 12, which was evaluated assuming 1% of initial 4 had been converted into 4ox. This percentage was chosen with the following justification: a reasonable lower bound for the concentration of 4ox observable by EPR spectroscopy is 1% of the initial concentration of 4. Since we never observed 4ox by EPR, that puts an upper bound on the concentration of 4ox as 1% of the initial concentration of 4. Assuming that during this initial “1%” build-up of 4ox there is no loss of 4ox, we can evaluate Equation 12 below with [4] = [FcBF4] = 0.99*[4]0.
| (9) |
| (10) |
| (11) |
| (12) |
Procedure for Oxidation of 4-d45 Monitored by UV-vis Spectroscopy.
In the glovebox, 2.0 mL of a solution of 4-d45 (contaminated with 29% 2-d45) in THF (1.25 mM total Co concentration) was transferred to a standard 1 cm cuvette and sealed with a puncturable cap. The cuvette was then transferred to the cryostat and cooled to the desired temperature −105 °C. After an initial scan, 50 μL of a 50 mM solution (1 equivalent relative to total Co) of FcBF4 in 2:1 THF/MeCN was injected into the cuvette. The reaction was monitored by collecting spectra every 45 seconds until the spectrum stopped changing. The spectrum of 4ox-d45 was revealed by subtracting off 29% of the spectrum of 3-d45 expected to form from oxidation of the 2-d45 contaminant.
Procedure for Oxidation of 4-d45 Monitored by EPR Spectroscopy.
In the glovebox, 150 μL of a solution of 4-d45 (contaminated with 29% 2-d45) in THF-d8 (10 mM total Co concentration) was transferred to an EPR tube and sealed with a puncturable septum. The tube was removed from the glovebox and cooled in an ethanol/liquid nitrogen bath which can reach temperatures as low as −116 °C. After cooling (during which the solution stayed liquid), 15 μL of a 100 mM solution (1 equivalent relative to total Co) of FcBF4 in CD3CN was injected through the septum. The solutions were mixed as rapidly and completely as possible before freezing in liquid nitrogen. An EPR spectrum was collected at 15 K within ~5 minutes of freezing the sample. Any 3-d45 expected to form from oxidation of the 2-d45 contaminant would be silent (S = 0) by EPR spectroscopy and therefore not convolute the spectrum. The EPR spectrum was simulated using the simulation software package in the program SpinCount.74 In order to estimate the concentration of the EPR active species, spin integration versus an external 0.25 mM CuSO4 standard was carried out. Due to instrumental issues, this external standard was collected on a separate day, under close, but not identical, experimental conditions (microwave frequency ≈ 9.63 GHz, microwave power ≈ 0.2 mW, T ≈ 15 K). Furthermore, we were unable to investigate the saturation behavior of the Co sample. This analysis indicates a spin-active Co concentration of ~4.5 mM, which would correspond to a yield of ~60%. We would like to emphasize that these numbers must be interpreted cautiously due to the imperfect integration standard measurement.
Computational Methods.
All DFT calculations were performed in ORCA 5.0.0 using the O3LYP functional with default grid settings.75–78 The CPCM continuum polarization model with gaussian charges and the dielectric constant of THF was included.79 The basis sets of Weigend and Ahrlich were employed: cobalt was given def2-TZVPP; all ligands bound to cobalt, the transferring hydrogen, and the carbon donating the transferring hydrogen were given def2-TZVP; the secondary hydrogen also bound to the donating carbon was given def2-SVP; all other atoms were given def2-SV(P).80,81 We confirmed the barrier height to C–H activation was unchanged within 0.1 kcal/mol with respect to larger basis sets and integration grids. Frequency calculations were performed numerically. All minima were confirmed to have zero imaginary frequencies and saddle points to have exactly one imaginary frequency, excepting for a few modes with magnitudes less than 40 cm−1 which all corresponded to rotating adamantyl groups or cyclopentadienyl ligands. Thermodynamic values were computed using the QRRHO model of Grimme;82 spurious imaginary modes (but not the reactive modes) were included to keep a consistent set of normal modes in all free energy differences. TD-DFT, population analyses, and Co–O bond metrics of 4ox were calculated at the optimized geometry with a slightly different basis set; Co and O were given def2-QZVPP, the carbene carbons were given def2-TZVPP, and all other atoms given def2-SV(P). TD-DFT was calculated without frozen core orbitals. The delocalization index, which measures the number of electron pairs shared in a bond and can serve as an estimate of the bond order,83–85 was calculated in Becke fuzzy atomic space using the Multiwfn program.86,87 Intrinsic atomic populations were calculated in Iboview with exponent 4.67,68
Crystallographic Details.
The diffraction data for 3 were measured at 100 K on a Bruker D8 fixed-chi with PILATUS1M (CdTe) pixel array detector (synchrotron radiation, λ = 0.41328 Å (30 KeV)) at the Chem-MatCARS 15-ID-B beamline at the Advanced Photon Source (Argonne National Laboratory). The diffraction data for 1, 2, 4, and 5 were measured at 100 K on a Bruker D8 VENTURE diffractometer equipped with a microfocus Mo-target X-ray tube (λ = 0.71073 Å) and PHOTON 100 CMOS detector. Data reduction and integration were performed with the Bruker APEX3 software package (Bruker AXS, version 2017.3–0, 2018). Data were scaled and corrected for absorption effects using the multi-scan procedure as implemented in SADABS (Bruker AXS, version 2014/5).88 The structures were solved by SHELXT (Version 2014/5)89 and refined by a full-matrix least-squares procedure using OLEX2 (XL refinement program version 2018/1).90,91 Structure solutions were performed with the use of standard restraints and constraints as implemented in ShelXL. We note that the structures of 3, 4, and 5 have A level CheckCIF alerts. For 3, this arises from the fact that this data set was collected on a synchrotron, resulting in a somewhat limited data collection. For 4, this alert arises from the limited quality of the crystal. For 5, there are several alerts. These arise from an extremely disordered structure, and we only present the connectivity of this complex. In all cases, the alerts do not affect our discussion of the complexes. Additional crystallographic and refinement data can be found in the Supporting Information.
Supplementary Material
ACKNOWLEDGMENT
Work presented here was funded by the following sources: NSF CAREER award Grant No. 1654144, and the University of Chicago. J.E.S. thanks the Department of Defense for a National Defense Science and Engineering Graduate Fellowship (00003765) and J.S.A. thanks the Sloan Foundation for a Research Fellowship (FG-2019-11497). We are grateful for the support of the University of Chicago Research Computing Center for assistance with the calculations carried out in this work. ChemMatCARS Sector 15 is principally supported by the Divisions of Chemistry (CHE) and Materials Research (DMR), National Science Foundation (NSF), under Grant No. NSF/CHE1346572. Use of the PILATUS3 X CdTe 1M detector is supported by the National Science Foundation under the grant number NSF/DMR-1531283. Use of the Advanced Photon Source, an Office of Science User Facility operated for the U.S. Department of Energy (DOE) Office of Science by Argonne National Laboratory, was supported by the U.S. DOE under Contract No. DEAC02-06CH11357. We would also like to acknowledge Margaret Kelty for collecting the beautiful EPR spectrum shown in Figure 3.
Footnotes
The Supporting Information is available free of charge at http://pubs.acs.org.
NMR, EPR, IR, and UV-vis spectra for all compounds, CV data for compounds, UV-vis spectra of reactions, kinetic data, crystallographic details, supplementary tables and schemes, xyz coordinates for DFT optimized structures (PDF)
The authors declare no competing financial interest.
REFERENCES
- (1).White MC; Zhao J “Aliphatic C–H Oxidations for Late-Stage Functionalization.” J. Am. Chem. Soc 2018, 140 (43), 13988–14009. [DOI] [PMC free article] [PubMed] [Google Scholar]
- (2).Milan M; Salamone M; Costas M; Bietti M “The Quest for Selectivity in Hydrogen Atom Transfer Based Aliphatic C–H Bond Oxygenation.” Acc. Chem. Res 2018, 51 (9), 1984–1995. [DOI] [PubMed] [Google Scholar]
- (3).de Montellano PRO. “Hydrocarbon Hydroxylation by Cytochrome P450 Enzymes.” Chem. Rev 2009, 110 (2), 932–948. [DOI] [PMC free article] [PubMed] [Google Scholar]
- (4).Hausinger RP “Critical Reviews in Biochemistry and Molecular Biology Fe(II)/α-Ketoglutarate-Dependent Hydroxylases and Related Enzymes Fe(II)/α-Ketoglutarate-Dependent Hydroxylases and Related Enzymes.” Crit. Rev. Biochem. Mol. Biol 2004, 39 (1), 21–68. [DOI] [PubMed] [Google Scholar]
- (5).Rittle J; Green MT “Cytochrome P450 Compound I: Capture, Characterisation, and C-H Bond Activation Kinetics.” Science. 2010, 330, 933–937. [DOI] [PubMed] [Google Scholar]
- (6).Yosca TH; Rittle J; Krest CM; Onderko EL; Silakov A; Calixto JC; Behan RK; Green MT “Iron(IV)Hydroxide pKa and the Role of Thiolate Ligation in C-H Bond Activation by Cytochrome P450.” Science. 2013, 342 (6160), 825–829. [DOI] [PMC free article] [PubMed] [Google Scholar]
- (7).Mittra K; Green MT “Reduction Potentials of P450 Compounds I and II: Insight into the Thermodynamics of C–H Bond Activation.” J. Am. Chem. Soc 2019, 141 (13), 5504–5510. [DOI] [PMC free article] [PubMed] [Google Scholar]
- (8).Ortiz de Montellano PR; Stearns RA “Timing of the Radical Recombination Step in Cytochrome P-450 Catalysis with Ring-Strained Probes.” J. Am. Chem. Soc 1987, 109 (11), 3415–3420. [Google Scholar]
- (9).Saouma CT; Mayer JM “Do Spin State and Spin Density Affect Hydrogen Atom Transfer Reactivity?” Chem. Sci 2014, 5 (1), 21–31. [DOI] [PMC free article] [PubMed] [Google Scholar]
- (10).Shaik S; Cohen S; Wang Y; Chen H; Kumar D; Thiel W “P450 Enzymes: Their Structure, Reactivity, and Selectivity—Modeled by QM/MM Calculations.” Chem. Rev 2010, 110 (2), 949–1017. [DOI] [PubMed] [Google Scholar]
- (11).Shaik S; Kumar D; de Visser SP; Altun A; Thiel W “Theoretical Perspective on the Structure and Mechanism of Cytochrome P450 Enzymes.” Chem. Rev 2005, 105 (6), 2279–2328. [DOI] [PubMed] [Google Scholar]
- (12).Costas M Remote Oxidation of Aliphatic C-H Bonds with Biologically Inspired Catalysts. In Remote C-H Bond Functionalizations; Wiley, 2021; pp 383–421. [Google Scholar]
- (13).Groves JT; Nemo TE; Myers RS “Hydroxylation and Epoxidation Catalyzed by Iron-Porphine Complexes. Oxygen Transfer from Iodosylbenzene.” J. Am. Chem. Soc 1979, 101 (4), 1032–1033. [Google Scholar]
- (14).Groves JT; Nemo TE “Aliphatic Hydroxylation Catalyzed by Iron Porphyrin Complexes.” J. Am. Chem. Soc 1983, 105 (20), 6243–6248. [Google Scholar]
- (15).Groves JT; Kruper WJ; Haushalter RC “Hydrocarbon Oxidations with Oxometalloporphinates. Isolation and Reactions of a (Porphinato)Manganese(V) Complex.” J. Am. Chem. Soc 1980, 102 (20), 6375–6377. [Google Scholar]
- (16).Dantignana V; Milan M; Cussó O; Company A; Bietti M; Costas M “Chemoselective Aliphatic C–H Bond Oxidation Enabled by Polarity Reversal.” ACS Cent. Sci 2017, 3 (12), 1350–1358. [DOI] [PMC free article] [PubMed] [Google Scholar]
- (17).Chen MS; White MC “A Predictably Selective Aliphatic C H Oxidation Reaction for Complex Molecule Synthesis.” Science. 2007, 318 (5851), 783–787. [DOI] [PubMed] [Google Scholar]
- (18).Leising RA; Norman RE; Que L “Alkane Functionalization by Nonporphyrin Iron Complexes: Mechanistic Insights.” Inorg. Chem 1990, 29 (14), 2553–2555. [Google Scholar]
- (19).Groves JT; Haushalter RC; Nakamura M; Nemo TE; Evans BJ “High-Valent Iron-Porphyrin Complexes Related to Peroxidase and Cytochrome P-450.” J. Am. Chem. Soc 1981, 103 (10), 2884–2886. [Google Scholar]
- (20).Groves JT; Stern MK “Synthesis, Characterization, and Reactivity of Oxomanganese(IV) Porphyrin Complexes.” J. Am. Chem. Soc 1988, 110 (26), 8628–8638. [Google Scholar]
- (21).Sorokin A; Robert A; Meunier B “Intramolecular Kinetic Isotope Effects in Alkane Hydroxylations Catalyzed by Manganese and Iron Porphyrin Complexes.” J. Am. Chem. Soc 1993, 115 (16), 7293–7299. [Google Scholar]
- (22).Chen K; Que L “Evidence for the Participation of a High-Valent Iron–Oxo Species in Stereospecific Alkane Hydroxylation by a Non-Heme Iron Catalyst.” Chem. Commun 1999, 8 (15), 1375–1376. [Google Scholar]
- (23).Cook SA; Borovik AS “Molecular Designs for Controlling the Local Environments around Metal Ions.” Acc. Chem. Res 2015, 48 (8), 2407–2414. [DOI] [PMC free article] [PubMed] [Google Scholar]
- (24).Barman SK; Yang M-Y; Parsell TH; Green MT; Borovik AS “Semiempirical Method for Examining Asynchronicity in Metal–Oxido-Mediated C–H Bond Activation.” Proc. Natl. Acad. Sci 2021, 118 (36), e2108648118. [DOI] [PMC free article] [PubMed] [Google Scholar]
- (25).Baglia RA; Prokop-Prigge KA; Neu HM; Siegler MA; Goldberg DP “Mn(V)(O) versus Cr(V)(O) Porphyrinoid Complexes: Structural Characterization and Implications for Basicity Controlling H-Atom Abstraction.” J. Am. Chem. Soc 2015, 137 (34), 10874–10877. [DOI] [PMC free article] [PubMed] [Google Scholar]
- (26).Gupta R; Borovik AS “Monomeric MnIII/II and FeIII/II Complexes with Terminal Hydroxo and Oxo Ligands: Probing Reactivity via O-H Bond Dissociation Energies.” J. Am. Chem. Soc 2003, 125 (43), 13234–13242. [DOI] [PubMed] [Google Scholar]
- (27).Yin G; Danby AM; Kitko D; Carter JD; Scheper WM; Busch DH “Understanding the Selectivity of a Moderate Oxidation Catalyst: Hydrogen Abstraction by a Fully Characterized, Activated Catalyst, the Robust Dihydroxo Manganese(IV) Complex of a Bridged Cyclam.” J. Am. Chem. Soc 2007, 129 (6), 1512–1513. [DOI] [PubMed] [Google Scholar]
- (28).Evans MG; Polanyi M “Inertia and Driving Force of Chemical Reactions.” Trans. Faraday Soc 1938, 34, 11–24. [Google Scholar]
- (29).Valdez-Moreira JA; Beagan DM; Yang H; Telser J; Hoffman BM; Pink M; Carta V; Smith JM “Hydrocarbon Oxidation by an Exposed, Multiply Bonded Iron(III) Oxo Complex.” ACS Cent. Sci 2021, 7 (10), 1751–1755. [DOI] [PMC free article] [PubMed] [Google Scholar]
- (30).Thyagarajan S; Incarvito CD; Rheingold AL; Theopold KH “Formation and Reactivity of a Cobalt(II) Hydroperoxide Intermediate.” Chem. Commun 2001, 2198–2199. [DOI] [PubMed] [Google Scholar]
- (31).Reinaud OM; Theopold KH “Hydrogen Tunneling in the Activation of Dioxygen by a Tris(Pyrazolyl)Borate Cobalt Complex.” J. Am. Chem. Soc 1994, 116 (15), 6979–6980. [Google Scholar]
- (32).Andris E; Navrátil R; Jašík J; Srnec M; Rodríguez M; Costas M; Roithová J “M−O Bonding Beyond the Oxo Wall: Spectroscopy and Reactivity of Cobalt(III)-Oxyl and Cobalt(III)-Oxo Complexes.” Angew. Chem., Int. Ed 2019, 58 (28), 9619–9624. [DOI] [PMC free article] [PubMed] [Google Scholar]
- (33).Hikichi S; Komatsuzaki H; Akita M; Moro-oka Y “Aliphatic C−H Bond Oxygenation by the CoIIOOX Species with the Hindered Hydrotris(Pyrazolyl)Borate Ligand (X = Co(II), Alkyl, H).” J. Am. Chem. Soc 1998, 120 (19), 4699–4710. [Google Scholar]
- (34).Hikichi S; Yoshizawa M; Sasakura Y; Komatsuzaki H; Moro-oka Y; Akita M “Structural Characterization and Intramolecular Aliphatic C−H Oxidation Ability of MIII(μ-O)2MIII Complexes of Ni and Co with the Hydrotris(3,5-Dialkyl-4-X-Pyrazolyl)Borate Ligands TpMe2,X (X=Me, H, Br) and TpiPr2.” Chem. - A Eur. J 2001, 7 (23), 5011–5028. [DOI] [PubMed] [Google Scholar]
- (35).Bryant JR; Mayer JM “Oxidation of C−H Bonds by [(Bpy)2(Py)RuIVO]2+ Occurs by Hydrogen Atom Abstraction.” J. Am. Chem. Soc 2003, 125 (34), 10351–10361. [DOI] [PubMed] [Google Scholar]
- (36).Cook GK; Mayer JM “C-H Bond Activation by Metal Oxo Species: Oxidation of Cyclohexane by Chromyl Chloride.” J. Am. Chem. Soc 1994, 116, 1855–1868. [Google Scholar]
- (37).Gardner KA; Kuehnert LL; Mayer JM “Hydrogen Atom Abstraction by Permanganate: Oxidations of Arylalkanes in Organic Solvents.” Inorg. Chem 1997, 36 (10), 2069–2078. [DOI] [PubMed] [Google Scholar]
- (38).Kaizer J; Klinker EJ; Oh NY; Rohde J-U; Song WJ; Stubna A; Kim J; Münck E; Nam W; Que L “Nonheme FeIVO Complexes That Can Oxidize the C−H Bonds of Cyclohexane at Room Temperature.” J. Am. Chem. Soc 2004, 126 (2), 472–473. [DOI] [PubMed] [Google Scholar]
- (39).Hong S; Pfaff FF; Kwon E; Wang Y; Seo M-S; Bill E; Ray K; Nam W “Spectroscopic Capture and Reactivity of a Low-Spin Cobalt(IV)-Oxo Complex Stabilized by Binding Redox-Inactive Metal Ions.” Angew. Chem., Int. Ed 2014, 53 (39), 10403–10407. [DOI] [PMC free article] [PubMed] [Google Scholar]
- (40).Wang B; Lee Y-M; Tcho W-Y; Tussupbayev S; Kim S-T; Kim Y; Seo MS; Cho K-B; Dede Y; Keegan BC; Ogura T; Kim SH; Ohta T; Baik M-H; Ray K; Shearer J; Nam W “Synthesis and Reactivity of a Mononuclear Non-Haem Cobalt(IV)-Oxo Complex.” Nat. Commun 2017, 8, 14839. [DOI] [PMC free article] [PubMed] [Google Scholar]
- (41).Goetz MK; Anderson JS “Experimental Evidence for pKa-Driven Asynchronicity in C–H Activation by a Terminal Co(III)–Oxo Complex.” J. Am. Chem. Soc 2019, 141 (9), 4051–4062. [DOI] [PubMed] [Google Scholar]
- (42).Yang J; Dong HT; Seo MS; Larson VA; Lee Y-M; Shearer J; Lehnert N; Nam W “The Oxo-Wall Remains Intact: A Tetrahedrally Distorted Co(IV)–Oxo Complex.” J. Am. Chem. Soc 2021, 143 (41), 16943–16959. [DOI] [PubMed] [Google Scholar]
- (43).Hill EA; Zhao N; Filatov AS; Anderson JS “Nickel(II)-Methyl Complexes Adopting Unusual Seesaw Geometries.” Chem. Commun 2020, 56 (57), 7861–7864. [DOI] [PubMed] [Google Scholar]
- (44).Goetz MK; Hill EA; Filatov AS; Anderson JS “Isolation of a Terminal Co(III)-Oxo Complex.” J. Am. Chem. Soc 2018, 140 (41), 13176–13180. [DOI] [PubMed] [Google Scholar]
- (45).Cowley RE; Bontchev RP; Duesler EN; Smith JM “Removing the Sting from the Tail: Reversible Protonation of Scorpionate Ligands in Cobalt(II) Tris(Carbene)Borate Complexes.” Inorg. Chem 2006, 45 (24), 9771–9779. [DOI] [PubMed] [Google Scholar]
- (46).Cirera J; Ruiz E; Alvarez S “Stereochemistry and Spin State in Four-Coordinate Transition Metal Compounds.” Inorg. Chem 2008, 47 (7), 2871–2889. [DOI] [PubMed] [Google Scholar]
- (47).Gardner JG; Schneider JE; Anderson JS “Two, Three, or Not to Be? Elucidating Multiple Bonding in d6 Pseudotetrahedral Oxo and Imide Complexes.” Inorg. Chem 2021, 60 (18), 13854–13860. [DOI] [PubMed] [Google Scholar]
- (48).Abdur-Rashid K; Fong TP; Greaves B; Gusev DG; Hinman JG; Landau SE; Lough AJ; Morris RH “An Acidity Scale for Phosphorus-Containing Compounds Including Metal Hydrides and Dihydrogen Complexes in THF: Toward the Unification of Acidity Scales.” J. Am. Chem. Soc 2000, 122 (38), 9155–9171. [Google Scholar]
- (49).Kolomeitsev AA; Koppel IA; Rodima T; Barten J; Lork E; Röschenthaler G-V; Kaljurand I; Kütt A; Koppel I; Mäemets V; Leito I “Guanidinophosphazenes: Design, Synthesis, and Basicity in THF and in the Gas Phase.” J. Am. Chem. Soc 2005, 127 (50), 17656–17666. [DOI] [PubMed] [Google Scholar]
- (50).Spaeth AD; Gagnon NL; Dhar D; Yee GM; Tolman WB “Determination of the Cu(III)-OH Bond Distance by Resonance Raman Spectroscopy Using a Normalized Version of Badger’s Rule.” J. Am. Chem. Soc 2017, 139 (12), 4477–4485. [DOI] [PMC free article] [PubMed] [Google Scholar]
- (51).Warren JJ; Tronic TA; Mayer JM “Thermochemistry of Proton-Coupled Electron Transfer Reagents and Its Implications.” Chem. Rev 2010, 110 (12), 6961–7001. [DOI] [PMC free article] [PubMed] [Google Scholar]
- (52).Dhar D; Tolman WB “Hydrogen Atom Abstraction from Hydrocarbons by a Copper(III)-Hydroxide Complex.” J. Am. Chem. Soc 2015, 137 (3), 1322–1329. [DOI] [PMC free article] [PubMed] [Google Scholar]
- (53).Zhang L; Liu Y; Deng L “Three-Coordinate Cobalt(IV) and Cobalt(V) Imido Complexes with N-Heterocyclic Carbene Ligation: Synthesis, Structure, and Their Distinct Reactivity in C-H Bond Amination.” J. Am. Chem. Soc 2014, 136 (44), 15525–15528. [DOI] [PubMed] [Google Scholar]
- (54).Kwon YM; Lee Y; Evenson GE; Jackson TA; Wang D “Crystal Structure and C–H Bond-Cleaving Reactivity of a Mononuclear CoIV–Dinitrate Complex.” J. Am. Chem. Soc 2020, 142 (31), 13435–13441. [DOI] [PMC free article] [PubMed] [Google Scholar]
- (55).Donoghue PJ; Tehranchi J; Cramer CJ; Sarangi R; Solomon EI; Tolman WB “Rapid C–H Bond Activation by a Monocopper(III)–Hydroxide Complex.” J. Am. Chem. Soc 2011, 133 (44), 17602–17605. [DOI] [PMC free article] [PubMed] [Google Scholar]
- (56).Mahapatra S; Halfen JA; Tolman WB “Mechanistic Study of the Oxidative N-Dealkylation Reactions of Bis(μ-Oxo)Dicopper Complexes.” J. Am. Chem. Soc 1996, 118 (46), 11575–11586. [Google Scholar]
- (57).England J; Guo Y; Farquhar ER; Young VG; Münck E; Que L “The Crystal Structure of a High-Spin Oxoiron(IV) Complex and Characterization of Its Self-Decay Pathway.” J. Am. Chem. Soc 2010, 132 (25), 8635–8644. [DOI] [PMC free article] [PubMed] [Google Scholar]
- (58).Barfield M; Marshall JL; Canada ED “Nuclear Spin-Spin Coupling via Nonbonded Interactions. 2. γ-Substituent Effects for Vicinal Coupling Constants Involving 13C.” J. Am. Chem. Soc 1980, 102 (1), 7–12. [Google Scholar]
- (59).Neese F “A Critical Evaluation of DFT, Including Time-Dependent DFT, Applied to Bioinorganic Chemistry.” JBIC J. Biol. Inorg. Chem. 2006 116 2006, 11 (6), 702–711. [DOI] [PubMed] [Google Scholar]
- (60).Jenkins DM; Di Bilio AJ; Allen MJ; Betley TA; Peters JC “Elucidation of a Low Spin Cobalt(II) System in a Distorted Tetrahedral Geometry.” J. Am. Chem. Soc 2002, 124 (51), 15336–15350. [DOI] [PubMed] [Google Scholar]
- (61).McAlpin JG; Stich TA; Ohlin CA; Surendranath Y; Nocera DG; Casey WH; Britt RD “Electronic Structure Description of a [Co(III)3Co(IV)O4] Cluster: A Model for the Paramagnetic Intermediate in Cobalt-Catalyzed Water Oxidation.” J. Am. Chem. Soc 2011, 133 (39), 15444–15452. [DOI] [PubMed] [Google Scholar]
- (62).Stich TA; McAlpin JG; Wall RM; Rigsby ML; David Britt R “Electron Paramagnetic Resonance Characterization of Dioxygen-Bridged Cobalt Dimers with Relevance to Water Oxidation.” Inorg. Chem 2016, 55 (24), 12728–12736. [DOI] [PubMed] [Google Scholar]
- (63).Li Y; Handunneththige S; Farquhar ER; Guo Y; Talipov MR; Li F; Wang D “Highly Reactive CoIII,IV2(μ-O)2 Diamond Core Complex That Cleaves C–H Bonds.” J. Am. Chem. Soc 2019, 141 (51), 20127–20136. [DOI] [PMC free article] [PubMed] [Google Scholar]
- (64).Zolnhofer EM; Käß M; Khusniyarov MM; Heinemann FW; Maron L; Van Gastel M; Bill E; Meyer K “An Intermediate Cobalt(IV) Nitrido Complex and Its N-Migratory Insertion Product.” J. Am. Chem. Soc 2014, 136 (42), 15072–15078. [DOI] [PubMed] [Google Scholar]
- (65).Anson FC; Collins TJ; Coots RJ; Gipson SL; Richmond TG “Synthesis and Characterization of Stable Cobalt(IV) Coordination Complexes: Molecular Structure of Trans-[η4-1,2-Bis(3,5-Dichloro-2-Hydroxybenzamido)-4,5-Dichlorobenzene]Bis(4-Tert-Butylpyridine)Cobalt(IV).” J. Am. Chem. Soc 1984, 106 (17), 5037–5038. [Google Scholar]
- (66).Topich J; Halpern J “Organobis(Dioximato)Cobalt(IV) Complexes: Electron Paramagnetic Resonance Spectra and Electronic Structures.” Inorg. Chem 1979, 18 (5), 1339–1343. [Google Scholar]
- (67).Knizia G “Intrinsic Atomic Orbitals: An Unbiased Bridge between Quantum Theory and Chemical Concepts.” J. Chem. Theory Comput 2013, 9 (11), 4834–4843. [DOI] [PubMed] [Google Scholar]
- (68).Klein JEMN; Knizia G “cPCET versus HAT: A Direct Theoretical Method for Distinguishing X-H Bond-Activation Mechanisms.” Angew. Chem., Int. Ed 2018, 57 (37), 11913–11917. [DOI] [PMC free article] [PubMed] [Google Scholar]
- (69).Luo Y-R “Handbook of Bond Dissociation Energies in Organic Compounds;” CRC Press: Boca Raton, 2003. [Google Scholar]
- (70).Brunner E “Solubility of Hydrogen in 10 Organic Solvents at 298.15, 323.15, and 373.15 K.” J. Chem. Eng. Data 1985, 30, 269–273. [Google Scholar]
- (71).Dhar D; Yee GM; Markle TF; Mayer JM; Tolman WB “Reactivity of the Copper(III)-Hydroxide Unit with Phenols.” Chem. Sci 2017, 8 (2), 1075–1085. [DOI] [PMC free article] [PubMed] [Google Scholar]
- (72).Zhao N; Filatov AS; Xie J; Hill EA; Rogachev AY; Anderson JS “Generation and Reactivity of a NiIII2(μ−1,2-Peroxo) Complex.” J. Am. Chem. Soc 2020, 142 (52), 21634–21639. [DOI] [PubMed] [Google Scholar]
- (73).Jenkins DM; Peters JC “Spin-State Tuning at Pseudotetrahedral d7Ions: Examining the Structural and Magnetic Phenomena of Four-Coordinate [BP3]CoII-X Systems.” J. Am. Chem. Soc 2005, 127 (19), 7148–7165. [DOI] [PubMed] [Google Scholar]
- (74).Golombek AP; Hendrich MP “Quantitative Analysis of Dinuclear Manganese(II) EPR Spectra.” J. Magn. Reson 2003, 165 (1), 33–48. [DOI] [PubMed] [Google Scholar]
- (75).Neese F; Wennmohs F; Becker U; Riplinger C “The ORCA Quantum Chemistry Program Package.” J. Chem. Phys 2020, 152 (22), 224108. [DOI] [PubMed] [Google Scholar]
- (76).Handy NC; Cohen AJ “Left-Right Correlation Energy.” Mol. Phys 2001, 99 (5), 403–412. [Google Scholar]
- (77).Cohen AJ; Handy NC “Dynamic Correlation.” Mol. Phys 2001, 99 (7), 607–615. [Google Scholar]
- (78).Lee C; Yang W; Parr RG “Development of the Colle-Salvetti Correlation-Energy Formula into a Functional of the Electron Density.” Phys. Rev. B 1988, 37 (2), 785–789. [DOI] [PubMed] [Google Scholar]
- (79).York DM; Karplus M “A Smooth Solvation Potential Based on the Conductor-Like Screening Model.” J. Phys. Chem. A 1999, 103 (50), 11060–11079. [Google Scholar]
- (80).Weigend F; Ahlrichs R “Balanced Basis Sets of Split Valence, Triple Zeta Valence and Quadruple Zeta Valence Quality for H to Rn: Design and Assessment of Accuracy.” Phys. Chem. Chem. Phys 2005, 7 (18), 3297. [DOI] [PubMed] [Google Scholar]
- (81).Weigend F “Accurate Coulomb-Fitting Basis Sets for H to Rn.” Phys. Chem. Chem. Phys 2006, 8 (9), 1057. [DOI] [PubMed] [Google Scholar]
- (82).Grimme S “Supramolecular Binding Thermodynamics by Dispersion-Corrected Density Functional Theory.” Chem. - A Eur. J 2012, 18 (32), 9955–9964. [DOI] [PubMed] [Google Scholar]
- (83).Poater J; Solà M; Duran M; Fradera X “The Calculation of Electron Localization and Delocalization Indices at the Hartree-Fock, Density Functional and Post-Hartree-Fock Levels of Theory.” Theor. Chem. Accounts Theory, Comput. Model. (Theoretica Chim. Acta) 2002, 107 (6), 362–371. [Google Scholar]
- (84).Matito E; Poater J; Solà M; Duran M; Salvador P “Comparison of the AIM Delocalization Index and the Mayer and Fuzzy Atom Bond Orders.” J. Phys. Chem. A 2005, 109 (43), 9904–9910. [DOI] [PubMed] [Google Scholar]
- (85).Outeiral C; Vincent MA; Martín Pendás Á; Popelier PLA “Revitalizing the Concept of Bond Order through Delocalization Measures in Real Space.” Chem. Sci 2018, 9 (25), 5517–5529. [DOI] [PMC free article] [PubMed] [Google Scholar]
- (86).Becke AD “A Multicenter Numerical Integration Scheme for Polyatomic Molecules.” J. Chem. Phys 1988, 88 (4), 2547–2553. [Google Scholar]
- (87).Lu T; Chen F “Multiwfn: A Multifunctional Wavefunction Analyzer.” J. Comput. Chem 2012, 33 (5), 580–592. [DOI] [PubMed] [Google Scholar]
- (88).Krause L; Herbst-Irmer R; Sheldrick GM; Stalke D “Comparison of Silver and Molybdenum Microfocus X-Ray Sources for Single-Crystal Structure Determination.” J. Appl. Crystallogr 2015, 48 (1), 3–10. [DOI] [PMC free article] [PubMed] [Google Scholar]
- (89).Sheldrick GM “SHELXT - Integrated Space-Group and Crystal-Structure Determination.” Acta Crystallogr. Sect. A Found. Crystallogr 2015, 71 (1), 3–8. [DOI] [PMC free article] [PubMed] [Google Scholar]
- (90).Dolomanov OV; Bourhis LJ; Gildea RJ; Howard JAK; Puschmann H “OLEX2: A Complete Structure Solution, Refinement and Analysis Program.” J. Appl. Crystallogr 2009, 42 (2), 339–341. [Google Scholar]
- (91).Sheldrick GM “Crystal Structure Refinement with SHELXL.” Acta Crystallogr. Sect. C Struct. Chem 2015, 71, 3–8. [DOI] [PMC free article] [PubMed] [Google Scholar]
Associated Data
This section collects any data citations, data availability statements, or supplementary materials included in this article.